

Cobalt
-
Posts
4,908 -
Joined
-
Last visited
Content Type
Profiles
Blogs
Forums
American Weather
Media Demo
Store
Gallery
Posts posted by Cobalt
-
-
3 hours ago, mitchnick said:
BWI is -2.4 for the month. Yesterday's low of 32 is in the books. Sorry TCC.
Looks like that anomaly will be wiped out by a major warm spell that's progged to persist into November, one that'll cement this month as a top 5 warm October nationwide

-
1 hour ago, GaWx said:
Except that normals have warmed so much that modestly BN isn’t all that cold anymore. And then wait til we get to 2001-30 normals!
Which will be the warmest 30 year normals of our lifetimes until.. the next 30 year averages
-
 1
1
-
 2
2
-
-
-
30 minutes ago, FPizz said:
There is zero accountability in the 100s of CC posts and articles.
There is zero accountability in the climate denial/downplaying space. I have yet to see a CC downplayer apologize for wrongly claiming global temperatures had peaked with the "1998-2012 temperature pause", or for using the Antarctic sea ice peak in 2014-15 to tout the "more ice than ever" headline.
-
47 minutes ago, Cobalt said:
Where's that one post by Chesco touting the "highest sea ice to-date in 15 years" stat back in January? That has aged poorly.
I'm falling victim to greenskeeper's one gimmick but I would pay money for a worded explanation of each weenie reaction. The Chesco mention of the highest sea ice to-date since 2009 didn't warrant a weenie, but the opposite example does? We need a synopsis on greenskeeper weenie methodology
-
 1
1
-
-
8 minutes ago, forkyfork said:
area is lower than 2012 on this date
Where's that one post by Chesco touting the "highest sea ice to-date in 15 years" stat back in January? That has aged poorly.
-
1
-
 1
1
-
-
1 hour ago, ChescoWx said:
The below for the entire US sure looks a lot like Chester County PA - chill the past and warm the recent......

What's the source for this?
-
4 hours ago, csnavywx said:
I don't want to hear a *peep* about Martz, to be frank. His failed predictions continue to pile up, including sea ice *just this spring*. Always a reliable fade. They always get loudest right before they disappear.
What did he say about sea ice this past Spring?
-
On 7/2/2024 at 11:07 PM, ChescoWx said:
I broke the forum!
What’s your takeaway from the above headline? It seems that Phoenix has had quite the marked increase in temperatures as of late.
-
1 hour ago, ChescoWx said:
Red Herring = No data
This seems to be in response to Don’s first 4 answers. What was your takeaway from his other answers to the questions? I find that his response was incredibly well-written.
-
2
-
-
20 hours ago, ChescoWx said:
Well, it was hotter during June 1853
He had to go out of the official NWS data range to find a hotter example? Impressive
-
3 hours ago, ChescoWx said:
5 of the 10 starts are before 2000.
Oh wow, so 5 of the warmest starts to the year have occurred in the past 24 years? That's concerning.
-
2
-
1
-
-
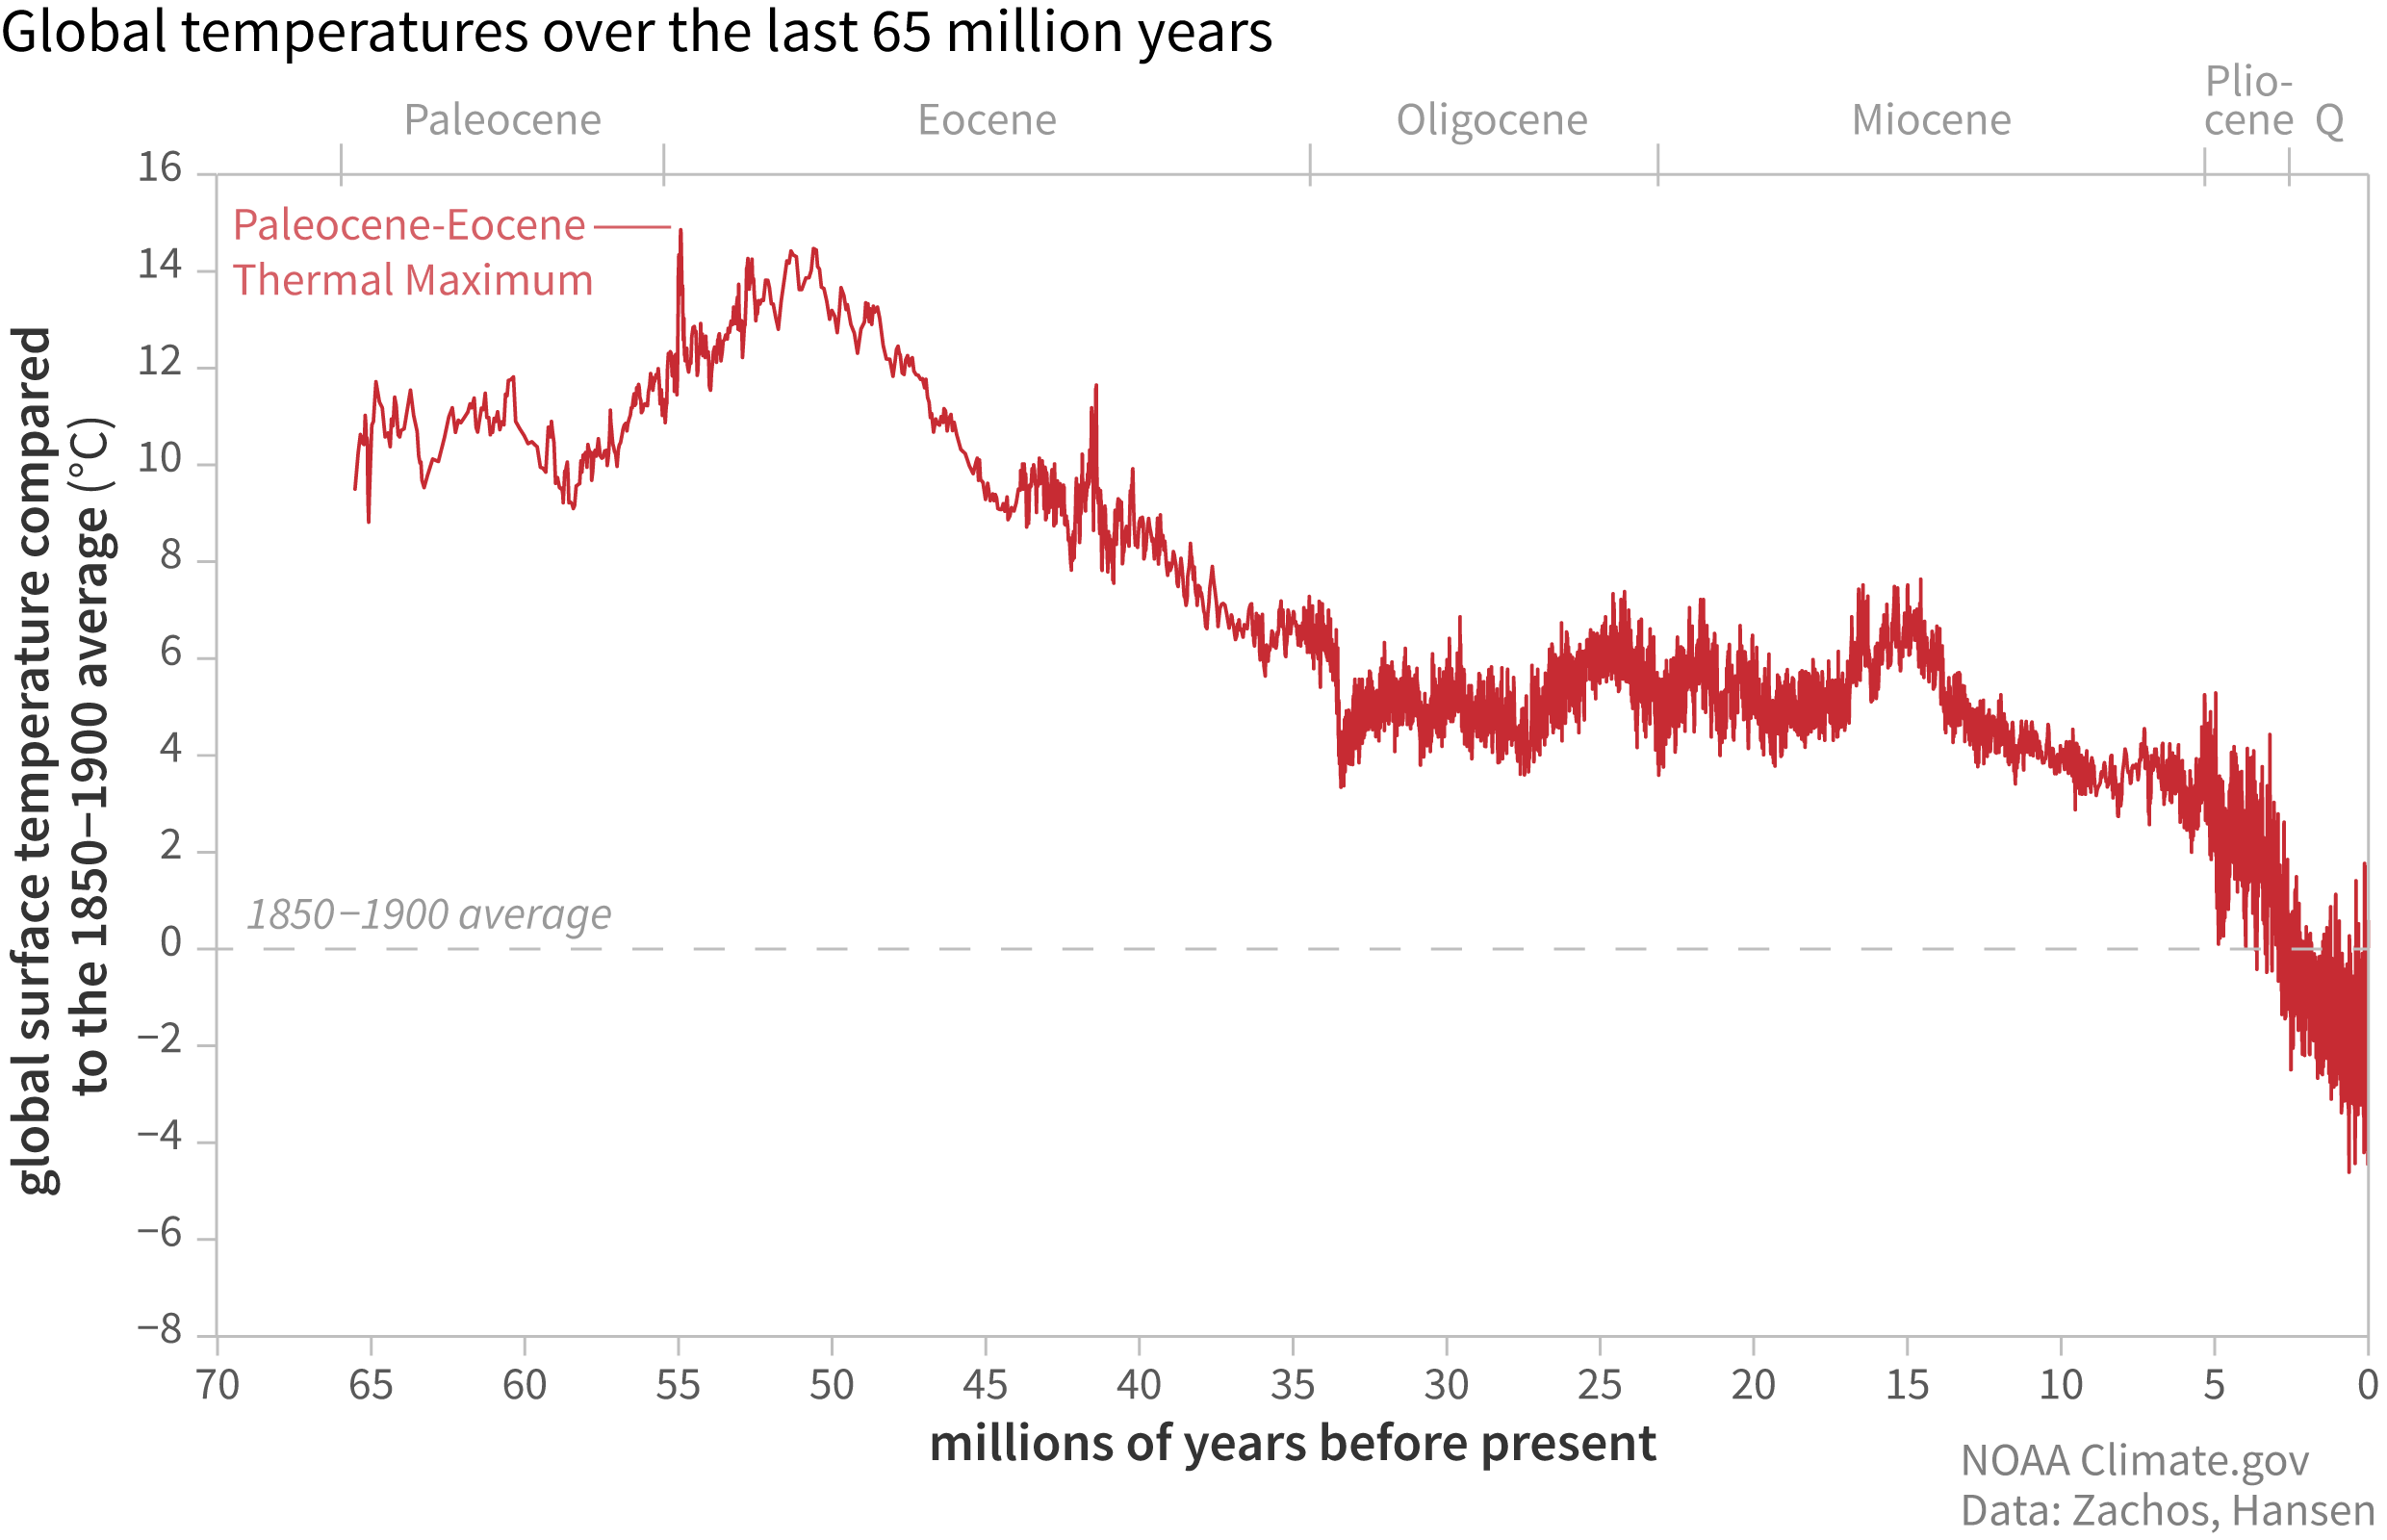
On 4/6/2024 at 12:30 PM, ChescoWx said:
Let's go back even further Charlie! The Earth is essentially at its coolest point in the last 65 million years, but climate alarmist love to tell us the planet is “too hot” because temperatures are 1.2°C warmer than they were in 1850, the tail end of the Little Ice Age!!
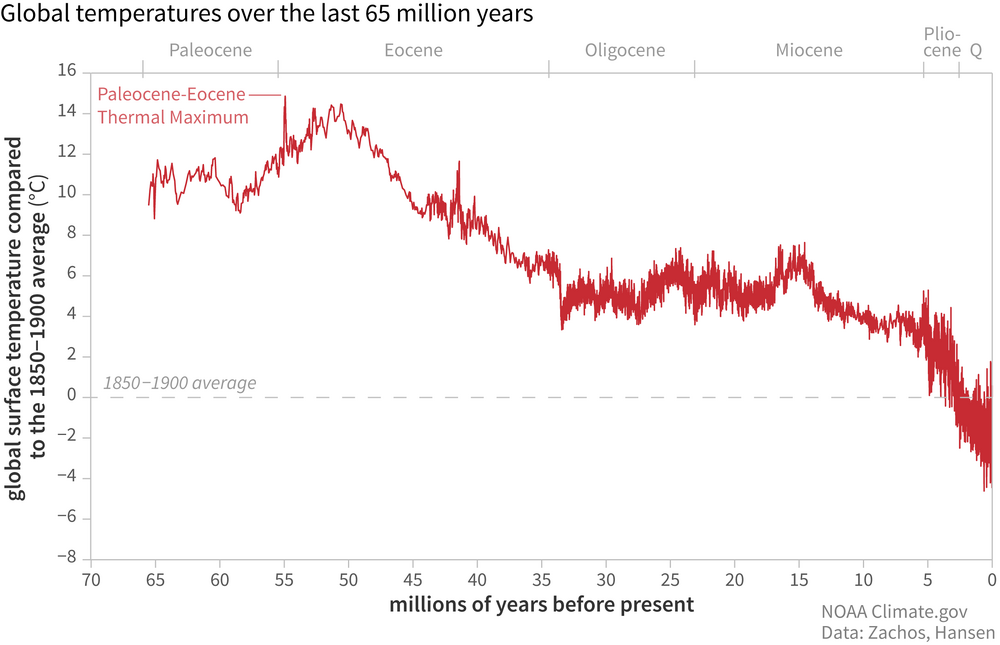
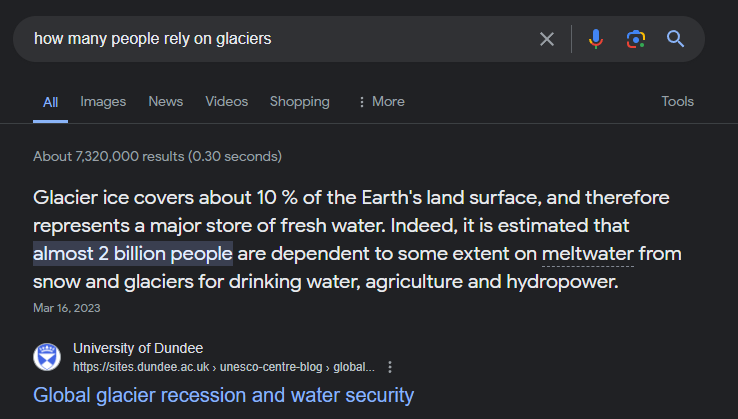
It seems like that temperature dip was necessary for human life to come around and flourish in the first place. What's true in the present day is that humanity can't support itself in an ice-free world. 2 billion people rely on glaciers for drinking water, power, and agriculture.
-
1
-
-
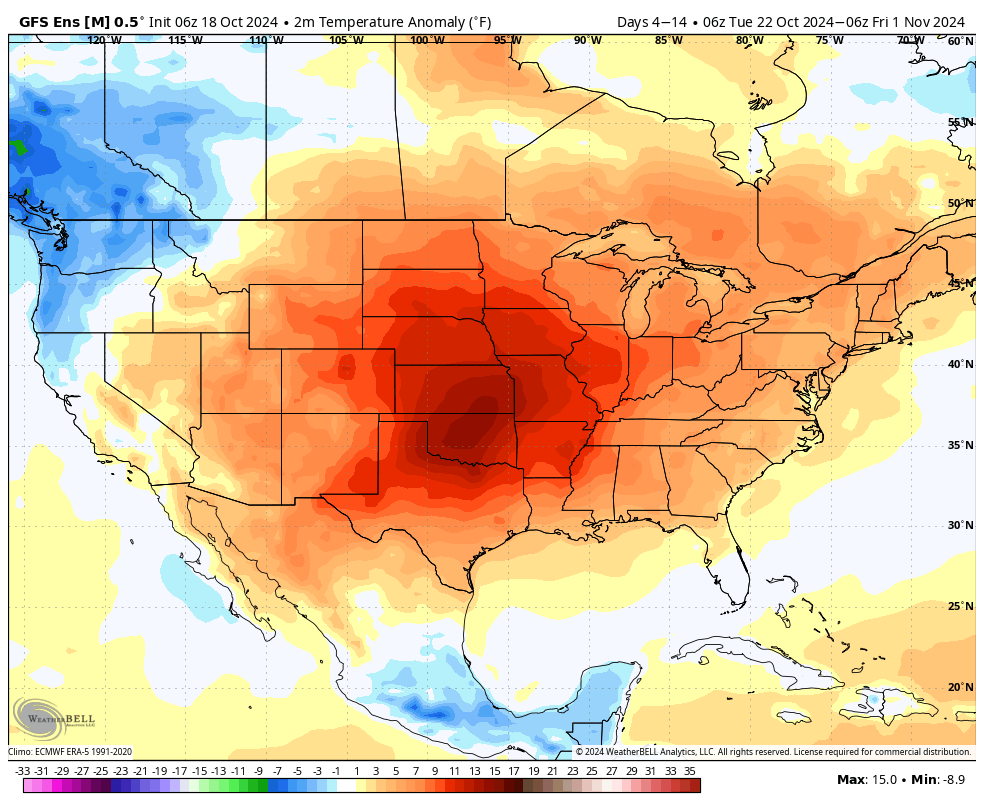
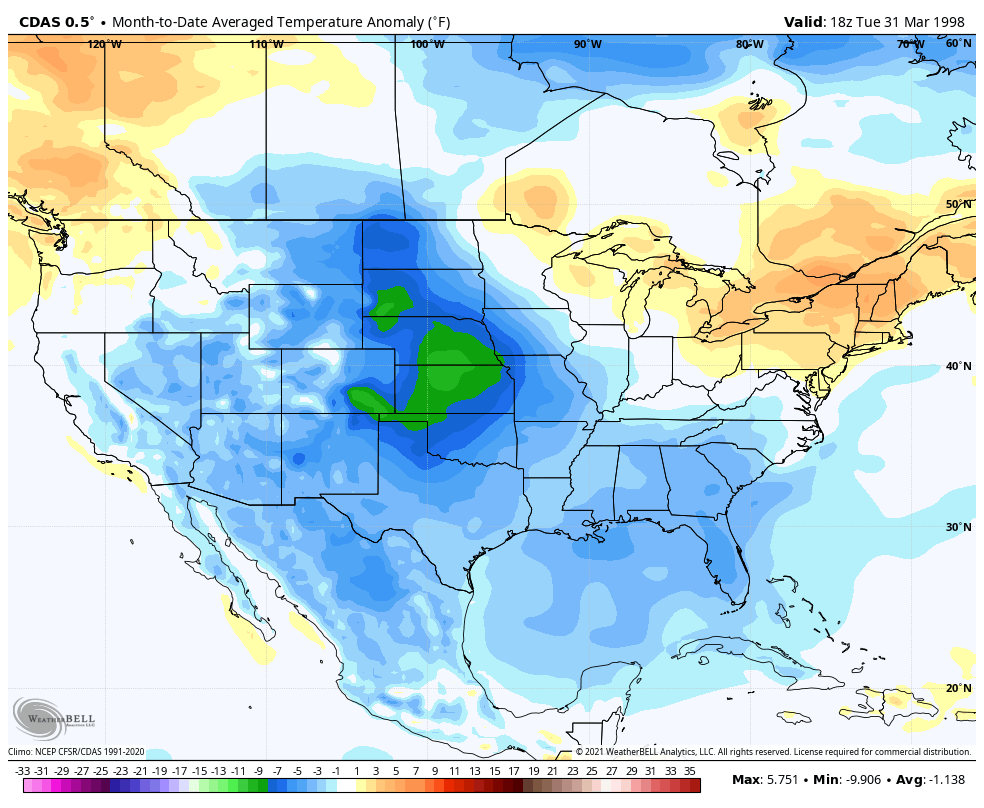
2 hours ago, ChescoWx said:
Is global cooling underway off the east coast of the US?? I guess global warming is the cause of the warming off the coast of Africa.
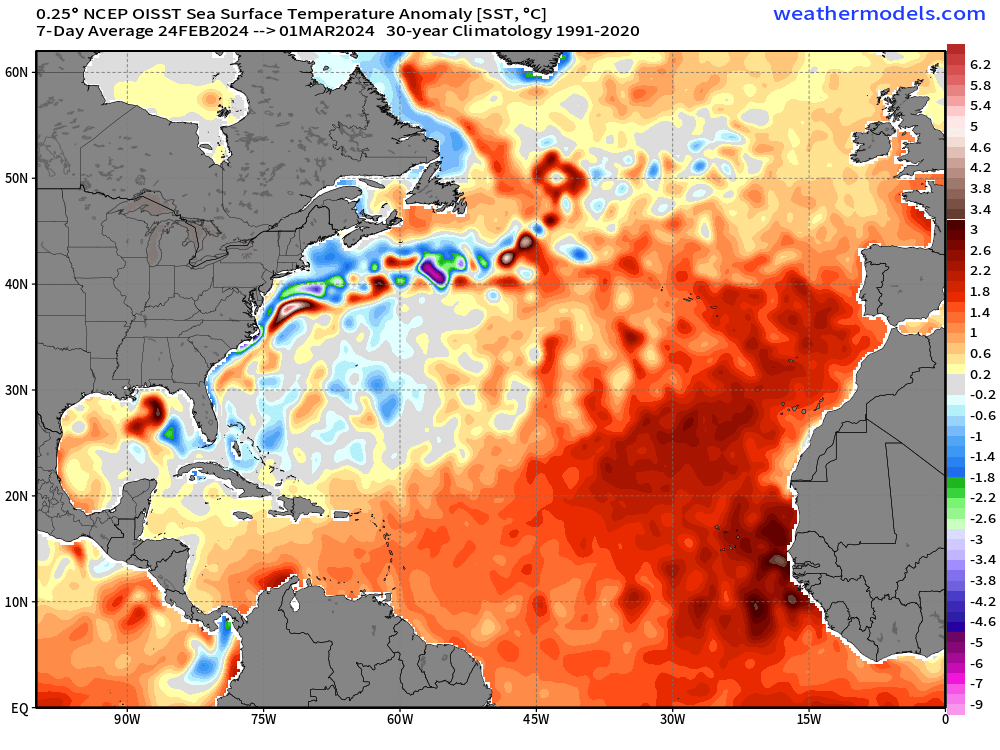
The entirety of the area depicted, averaged out, depicts a positive anomaly against the 1991-2020 averages. The red very obviously takes up more space on the map than the limited blue hues.
-
1
-
-
17 hours ago, TheClimateChanger said:
As we round out the first quarter of 2024, I thought it might be a good time for a review of temperatures. Through the first quarter of 2024, it's been quite toasty in central Pennsylvania.
Williamsport: Third warmest start to the year [of 130 years], behind 2012 & 2023.
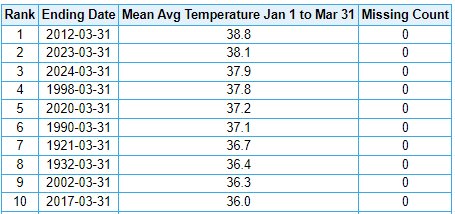
Harrisburg / Middletown: Sixth warmest start to the year [of 136 years], behind 2020, 2023, 1998, 2012 & 1990.
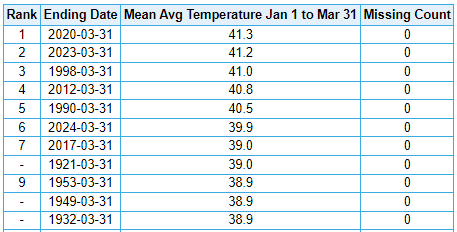
Yeesh, so many recent years in those charts.
-
1
-
-
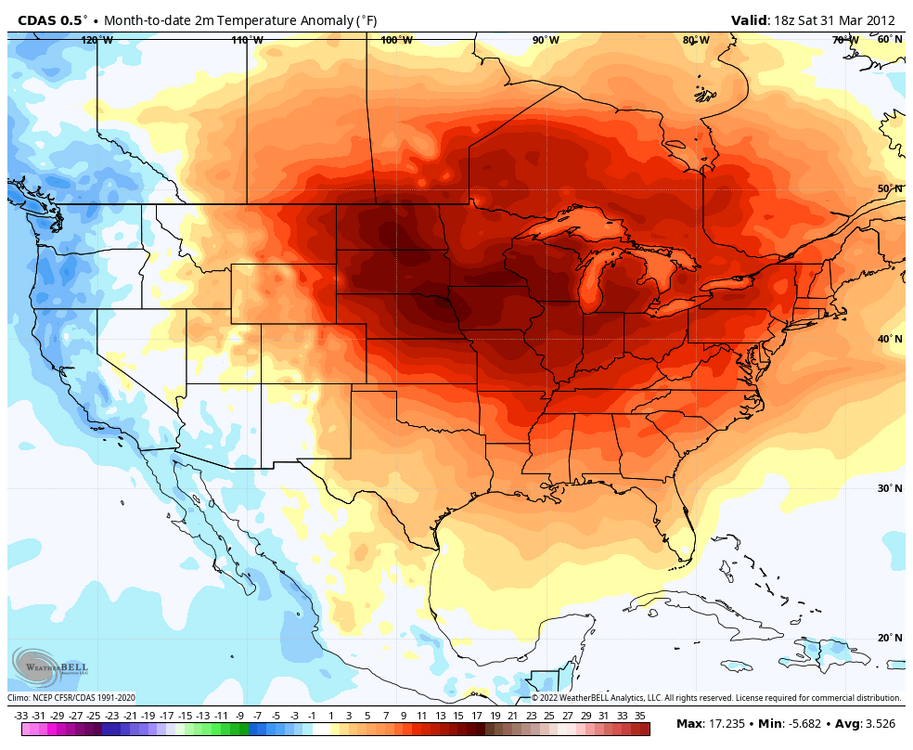
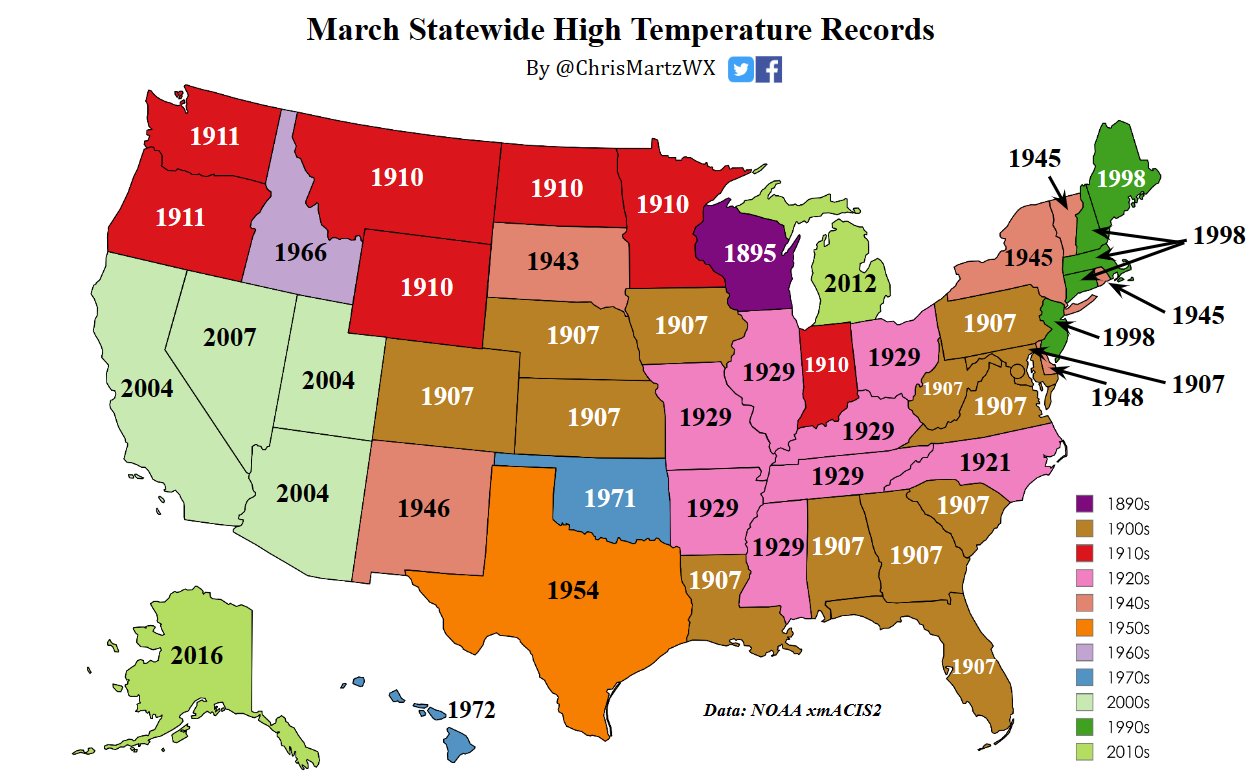
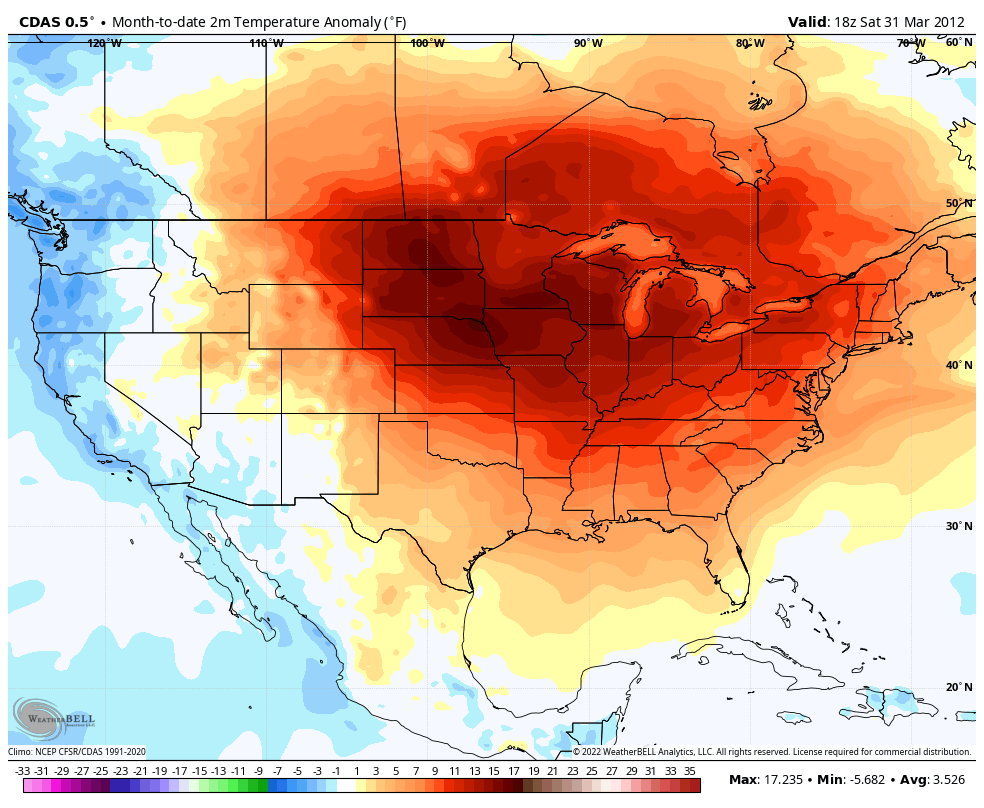
17 hours ago, ChescoWx said:
Below is a great list (Thanks Chris Martz) of all-time US by State high temperature records (of course before adjustments NOAA adjustments etc.).
Per Chris "35 states set their “all-time” March monthly record high temperatures prior to 1955. Thirteen states set theirs in 1907 alone, the most in a single year and a single decade. Eight states set their March records in the 1920s, seven of which were in 1929. I ran the numbers by hand from NOAA's database on xmACIS2 and have been consulting with just about every state climatologist to confirm that these are in fact legitimate, as NOAA NCEI only lists records set for all months, not individual months."

It looks like this is referring to daily temperature records for one location, which feels way less statistically significant than a 31 day temperature average. That stripe of 1998 on the East coast might've been hit on a particularly warm day, but the month on a whole is no comparison to a March like 2012. I feel like that is worth mentioning in your post.

-
1
-
1
-
-
Crazy how the late February HECS loading pattern very quickly became the 2025-2026 winter loading pattern instead
-
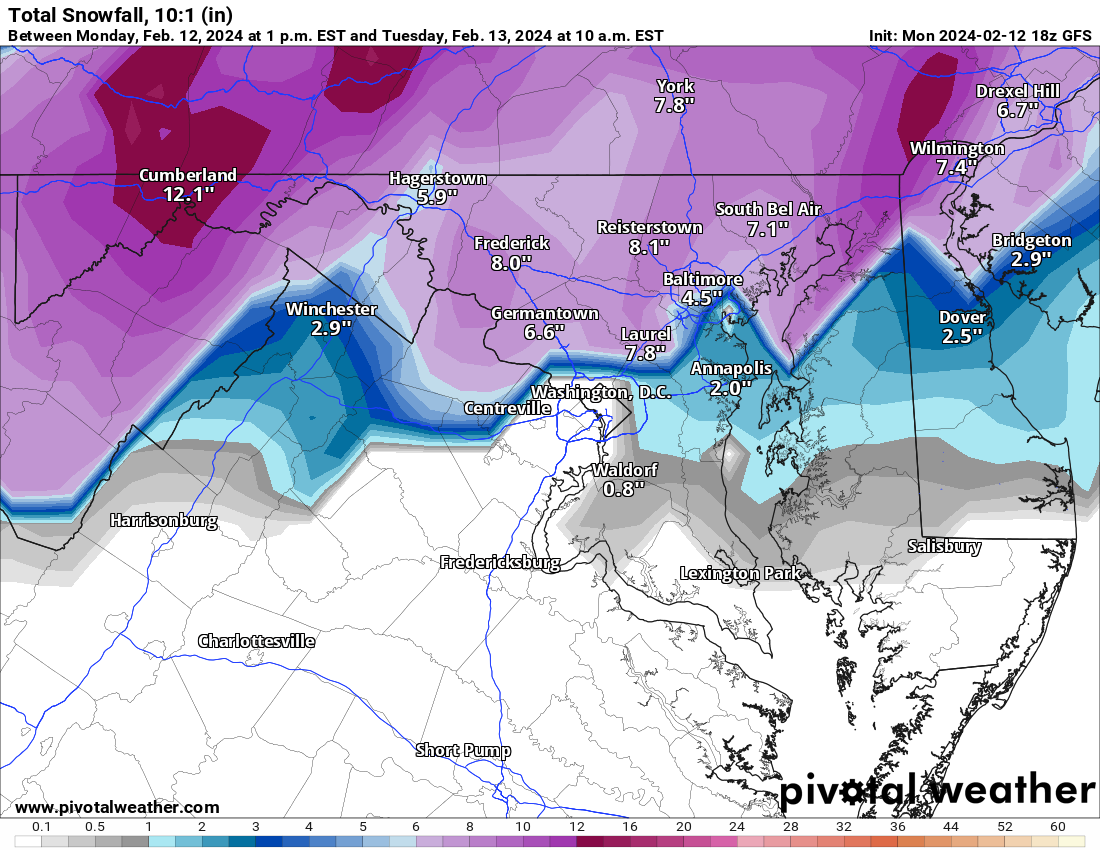
Moderate (non-accumulating) snow atm. 2/24 storm confirmed

-
3 minutes ago, StormyClearweather said:
Ahem

Georgetown snow shield working overtime
-
2
-
-
19 hours ago, bdgwx said:
Yes. Solar output is correlated with warming/cooling of the climate system. The modulation is at most 0.4 W/m2 of radiative force from trough to peak. To put that into perspective the Earth Energy Imbalance (EEI) is currently around +1.9 W/m2. So this uptick in solar activity accounts for at most 10% of the energy uptake. Of course, once SC25 peaks and solar output drops in the next few years the solar effect will turn negative. The rate at which the climate takes excess energy will decline a bit as a result, but the EEI still going to be significantly positive meaning that the planet will continue to warm.
Oh. What about the other 90%? Where does that come from?
-
51 minutes ago, Ji said:

That’s the one signal that hasn’t wavered. Been on the guidance since the Mesopotamian model was the go-to.
-
2
-
-
6 hours ago, wishcast_hater said:
He attributes all of this to sunspot activity or solar activity which makes far more sense because it is the main driver of weather.
Oh, that is definitely interesting. Has sunspot activity gone up along with the recent warming, or is it just a temporary blip unrelated?
-
2 hours ago, wishcast_hater said:
For those who have an open mind… (because real “science” is supposed to be open to all possibilities)
.Hello, I watched this video and believe I got the key points, but I was wondering, what were the key takeaways/points/arguments from the video, for you? Just making sure I'm on the same page with what you and dseagull gathered from this video. Thanks!
-
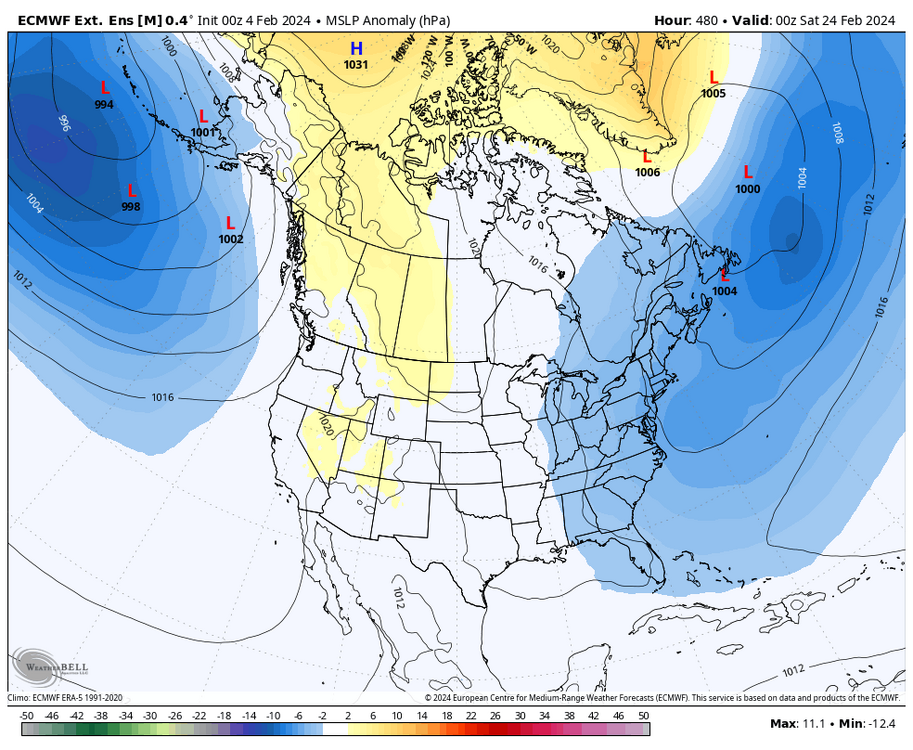
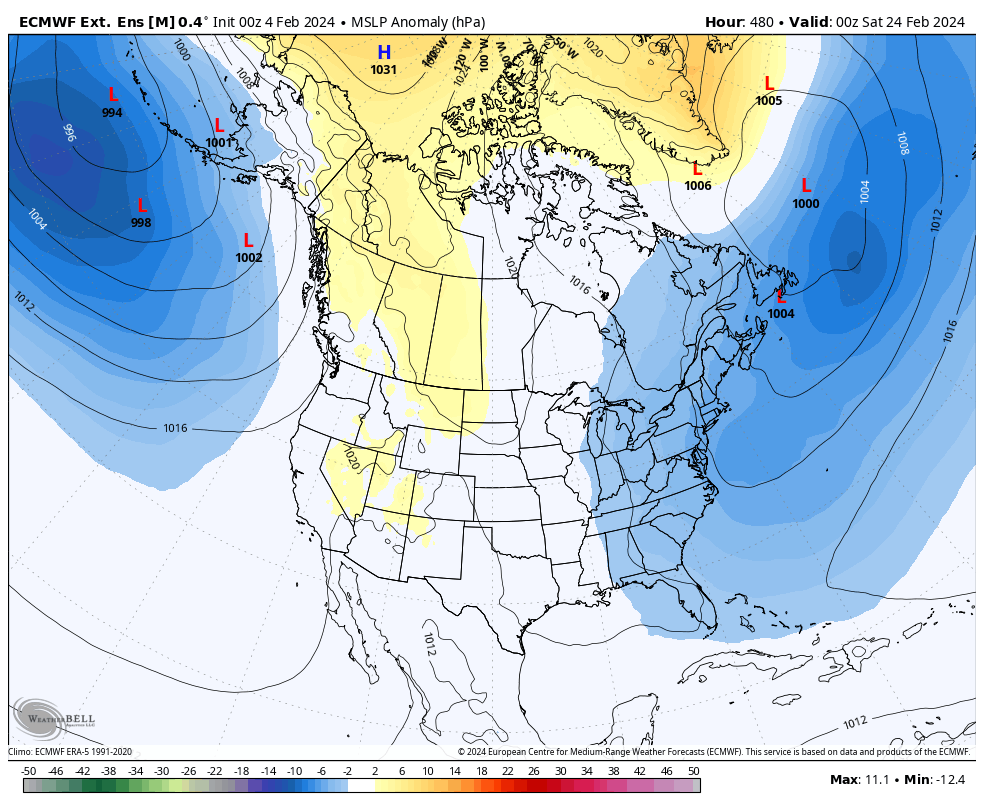
39 minutes ago, brooklynwx99 said:
my guess is that you get a vigorous wave coming onshore around the 20th, the Aleutian low retrogrades, spiking the PNA, and that's how you get clobbered. everything is in place there, TPV is perfectly elongated
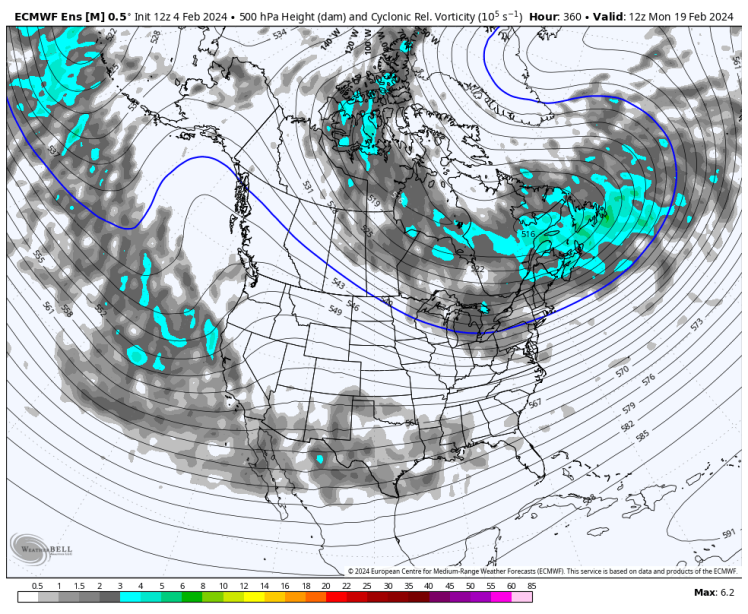
Weeklies from today are maintaining that potent storm signal centered at the 23rd/24th. From what I can tell, that signal has been there in some form on the weeklies since it was 30 or so days out.
-
8
-


2024-2025 La Nina
in Weather Forecasting and Discussion
Posted
he's not wrong though? You certainly wouldn't have shared a Judah Cohen tweet touting a high snow cover ranking,