MAG5035
-
Posts
6,078 -
Joined
-
Last visited
Content Type
Profiles
Blogs
Forums
American Weather
Media Demo
Store
Gallery
Everything posted by MAG5035
-
Looking at mesoanalysis, dynamics are definitely the big factor in the severe threat from this line. Effective helicity is pretty notable in a narrow corridor of west central PA just ahead of the line. Same goes for effective bulk shear as well. Limiting factor is CAPE, which is only of the few hundred J/kg variety in western PA. Thus, QLCS spinups are quite possible directly associated with the line given significant helicity/shear. Eastern PA still pretty stable, so we shall see how the atmosphere evolves as the line traverses PA. We’re def in the warm sector here. Quite warm/humid considering the date (66/58ºF on the station here). Winds are really ripping. KAOO wind is SSE 33mph gust to 45 with a high gust of 55mph.
-
Multiple tornado warnings with the portion of the line in western PA roughly from Ligonier to Indiana
-
If you use mobile you might not see it but there’s a sidebar that shows stuff like most popular posts and days as well as the top 4 posters in the topic. Bubbler and ITT are #1 and #3. Blizz and mitchnick are the other two. Mitch has been posting in the Mid-Atl threads and there hasn’t been much snow digital or otherwise for blizz to share. Definitely a dynamic changer for sure. Those 4 combined account for like 44% of the posts in this thread haha. Also, despite the general winter is dead theme today..it’s probably not going to be dead for you tonight. I expect at least some of that precipitation in northern Ohio and western PA to make it over as far as you and it’ll likely be mostly snow. Nothing serious but could be a quick coating. Not much is progged to make it past the I-99 corridor in the rest of C-PA otherwise.
-
0.61” here with this morning’s round of rain. Best dynamics in terms of shear/helicity/high winds aloft reside with the main area of heavy rain (with imbedded line) traversing Eastern PA currently. I think severe potential is there but limited with secondary development of storms late this afternoon in the dry slot. Western PA has built up surface CAPE of several hundred J/kg back in the dry slot per mesoanalysis and some decent LI and low level lapse rates which has led to some storm development. I think the main threat is mainly sub severe gusty winds/hail with the potential for some more organized storms strong enough to warrant a few warnings as winds aloft aren’t quite as strong there. Tornado threat not zero but very unlikely IMO. Best helicity as mentioned is associated with the main stuff moving through eastern PA. Modeled CAPE on high res guidance going into this evening is best in western PA decreasing to not very much once to the Sus Valley. Thus I think main threat is a round or two of gusty showers/storms with maybe a warned storm or two.
-
Made it up to 60ºF here.
-
Well, the 18z GFS just did it again.
-
The only period I’m semi-interested in for anything wintry for the time being is that wave being progged in about the 3/7-8 timeframe, which comes on the heels of what likely will be a fairly potent GL cutter that will hopefully deliver some kind of decent rainfall in the eastern half of the state. Not expecting a phasing scenario so will have to see how the wave tracks across. 18z GFS tracking similar to the 12z Euro with the GFS a bit colder. One issue I’m already seeing progged is low level and surface temps could be an issue in the lower elevations like the Sus Valley if the wave delivers any kind of respectable precip to C-PA. After that we look to moderate significantly going into mid-month as despite the NAO forecast to go negative we counter with a pretty positive EPO and negative PNA. Major strat warming over the pole and a displacement/stretching of the stratospheric PV could eventually have implications down the road for late month, but of course you need more to go right storm wise and bigger - temp anomalies with respect to normal to remain in the snow game when you get to that late in the season. Climo wise CTP mentioned in their AFD today that MDT finished met winter (DJF) at 31.1ºF for average temp, which was 2.2ºF below normal. Good for the coldest winter since 2014-2015. Too bad that came with only 15.6” of snowfall, which is about 66% of average to date. Worse yet in the snow dept is Philly, only at 8.1” (42% of normal). Places like the deep Louisiana bayou country, New Orleans, Pensacola, etc have technically had snowier winters with that historic storm they got. Also underscores how dry that part of the state has been this winter as well as Philly is at 2.98” total precip YTD out of an average 5.99”. Driest was 1992 with 2.19”.
-
I do believe he was referenced at the tail end of the CNN article about the terminations. They do. I give my opinions in here too, mostly on the weather. I don’t find it necessarily off topic or “non weather related” to discuss the impact of terminating hundreds of very intelligent people in an agency that maintains/improves/provides weather forecasts and life saving warnings to all US and maritime interests, free and open access to computer modelling, analysis and data that all private weather entities (including free model sites) and weather enthusiasts like yourself use. All for an annual cost to the taxpayer that amounts to less than two months subscription to DT’s newsletter. But that’s just my opinion I suppose.
-
That Route 153?
-
It has, the LSV has generally had a much better winter than last winter.. but still running a few to several inches below normal to date (closer to normal along the M/D line). The Laurel’s region has had a much better snow season with respect to normal than probably the last several winters given long periods of favorable flow for upslope and lake effect. Climo stations like Laurel Summit and Somerset are running solidly above average to date. The actual central part of the state off the mountains has been lacking in the snow department the most, due to a lack of synoptic snows. State College is behind about 10 inches for the winter to date. Out of 16 measurable snowfalls I’ve recorded this winter so far to get to only 23.9”, the Jan 19-20 snow event was the only one that got past 3 inches here… and it took the post storm upslope/LES to get to that 4.1”. I still have about 6 inches just to get to last year’s lackluster snow total. The rough average in this part of town against the ridgeline is roughly in the 45-50” range. Despite that, aside from about a day or so in between sleet events the first week of Feb during pinger week 2025 (I cracked 60ºF here that week), I’ve had some kind of snow on the ground every day since New Years. The 3-4” of it on the ground right now is just about bulletproof. The lack of a signature storm in our area has obviously been the biggest knock on what has otherwise been probably the coldest winter temp wise overall since 14-15. Can that change in March? Certainly.. next month isn’t looking overly warm in the longer range stuff for the northeast right now. I think we’ll continue to have a pattern that will at times present the opportunity, but we’ll have to see if things can actually line up for a change. I had been eyeing that Feb 28-Mar 1 period that had amplification and a big storm in some runs a couple days ago.. but that has largely disappeared.
-
Did ChatGPT incorporate the 1-2” of powder and a bump commentary from a couple days ago? Haha
-
Still quite windy here, and the temp has fallen back all the way to 15ºF already.. so definitely not pleasant out. My station had a peak wind of 51 mph early today. No real major direct issues from the wind around here fortunately, other than the combo with the snow bands and blowing and drifting last night. A lot of the secondary back roads around here were tough to drive on last night and early this morning.
-
In the middle of a heavy snowband currently. I’m not sure how much snow has fallen from these bands tonight but the amount of blowing and drifting on the roads around here has made this the most impactful event of the season IMO. This has easily been an advisory caliber event with near blizzard conditions at times.
-
Around here both KAOO and KJST have had 58mph peak wind gusts so far to go along with the 59.5mph peak gust I got here at home earlier.
-
I guess the strength of the cold air mass pressing with that displaced TPV isn’t something to be overlooked either with a large area of more than -30ºF below average in a big portion of the Central US and Lower Ohio Valley. That probably could be an argument the other way that the boundary that southern stream wave runs on ends up being further south in a more progressive/unphased scenario. Really wish we could’ve been able to build the big western ridge to amp this setup. I still think the 500mb vort passage itself is going to generate a lighter snow event on it’s own, as there is likely to be some interaction.. even if it’s too late to draw in the coastal low. That does seem to have pretty solid model support across the board.. even with the more progressive and southeast solutions. That’s something where the finer details won’t be modeled well until it’s solidly into the range of the meso stuff.
-
It’s pretty wild outside right now. Most of the roads around here have snow on them from the snow falling and/or blowing around and they all flash froze underneath that. Certainly seems like the biggest wind event of the winter in the early going.
-
And I had a gust on the weather station to 59.5mph while I was writing all that.
-
Like I said last night, I see a problem of amplification. The true big KU events typically have an established anomalous western ridge. 3 of those 4 storms mentioned in that post have them, with the March 2017 example in particular being the classic western ridge axis positioning for a C-PA snowstorm. I dunno if Dec 2020 is a good overall comparison to the setup happening here. Anyways, as mentioned last night and by others here and there, the shortwave progged to come into the west coast Wednesday dampens the ridging that tries to pop up… that keeps the southern wave progressive and elongates the interaction with the closed northern branch 500mb feature. If I recall correctly, I think even JB mentioned that feature several days ago as something that could screw this up being a really big storm. He’s since been all in on this being big though. I just don’t see how this makes the full turn up the coast to be a full blown hammer for everyone. What I could see is the how the NAM handles the southern stream wave and what boundary that runs on. Theoretically one could think that jives better with progged positioning of the other mid level features I suppose. But it better start getting some other support. This is still going to have a swath of pretty significant snows with it, but I think the swath will end up confined much more than if this were able to fully phase in and blow up. That still seems to favor south of here at the moment. And again, the closed 500mb low is progged to pass right through PA. That at least should still suggest a likelihood of a lighter snow event in a sizeable portion of PA even if the heavier snows of the southern wave goes too far south and east for most in here.
-
It touched 38ºF here early this afternoon but it couldn’t have been for more than an hour or so. That’s how most of these CAD ice events roll around here despite whatever major warm push any model ever shows. Not to mention the surface low tracked right through PA and not the lakes… there wasn’t ever going to be a major warm push even in the southern tier. We were back to snow before 4 on the back end and now the upslope is starting to set up along with the winds ramping up. Winds weren’t too crazy right after FROPA but last 10-15 min have had some pretty big gusts. That plus the sideways snow already has the roads deteriorating again. Temp down to 28ºF. Other than the compaction of the new snow from the ice, there was little to no real melting of anything. Surprised no one noticed CTP and PBZ put Somerset and Westmoreland/Fayette Ridges zones in a blizzard warning through a good portion of tomorrow. I’m sure Cambria is occasionally going to have those type of conditions as well.
-
We might not be a snowtown but we do ice like no other haha. Still around freezing. This is my parents place a few miles up the road in Bellwood
-
Here’s my take on next week’s system. I’m seeing a problem of amplification out west right now. If you’re gonna throw in classic big east coast storm comparisons like a Jan 96 et al you better have a good western ridge set. What I’m seeing in the progs today is there’s shortwave coming ashore on the west coast that seems like its dampening/pushing the ridging that pops up before it ever really builds to allow that 500mb shortwave in the northern plains to drop in and bring the coastal up. So instead the southern feature goes out ahead and elongates the whole thing and doesn’t allow that coastal to turn the whole way up. I think the eventual handling/interaction of that shortwave that comes into the west while all the rest of this is coming out on playing field is going play a big part on whether this comes fully back to a big threat or not. Or.. if some part of the Mid-Atlantic piles more snow up below us. But, if the coastal does end up going wagons south and east with the primary coastal in the end… I do still think a widespread lighter to perhaps even moderate snowfall in places is quite possible in PA from the upper feature, as it’s a pretty strong 500mb low that tracks over the state and there will still likely be some kind of interaction with the southern feature in that scenario. So while I’m fairly pessimistic about scoring the big hitter at the moment I’m definitely not thinking this is a complete non-event.
-
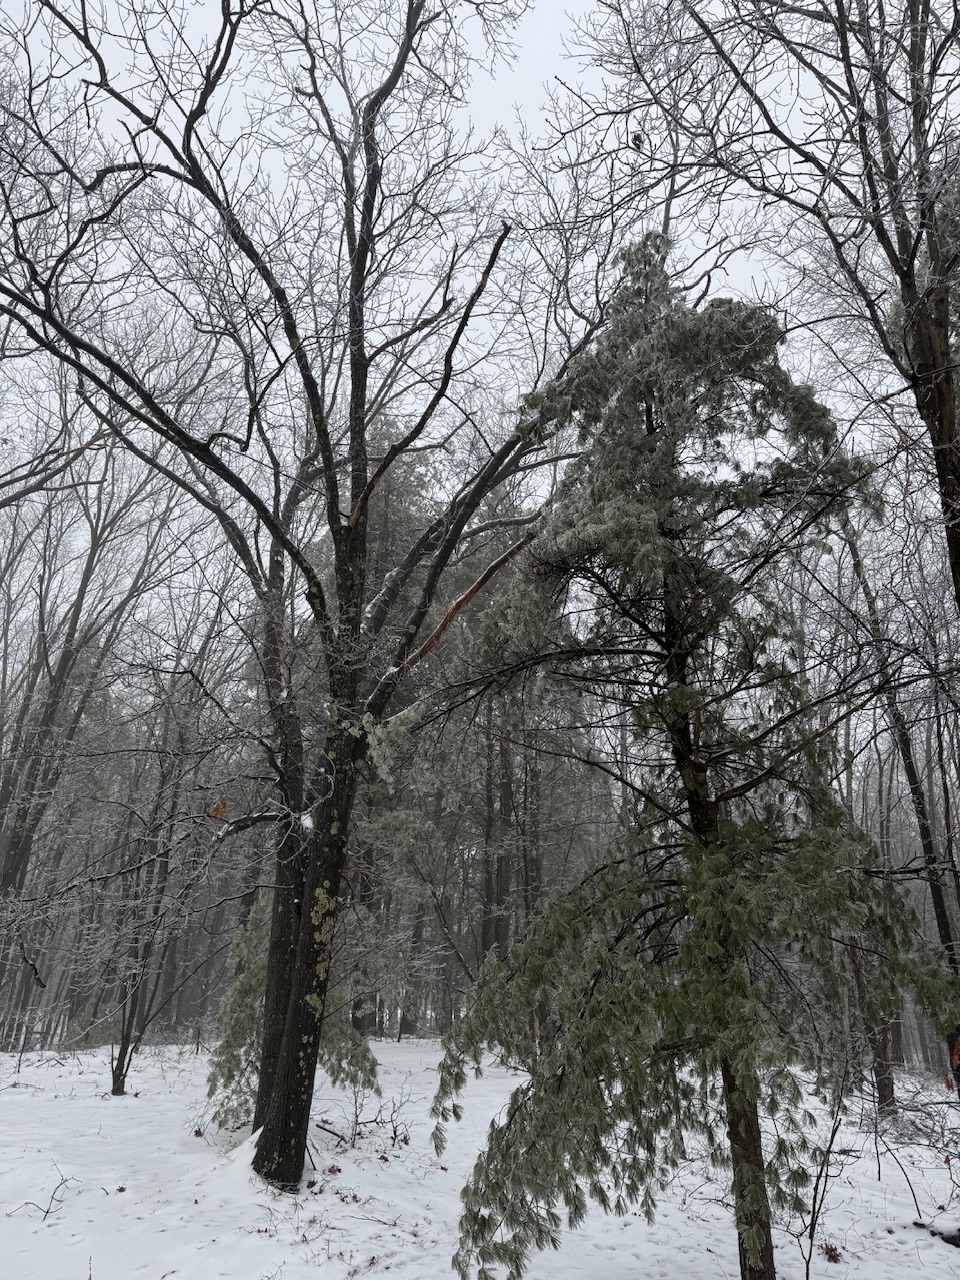
Been pretty busy today. 2.4” (tied for second biggest snowfall this winter lol) was my total snowfall this morning and it’s been occasional freezing rain/drizzle since. Still at 31.6ºF and still actively icing on the trees and the driveway with the next batch of rain coming in. Don’t expect much movement in temp here until the mid-morning most likely.
-
The one Euro thing that isn’t on board for next week currently is the EuroGPT. That thing’s been even more of a whiff than the GFS the last couple runs.
-
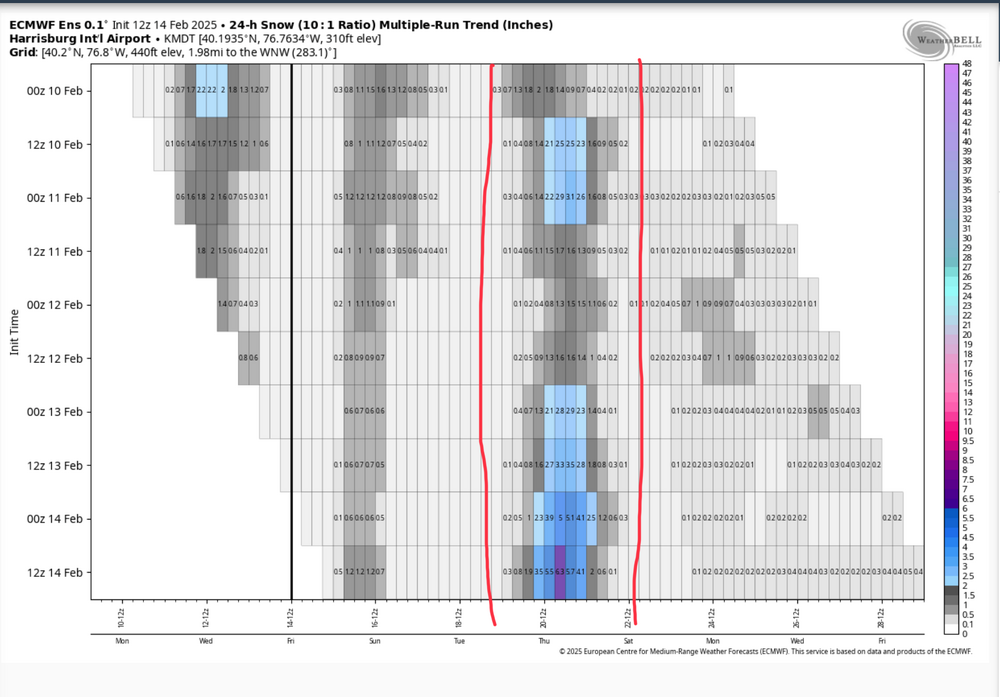
It’s still a really solid signal from the ensemble at this range as it has like 30 members with a warning snowfall and the vast majority with an advisory event. Although the Euro is by far the best ensemble at the moment compared to the GEFS and Canadian ensemble. Here is it’s multi-run snowfall mean trend the last 4 days. It’s definitely trending in the good direction currently.
-
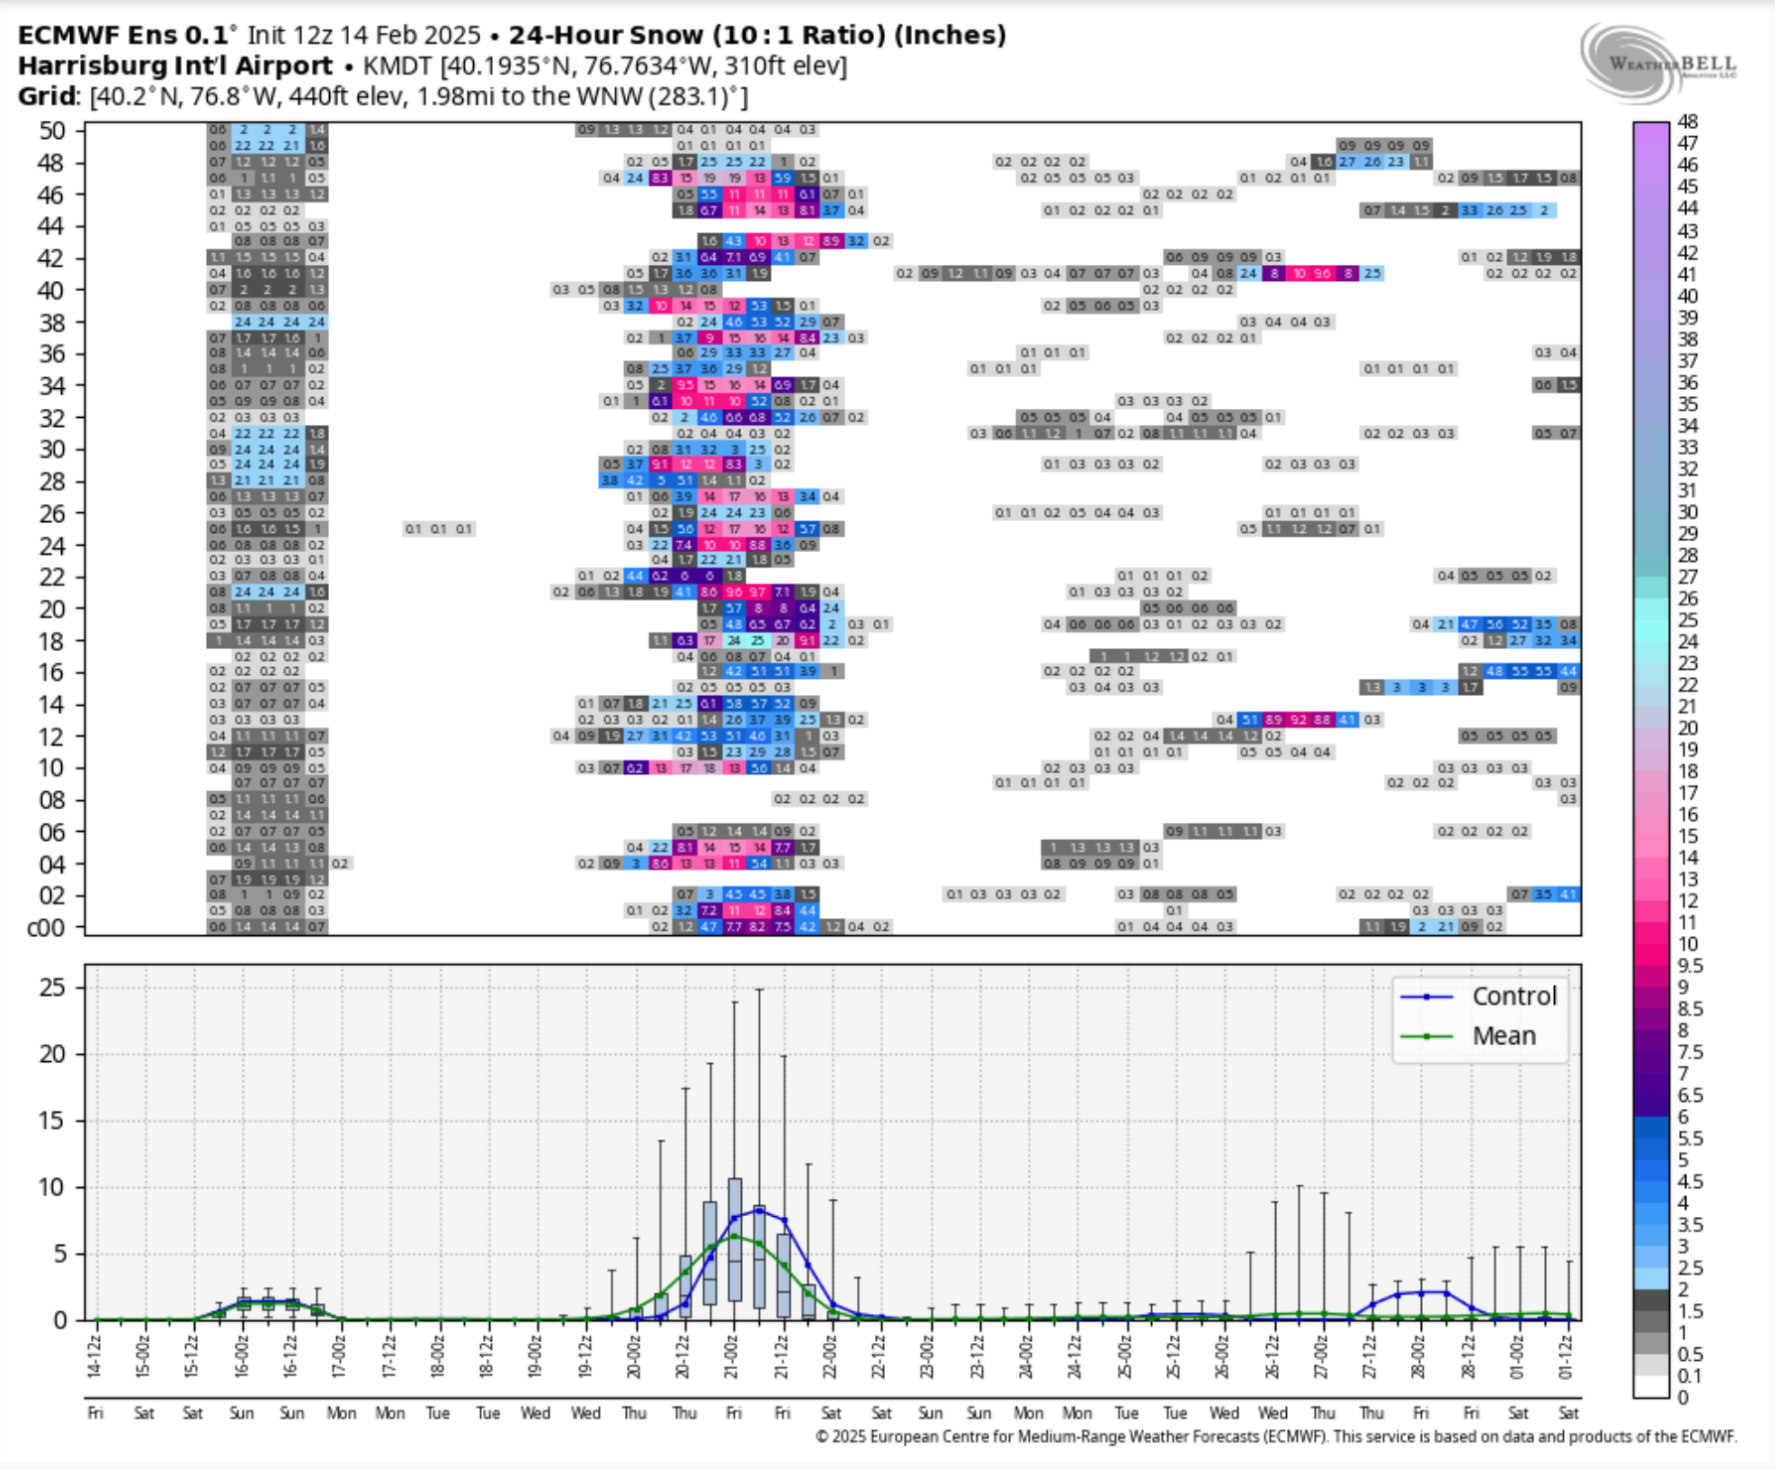
Here was MDT’s plume from the 12z Euro ensemble. About 18/51 with a double digit snowfall.