

LibertyBell
-
Posts
39,562 -
Joined
Content Type
Profiles
Blogs
Forums
American Weather
Media Demo
Store
Gallery
Posts posted by LibertyBell
-
-
18 minutes ago, bluewave said:
70°+ Junes are becoming the new normal for Long Island.
Time Series Summary for ISLIP-LI MACARTHUR AP, NY - Month of Jun
Click column heading to sort ascending, click again to sort descending.1 2024 72.0 0 2 2010 71.9 0 - 1999 71.9 0 3 2025 71.6 2 - 2008 71.6 0 4 1994 71.3 0 5 2001 70.9 0 6 2020 70.7 0 7 2021 70.6 0 8 2014 70.5 0 - 1991 70.5 0 9 1984 70.1 0 10 2011 70.0 0 of those, 2010, 1999 and 2025 (so far) are looking pretty good. The others were boosted by elevated minimums.
-
17 minutes ago, bluewave said:
70°+ Junes are becoming the new normal for Long Island.
Time Series Summary for ISLIP-LI MACARTHUR AP, NY - Month of Jun
Click column heading to sort ascending, click again to sort descending.1 2024 72.0 0 2 2010 71.9 0 - 1999 71.9 0 3 2025 71.6 2 - 2008 71.6 0 4 1994 71.3 0 5 2001 70.9 0 6 2020 70.7 0 7 2021 70.6 0 8 2014 70.5 0 - 1991 70.5 0 9 1984 70.1 0 10 2011 70.0 0 To be fair, summers should always be judged by number of 90/95/100 degree days.
-
2 hours ago, bluewave said:
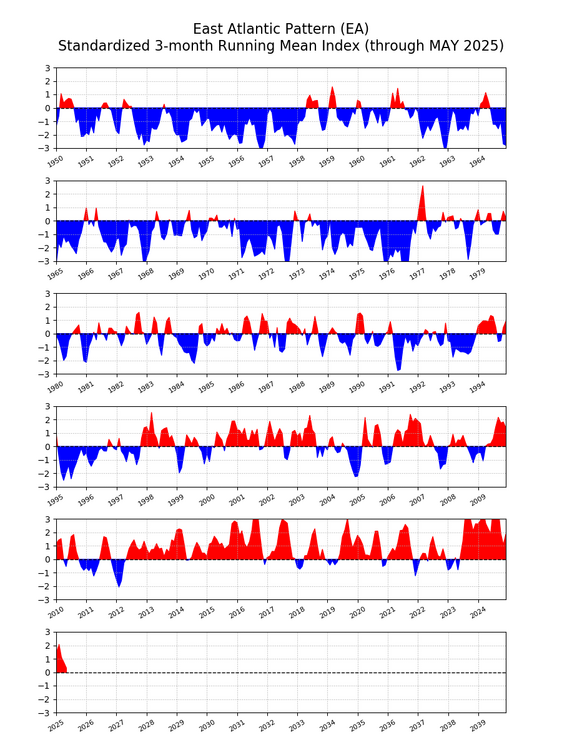
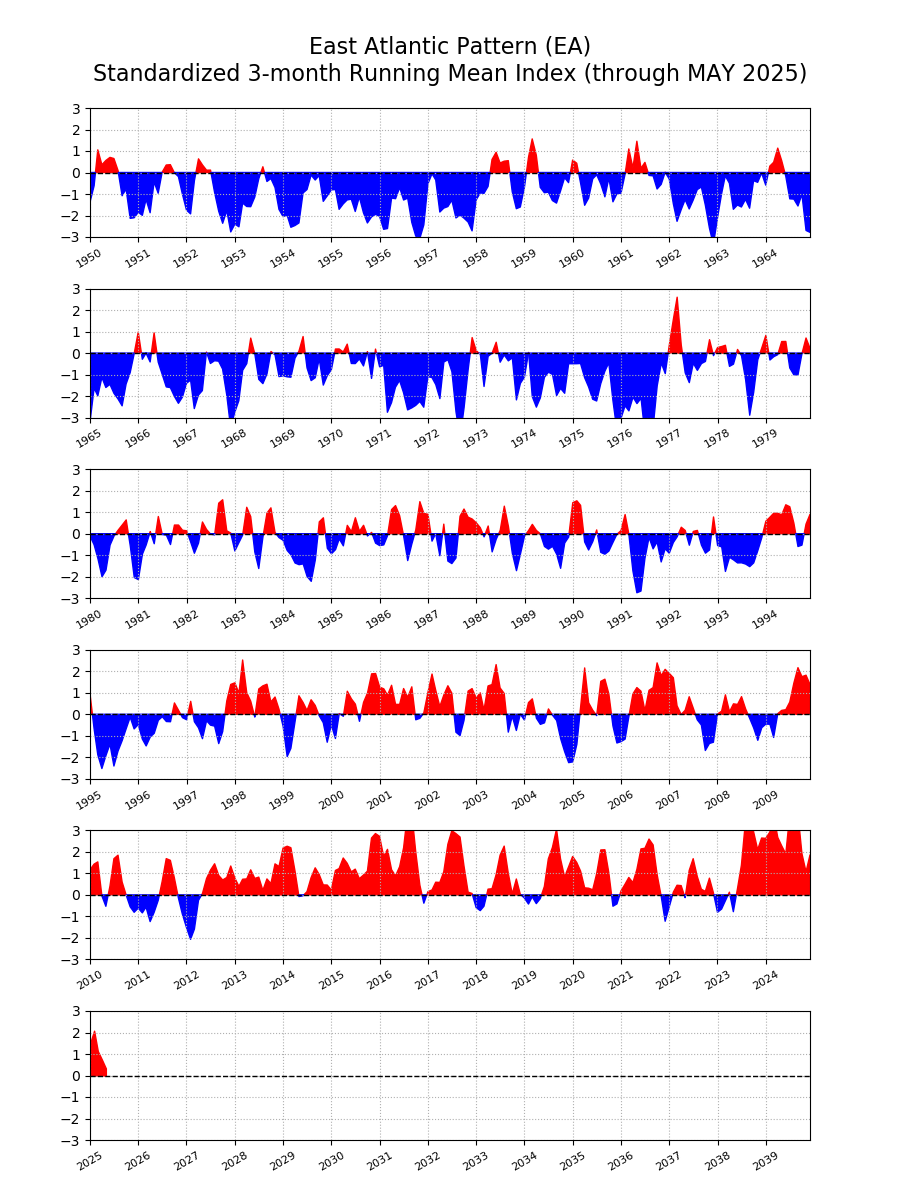
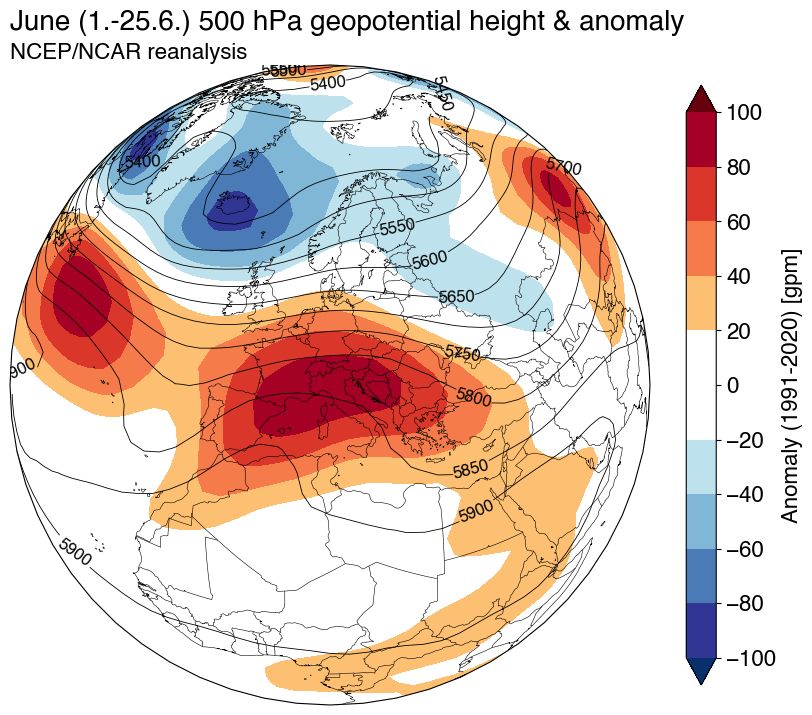
My guess is that this that the expanding subtropical ridges across the planet from Japan to the Eastern US and Europe as the climate warms are driving these multiple records. Notice how the EA has become so positive over time. So the +NAO could be driven by the expansion of these ridges. Plus the feedback from the record marine heatwaves east of Japan across the Atlantic to the Mediterranean.
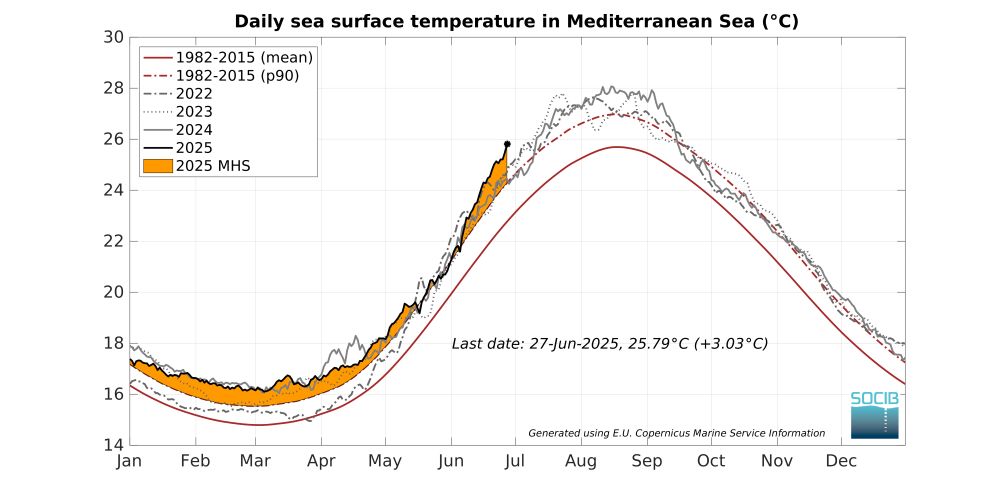
 The Mediterranean is now warmer than it typically was in August during the recent 1982–2015 climate period. And it’s no wonder when you look at the atmospheric circulation: a strong upper-level ridge has parked over the western Mediterranean, allowing the marine heatwave to develop.ALTALT111
Don't Meditteranean hurricanes occur when it gets this warm Chris?
-
1 hour ago, SACRUS said:
Records:
Highs:
EWR: 102 (2021)
NYC: 101 (1934)
LGA: 98 (2021)
JFK: 99 (1959)
Lows:
EWR: 56 (1968)
NYC: 52 (1919)
LGA: 59 (1995)
JFK: 55 (1995)
Historical:1826: Thomas Jefferson made his last entry in his weather observation log on this date, just six days before he died. The weather held a fascination for Jefferson as he made regular weather observations. He bought his first thermometer while working on the Declaration of Independence and his first barometer shortly after that.
1878: The weather observer on top of Colorado's Pike's Peak noticed that a major storm remained stationary over South Park, some 50 miles away. The observer also noted that the whitened ground from hail could be seen until sunset. (Ref. Wilson Wx. History)
1899: A great flood occurred on the Brazos River in Texas. The flood waters reached a width of 12 miles and caused $10 million dollars in damage. (Ref. Wilson Wx. History)
1907: A tropical storm moved from the Gulf of Mexico to coastal North Carolina, where it dissipated. The remnants moved north and combined with a cold front moving in from the Ohio valley, producing two days of widespread severe weather through the 29th. In some areas, rainfall amounts ranged from 3 to 6.73 inches, producing flooding that exceeded the flooding of tropical storm Agnes in 1972. Thunderstorms also produced high winds, hail and tornadoes, including F2 tornadoes at Edgemont, PA where debris from a destroyed garage was carried three-quarters of a mile away. Eight people were killed, six by drowning in swollen streams or rivers.(Ref. Wilson Wx. History)
1931 - The temperature at Monticello FL hit 109 degrees to establish an all-time record for the state. (The Weather Channel)
1943" Minimum temperatures were above 75° from 23rd to 28th in Washington, DC and greater than 70°F on June 20th-29th. (Ref. Washington Weather Records - KDCA)
1954 - Hurricane Alice dumped as much as 27 inches of rain on the Lower Rio Grande Valley of Texas. The Rio Grande River at Laredo reached a level 12.6 feet above its previous highest mark, and the roadway of the U.S. 90 bridge was thirty feet below the high water. (David Ludlum)
1962: Flooding in Wichita Falls, TX resulted in a quarter million dollar loss in city equipment, man hours, and other city property. The official rainfall total at Sheppard Air Force Base was only 1.64 inches, but other reported rainfall included 2.60 inches in downtown Wichita Falls, and from 4.20 to over 5 inches at Charlie, in northern Clay County. An estimated 300 cars were stranded temporarily on highway 287 near Jolly, when sections of the highway were flooded by over two feet of water. (Ref. Wilson Wx. History)
1975: Near Kingsland, Ark.--Lightning struck and killed a 6-year-old and injured her aunt while they were on a family outing on the banks of the Saline River. (Ref. Lightning-The Underrated Killer.pdf)1987 - Thunderstorms produced severe weather in the Ohio Valley and the Great Lakes Region, with reports of large hail and damaging winds most numerous in Ohio, Indiana and Michigan. Thunderstorms spawned four tornadoes in Michigan. A tornado near Clare MI was accompanied by softball size hail. In Colorado, an untimely winter-like storm blanketed Mount Evans with six inches of snow. (The National Weather Summary) (Storm Data)
1988 - Alpena, MI, reported a record low of 39 degrees while Jackson, MS, equalled their record for the month of June with an afternoon high of 105 degrees. Thunderstorms in the central U.S. soaked Springfield MO with 3.62 inches of rain, a record for the date. (The National Weather Summary)
1989 - Thunderstorms produced severe weather in the Southern and Central High Plains Region. Thunderstorms in Colorado produced softball size hail at Kit Carson, while pea to marble size hail caused ten million dollars damage to crops in Philips County, CO. (The National Weather Summary) (Storm Data)
1990: A microburst wind estimated around 150 mph did extensive damage in the town of Streamwood, in the Chicago metro area in Illinois. At least $10 million dollars damage was done to 25 stores and industrial buildings. Radar and eyewitness accounts indicated no rain or thunderstorms in the immediate vicinity of the area at the time. (Ref. Wilson Wx. History)
1993: Flash flooding rolled across southeast South Dakota and into northwest Iowa. A phenomenal 6 to 7 inches of rain fell in Dickinson and Emmett Counties during a 3 to 4 hour period. The Des Moines River rose several feet in just a few hours. Ocheyedan received 3 inches in just 45 minutes and Allendorf picked up 2.80 inches in 30 minutes. Many locations in northwest Iowa reported winds in excess of 60 mph, with some locations clocking speeds of 70 to 80 mph. Several tornadoes were also spawned during the evening in Emmett County in the Ringsted area, 3.50 inch hail fell and baseball size hail covered the ground just north of Estherville. Millions of dollars in damage was caused from the thunderstorms across the area.1993: No river traffic was moving on the 585 miles of the Mississippi River from St. Paul, MN to Cairo, IL and on 535 miles of the Missouri River from Sioux City, IA to the point it joined the Mighty Mississippi. More than 5, 000 loaded barges were stranded. For the first time in history, major floods came down both rivers at the same time. (Ref. Wilson Wx. History)
1994: Persistent extreme heat in the Southwest as Arizona 128°F at Lake Havasu City and Nevada 125°F at Laughlin set all-time record high temperatures on the same date. (Ref. Lowest and Highest Temperatures for the 50 States)
1998: "The Corn Belt Derecho of 1998" in the following states NE, IA, IL, IN, KY. A derecho which originated in far southeast South Dakota moved across Illinois during the afternoon and evening and continued as far east as Ohio the next morning. Every county in central Illinois sustained some damage, as these severe thunderstorms passed. Winds gusted in the 60 to 80 mph range, with some localized microbursts producing winds more than 100 mph. Significant damage occurred in the microburst areas, including the towns of Morton, McLean, LeRoy, and Tolono. In Tolono, 22 cars of a southbound 101-car Illinois Central freight train were blown off the tracks. It was unknown how many vehicles were picked up by the wind, but 16 cars were turned over, and another six derailed but remained upright. The train was en route to Centralia from Chicago with a load of mixed freight, including plastic pellets and meal. The freight cars empty weighed about 60,000 pounds, while a full one weighs about 260,000 pounds. Overall, 12 people were injured, and damage was estimated at around $16 million.
2003: Tropical Storm Bill made landfall south of Houma, LA with top winds of 60 mph, spreading a six foot storm surge across the low lying portions of the Louisiana Coast. For the second time in two years, the town of Montegut, LA was flooded after the town’s protection levee was breeched. Bill dumped 5 to 8 inches from Louisiana to Alabama. A tornado at Reserve, LA injured four people.
(Ref. Wilson Wx. History)
2005: Heavy rains of 3 to 7 inches fell across far eastern Brown, western and northern Day, and most of Marshall Counties in South Dakota during the early morning and again in the afternoon hours. One location measured 5 inches of rain in two hours. In Day County, 30 roads were washed out and 15 bridges were damaged. Some rainfall amounts include 5.04 inches in Britton, 3.34 inches north of Columbia, and 2.08 inches at Aberdeen. Total June rainfall for some locations in Marshall and Day Counties was between 11 and 12 inches. The flooding continued into early July before receding by July 10th. (Ref. Wilson Wx. History)
2012: The maximum temperature today was 103 °F at the Richmond International Airport a new record maximum temperature for the date. The old record was 101 °F in 1980. (Records since 1897) The maximum at the West Henrico Co. - Glen Allen station was 102 °F at 4:20 PM. It was the hottest day here since July 22, 2011 when it was also 102 °F. Friday's derecho, a widespread and long-lived violent thunderstorm complex, affected millions of people from Chicago, Ill., to Washington, DC. Strong winds, in many cases in excess of 70 mph, downed numerous trees and power lines from Illinois to Maryland. Over 2 million people were left without power. Winds with derecho -- 86 mph at Wintergreen Mt., 80 mph at Roanoke Airport 71 mph, Dulles 70 mph at Reagan, National 59 mph in Richmond International Airport and only 37 mph in West Henrico Co. - Glen Allen VA. (Ref. Derecho Hits Ohio Valley, VA, MD See Map
(Ref. Violent Storms Virginia, Maryland, D.C (Ref. Derecho Damage- 32 pages Worth of Damage Reports
2012: Fifth of the top ten weather events - Mid-Atlantic and Midwest Derecho. June 29. The widespread severe winds associated with the band of rapidly moving thunderstorms (a derecho) left a trail of destruction from Illinois to the mid-Atlantic, leaving some 4.25 million homes and businesses without power, killing 24 people, and costing hundreds of millions of dollars in property1993: Flash flooding rolled across southeast South Dakota and into northwest Iowa. A phenomenal 6 to 7 inches of rain fell in Dickinson and Emmett Counties during a 3 to 4 hour period. The Des Moines River rose several feet in just a few hours. Ocheyedan received 3 inches in just 45 minutes and Allendorf picked up 2.80 inches in 30 minutes. Many locations in northwest Iowa reported winds in excess of 60 mph, with some locations clocking speeds of 70 to 80 mph. Several tornadoes were also spawned during the evening in Emmett County in the Ringsted area, 3.50 inch hail fell and baseball size hail covered the ground just north of Estherville. Millions of dollars in damage was caused from the thunderstorms across the area.
1993: No river traffic was moving on the 585 miles of the Mississippi River from St. Paul, MN to Cairo, IL and on 535 miles of the Missouri River from Sioux City, IA to the point it joined the Mighty Mississippi. More than 5, 000 loaded barges were stranded. For the first time in history, major floods came down both rivers at the same time. (Ref. Wilson Wx. History)
1993 was historic on so many levels, our endless summers and the endless flooding near St Louis.....many records on both ends that have never been equaled or exceeded.
-
 1
1
-
-
8 hours ago, Roger Smith said:
Bonus coverage, here's a list of benchmark record high minimum values (for NYC) ... I reverse them at the point where the trend line reverses in early February ...
(going up)
51F __ Feb 5, 1991 (mildest in period Jan 28 to Feb 15)
56F __ Feb 16, 2023
58F __ Feb 24, 2018
63F __ Mar 10, 2016
66F __ Mar 31, 1998
68F __ Apr 9, 1991
70F __ Apr 14, 2023
74F __ Apr 17, 2002
76F __ Apr 18, 2002
77F __ June 1, 1895
78F __ June 4, 1943
79F __ June 10, 1984
80F __ June 23, 2025
81F __ June 24, 2025
82F __ July 2, 1901
83F __ July 6, 1999
84F __ July 7, 1908
(84F also July 15, 1995 and July 22, 2001)
84F __ Aug 14, 1908
(heading down now)
81F __ Aug 29, 2018
79F __ Sep 7, 1881
78F __ Sep 11, 1983
77F __ Sep 23, 1970
75F __ Oct 5, 1898
72F __ Oct 8, 2017
71F __ Oct 10, 2018
69F __ Oct 25, 1908
67F __ Nov 2, 1971
66F __ Nov 6, 2015, 2022
64F __ Nov 11, 2002, 2020
63F __ Dec 24, 2015
59F __ Jan 4, 1950
56F __ Jan 14, 1932
54F __ Jan 15, 1995
53F __ Jan 27, 1916
(and back to 51F Feb 5, 1991).
... very few of these are concurrent with high max benchmarks (Mar 2016, Apr 2002, Sep 1881).
... the midsummer situation is different, a plateau of four equal values, not one peak as in July 1936.
The hottest 24 hour period at Central Park has to be July 5-6, 1999 with a high of 101 and a low of 83 (and a high of 101 again the following day.) It's absolutely amazing that 1908 had lows of 84 in both July and August, that must have been one hot summer! July 1995 is right up there too with a high of 102 and a low of 84 and extremely high dew points. September 11, 1983 is notable for having a high of 99 and a low of 78, mid summer weather in mid September. April 2002 is notable for lows in the mid to upper 70s and highs in the mid to upper 90s.
-
9 hours ago, donsutherland1 said:
I also compiled the benchmark record high minimum temperatures since 2025 set one, as well during the recent heatwave.
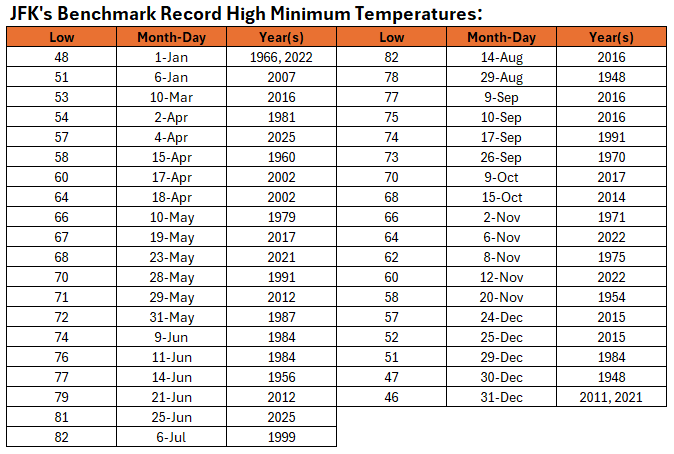
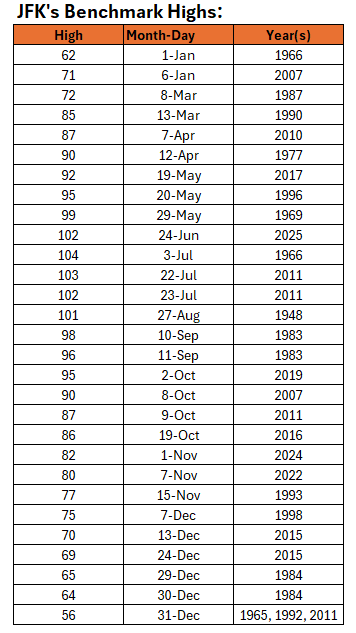
If you go by 24 hour periods of highest average temperature would you say that the July 5-6, 1999 period was the hottest 24 hour period on record at JFK, Don? The high was 102 on July 5th and the low the following morning was 82! June 24-25 comes in second place with a high of 102 and a low of 81 the following morning. It ranks higher in terms of duration because June 25 also had a high of 102 while July 6th fell below July 5th highs (only at JFK, at NYC it was the same as the previous day, at 101.) I'm surprised that July 2011 isn't on this list, as JFK had back to back highs of 103 and 102 in that stretch so the lows must have been elevated also. It's also interesting how highs made it into the 90s from a start in the low 60s in April 2002. And I knew May 1991 was extremely hot with 7 90 degree days but didn't know that we had our earliest 70 degree low in that month!
That period at the end of August 1948 was also notable with a high of 101 and a low of 78.
-
1 minute ago, donsutherland1 said:
wild, 98 on September 10, 1983 and then 96 on September 11, 1983 after two 100 degree readings in July and August, 1983 and 2010 were our only truly great summers (great from beginning to end.)
-
1
-
-
2 hours ago, Roger Smith said:
That 99 in 1983 tied 1931 (Sep 11) but yes it was the latest in season. The next benchmarks are 97F on Sep 23, 1895 and 94F Oct 5, 1941, 91F Oct 10, 1939, and 90F Oct 17, 1938. Benchmarks after that are Oct 22 1979 (88F), Oct 23, 1947 (85F), Nov 1 and 2 1950 (84F, 83F), Nov 15 1993 (80F), Nov 20, 1985 (77F) , Dec 7 1998 (75F) and possibly Dec 24 2015 (72F). (a benchmark as you probably know is a latest occurrence in season, or an earliest from midwinter to midsummer).
Benchmarks before the 1881 101F are (by definition) the all-time record 106F July 9, 1936, then 104F Aug 7, 1918, 103F Aug 26, 1948 and 102F Sep 2, 1953, 101F Sep 7, 1881.
2015 (Dec 24) at 72F is a partially invalid benchmark as it was also 72F on Jan 6, 2007 and Jan 26, 1950. These are probably the real benchmarks eliminating Dec 24, 2015 but another view would be only Jan 25, 1950 is a benchmark (falling) because the coldest day of winter is on average in early February. This is when the benchmarks reverse, so the set of spring into summer benchmarks are 73F (Feb 15, 1949), 78F Feb 21, 2018, 79F Mar 10, 2016, 85F Mar 13, 1990, 86F Mar 29, 1945, 92F Apr 7, 2010; 96F Apr 17, 2002; 99F May 19, 1962; 100F June 26, 1952, 101F June 27, 1966, and 103F July 3, 1966 before the ultimate 106F July 9, 1936. These are the only daily records that "really matter" in the sense that all others are not as impressive in terms of being earliest or latest occurrences. It's interesting how few of these are recent. If you only count the 72F in Jan 1950, then there are 29 benchmarks (one tied 1931,1983, and two cases of two consecutive in same year 1950 and 1966) and the median of the 26 years involved (1950 counts three times, 1966 twice) is 1952. The years counted are
1881 1895 1918 1931 1936 1938 1939 1941 1945 1947 1948 1950** 1952 1953 1962 1966* 1979 1983 1985 1990 1993 1998 2002 2010 (2007, 2015 not counted) 2016 2018 ...
The benchmarks cluster noticeably from 1936 to 1953 (12 of 29), and 1979 to 2002 (7 more). There is no significant bias towards recent decades, with 29 benchmarks over 156 years, one would expect 4 since 2000 which is the case. The number established by 1918 (3) is well below random expectation (9). The only year with two non-consecutive benchmarks from the same spell of weather is 1950 (one in January, two in early November). But if Dec 2015 counted, the two closest in time (non-associated) would be that one and March 10, 2016.
I'm not sure what name you could give an almost-benchmark, which would be a case like April 18, 1976, tying a benchmark and clearly a near-equal outlier (86F Mar 31 1998 would be another, as would 94F on Sep 23, 1914). I guess almost-benchmark is probably as good as we'll get. A benchmark can be erased as even a daily record, for example, April 7, 1929 (89F) was a benchmark until 2010 replaced it as both a daily record and benchmark. 1991 held a 90F benchmark set April 8, that one is still a daily record but was removed as a benchmark by 2010.
May is the only month with only one benchmark. That is a sign of the extreme significance of the 1976 and 2002 April 96 readings, no date in early to mid-May exceeded them (before 1962, the benchmarks were 92F (Apr 27, 1915), 93F (May 12, 1881), 95F (May 25, 1880), 96F (May 31 1895, 1939) and 99F (June 4, 1925).
Thanks for this, benchmarks always intrigue me and I remember a few of the ones you listed.
Do you have a list of benchmarks for JFK too? That 95 in early October is one that comes to mind for me. And of course the earliest ever 100 that occurred last week has also become a benchmark now. Another one is the earliest ever 99+ degree temperature on May 29, 1969 that really stands out to me as well as the earliest 90 degree reading from April 11, 1977.
It's interesting that the JFK period of record began in 1948 and they immediately recorded their latest 100 degree temperature in the same summer (and back to back 100+, while NYC had three in a row during that same span of time.)
-
Just now, Stormchaserchuck1 said:
I would think so.. maybe someone can has a Twitter thread or something. 42c is 107F.
Had that here on June 24, 106.0 and 102.6 the day after. Beat my July 22, 2011 mark at the same location which was 105.6
-
Just now, Stormchaserchuck1 said:
Looks like it maxes out over France.. I bet bluewaves 500mb anomaly record maps show historic ridging there.
I wonder if this is record max heat for Paris?
-
1 minute ago, Santa Claus said:
has his own mod-ordained thread, total and complete libertybell victory, haters in absolute ruins right now
This was all your doing, Santa Claus!! Christmas in June (in more ways than one too!!)
-
13 minutes ago, Stormchaserchuck1 said:
Strong +NAO driven heat wave for Europe. 595dm making it to Paris, France


anything near as historic as the 40C London experienced a few years ago?
-
40 minutes ago, coastalplainsnowman said:
I read somewhere that .001% of the Earth's rise in temperature over the last 9 years is directly attributable to server electricity demands, due to the frequency of LibertyBell's posts. Half that is due solely to the giant image and poem in his footer that have been in place only the past year or so.
Just kidding, I honestly enjoy the posts (the ducks I'm a little tired of tho.)
Changed it to a cooler blue theme, it's actually from April 2002 during the historic heatwave, you wouldn't think the skies would be this blue but they were, a function of it being April, despite the intense heat.
-
1
-
-
2 minutes ago, Roger Smith said:
It was very similar to 1953 in timing and duration but not quite as intense, highs were often 95 to 98 and failed to break records but it was very hot (I was actually in NYC for one day during it, on a road trip). The records it did set were ties for max and min on 30th (98/78, ties with 1953 for the max and 2018 for the min). So it has the highest daily mean for Aug 30th.
It's interesting how we do not have late season intense heat anymore (at least to my knowledge)-- we did have 95 in October here a few years ago (at JFK). But our latest 98 in recent memory was in September 2010 and our latest 99 was on September 11, 1983 wasn't it?
Our latest 100 goes all the way back to September 7, 1881 (actually 101.) It was NYC's first 100 ever recorded and also its latest.
-
24 minutes ago, coastalplainsnowman said:
I read somewhere that .001% of the Earth's rise in temperature over the last 9 years is directly attributable to server electricity demands, due to the frequency of LibertyBell's posts. Half that is due solely to the giant image and poem in his footer that have been in place only the past year or so.
Just kidding, I honestly enjoy the posts (the ducks I'm a little tired of tho.)
Wait, do you mean my sig, I guess I should change the picture lol.
Thanks, I appreciate you too.
-
12 minutes ago, IrishRob17 said:
It's not his posts, and thankfully he gets it when I call him on stuff and bust his chops. I just wish whatever browser he uses allowed use of the multi-quote option.
I consider you a friend, Rob so thank you :-) I'll try to use multiquote more often, it does work sometimes, but it limits me to two quotes per post from what I can tell.
I'm using the DuckDuckGo browser.
-
18 minutes ago, Sundog said:
Those were the days
No they weren't Only the last 10 days of June are part of summer. If you're familiar with 1980 there was historic heat for all of July and all of August and the first three weeks of September that covered the entire CONUS except for the extreme Pac NW and Maine. A thousand people died in Saint Louis alone from the intense heat (1995 Chicago was similar to 1980 St. Louis.) NYC's couplet of July and August is still the hottest 62 day period on record and August 1980 is the hottest August on record and the only one with a mean temperature of 80.0 or above.
But 1983 was an even hotter summer (going by the metrics I use.)
-
52 minutes ago, SACRUS said:
83 / 71 here
Partly cloudy
it's been completely sunny and hot here for an hour now, going to turn on my a/c soon.
-
57 minutes ago, Roger Smith said:
That is correct, in fact it has not even hit 99 F from July 24 to 28. (99F on July 29, 1949).
There's a similar lull in August from 16th to 25th with highest value 97F and even more pronounced, records of only 92F and 94F on Aug 23rd-24th. After August 25th the records generally pick up considerably although most are in a few years like 1948, 53, 73 and later 1881. Perhaps these are expectable random variations that will fill in after 250-300 years of records.
I know about the other historic summers but what late hot streak did we have in 1973? Thats my birth year lol
-
58 minutes ago, donsutherland1 said:
Here's the for 100° days:
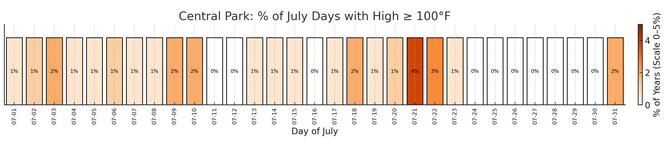
Here's the distribution of 90°+ days, 100°+ days, and daily record highs:
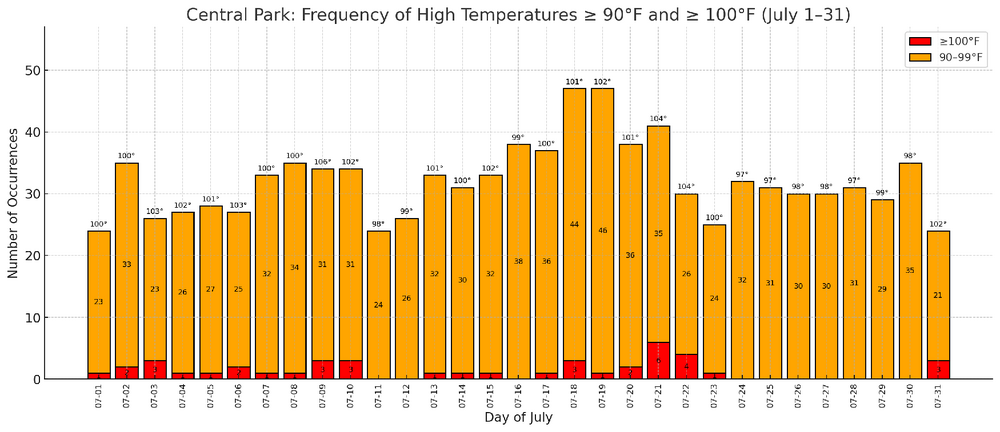
None on the 11th or 12th or in the entire 24-30 period which is very WEIRD. Too bad the 31st broke the streak otherwise it would have been a clean sweep for every day in July after the 23rd lol.
-
56 minutes ago, Roger Smith said:
(in response to Don's chart of the distribution of highs after low of 63) ...
Probably the 63 "low" associated with the 95 in 1925 was at end of day as that heat wave ended, so it wasn't a case of 63 warming to 95, but 95 cooling down to 63? Not sure about that but it looks that way.
Urelated factoid, I recently updated a data base for NYC and found that the highest average temperature for the entire period of record occurs on July 18 for both max and min. (86, 70).
Also isn't there a whole week at the end of July when NYC has never hit 100 (I think it's July 24-30).
-
42 minutes ago, SnoSki14 said:
Heat without activity is a bore. It's the cold/dry equivalent
It depends on how extreme it is. If it goes below zero then it's interesting (same as 100+). There does need to be activity around the bookends though (just like with winter.) January 1994 was much more fun than January 1985. Both went below zero, but January 1994 had much more activity.
-
31 minutes ago, forkyfork said:
june 1980 was below average with a few nights getting into the 40s
The heat was just getting started in the final week of the month and lasted into September
A nice dress rehearsal for 1983
-
31 minutes ago, forkyfork said:
pieces of heat with fronts, above normal overall
sucks no 1980 style continuous heat, but at least the peaks are higher this year (for us anyway).


June 2025 discussion-obs: Summerlike
in New York City Metro
Posted
77-78 is comfortable sleeping weather, but 81-84 is a problem, we had that twice in June