

LibertyBell
-
Posts
40,111 -
Joined
Content Type
Profiles
Blogs
Forums
American Weather
Media Demo
Store
Gallery
Posts posted by LibertyBell
-
-
7 minutes ago, donsutherland1 said:
It's a choice. It's actually no different from the choice made at Easter Island to cut down the trees leading to complete deforestation. Unfortunately, I expect that humanity will maintain its present course, so I don't see big reductions in the burning of fossil fuels anytime soon. Thus, we'll probably see 3°C of warming, and perhaps more given recent findings related to cloud feedbacks, by 2100.
Wait, Don, who cut down the trees at Easter Island? I thought only natives live there-- it's one of the most isolated places on the entire planet.
If we are on that trajectory, we might not have Venus level greenhouse warming, but we'll likely get at least partway there.
Is having the current generation of rich people die off going to be enough to end fossil fuels? I don't see anyone who is under 40 who would want to support or even run a fossil fuel company, so maybe we will be finally done with them when everyone who is currently over the age of 40 is dead?
-
2 minutes ago, SACRUS said:
And finally their strong heat
Year Rank Days >= 95 °F 1949 1 14 1944 2 12 2018 3 9 1983 3 9 1955 3 9 2021 6 8 1953 6 8 1911 6 8 2022 9 7 2002 9 7 1988 9 7 1984 9 7 1963 9 7 1933 9 7 2016 15 6 2013 15 6 1993 15 6 1977 15 6 ear Rank Days >= 100 °F 1911 1 4 1952 2 2 1949 2 2 1944 2 2 1919 2 2 2025 6 1 2022 6 1 2021 6 1 2011 6 1 2010 6 1 2002 6 1 1995 6 1 1977 6 1 1975 6 1 1955 6 1 1953 6 1 1948 6 1 1926 6 1 1925 6 1 ear Rank Days >= 100 °F 1911 1 4 a very hot summer, I wonder if NYC was similarly hot and had 100+ days in 1911 too? -
1 minute ago, SACRUS said:
And finally their strong heat
Year Rank Days >= 95 °F 1949 1 14 1944 2 12 2018 3 9 1983 3 9 1955 3 9 2021 6 8 1953 6 8 1911 6 8 2022 9 7 2002 9 7 1988 9 7 1984 9 7 1963 9 7 1933 9 7 2016 15 6 2013 15 6 1993 15 6 1977 15 6 ear Rank Days >= 100 °F 1911 1 4 1952 2 2 1949 2 2 1944 2 2 1919 2 2 2025 6 1 2022 6 1 2021 6 1 2011 6 1 2010 6 1 2002 6 1 1995 6 1 1977 6 1 1975 6 1 1955 6 1 1953 6 1 1948 6 1 1926 6 1 1925 6 1 Year Rank Days >= 95 °F 1949 1 14 1944 2 12 2018 3 9 1983 3 9 1955 3 9 2021 6 8 1953 6 8 1911 6 8 2022 9 7 2002 9 7
These years do match up with NYC well, what was going on in `1911 (the year before 1912 that we were discussing) that caused 4 100+ days in Boston in 1911? Didn't NYC also have a very hot summer with 100+ days in 1911 too?
-
-
3 minutes ago, donsutherland1 said:
IMO, it does a good job providing an overview of one of the major consequences of humanity's collective choice to continue to dump greenhouse gases into the atmosphere. I believe that Matt Luongo, one of the climate scientists on the interview, said it correctly when he stated that it is "a political and social decision on how much we want to not emit CO2." I believe a combination of motivated reasoning, cognitive psychological biases, limited leadership capacity, and structural realities of complex societies (built on a status quo foundation, poor capacity to make rapid changes due to the complex relationships involved, etc.) have shaped humanity's collective decision.
There is some debate over whether the AMOC will completely break down or merely slow. In one recent surprise, scientists found that the SMOC (southern meridional overturning circulation off Antarctica has actually reversed. That outcome could lead to the oceans releasing some of the CO2 that they have absorbed. Moreover, because the ocean and atmosphere is coupled, the changes related to ocean currents have synoptic implications. The rapid warming of the Western Pacific Ocean's negative PDO-type circulation that is enhancing drought in the Southwest is one example.
Our society is just too dependent on fossil fuels. Even with lessening of emissions as fuel, there is still the matter of plastic being created from toxic petrochemicals. The fossil fuel cartel does not want to be retired from existence, there's just too much money in it. We will probably eventually be completely done with it, but I don't foresee that happening for the next 50 years.
-
2 minutes ago, SACRUS said:
Quick 2 week hot period the rest of the summer was cooler even for Boston standards
July 1912 Boston Weather
Day High (°F) Low (°F) Precip. (inches) Snow (inches) 71 56 0.00 0.0 85 61 0.00 0.0 92 65 0.00 0.0 94 67 0.00 0.0 91 68 0.00 0.0 90 68 0.00 0.0 93 70 0.00 0.0 94 72 0.00 0.0 99 78 0.00 0.0 97 76 0.02 0.0 90 70 1.14 0.0 72 64 0.00 0.0 81 63 0.00 0.0 81 68 0.00 0.0 85 71 0.00 0.0 92 69 0.00 0.0 70 64 0.00 0.0 70 63 2.52 0.0 79 62 0.00 0.0 79 57 0.00 0.0 70 61 1.03 0.0 79 62 0.00 0.0 73 57 0.00 0.0 79 57 0.00 0.0 75 58 0.00 0.0 79 62 0.00 0.0 78 63 0.00 0.0 84 58 0.00 0.0 78 67 0.45 0.0 70 61 0.00 0.0 72 61 0.00 0.0 wild, nothing like what NYC had in 1953
-
Just now, TheClimateChanger said:
Looks like Central Park topped out at 97F. Much cooler than Boston with only 5 days in the 90s that month.

Weird, Boston had 10 90 degree days in July 1912, it must have been over the top heat.
-
 1
1
-
-
19 minutes ago, TheClimateChanger said:
Dust storms were mostly from autumn through spring. I don't think there were many dust storms during the summer. A review of the Nebraska Monthly Weather Review for July 1936 reports only once instance of dust which lasted for a couple of hours ahead of an advancing cold front on the 19th.

Looks like 1912 was an isolated stretch. 14 of the last 15 days of the month were below 80F in Boston that month, resulting in the 4th coldest stretch on record for that timeframe.


7-9-1912 when Boston hit 99, NYC might have hit 100 on that day.
7-9 is a popular day for extreme heat, I think that was the last day of a 3 day 100+ stretch at NYC in 1993, when we hit 102 degrees.
-
18 minutes ago, TheClimateChanger said:
Dust storms were mostly from autumn through spring. I don't think there were many dust storms during the summer. A review of the Nebraska Monthly Weather Review for July 1936 reports only once instance of dust which lasted for a couple of hours ahead of an advancing cold front on the 19th.
Looks like 1912 was an isolated stretch. 14 of the last 15 days of the month were below 80F in Boston that month, resulting in the 4th coldest stretch on record for that timeframe.
I wonder if NYC had a similar hot stretch to Boston in 1912.
-
12 minutes ago, bluewave said:
The ridge to the east of New England during the summers has been giving us more onshore flow. But it’s located further to the west during the winter. So we get more SW to W flow then with all the Great Lakes cutters.


whats causing all the stalled fronts and cloudy weather in July which we did not have in the 90s especially?
-
4 minutes ago, bluewave said:
This paper below explains why the circulation pattern shift is related to the warming and it focuses more on the Pacific side. But we have been seeing similar shifts in the Atlantic leading to more ridging east of New England. It results the repeating weather patterns we have been experiencing over the last decade. Don just posted this in the La Niña thread in the main forum. I added this link below.
https://scienmag.com/north-pacific-climate-shifts-drive-southwest-us-drought/
This would then also mean much more snow changing to rain or outright rain storms in the winter because of onshore flow.
-
19 hours ago, SACRUS said:
JFK only hit 100 three times in August on record and never in september back to 1948.
19 hours ago, SACRUS said:JFK August 100's
8/20/1983: 100
8/26/1948: 100
8/26/1948: 10199's in 2001, 2006.
19 hours ago, SACRUS said:JFK highest in Sep
9/10/1983 : 98
I tried the multiquote thing after a browser update and it works a little better but still scrolls me down to the end of the page and I have to go back up to find the posts I wanted to quote lol.
Excellent work Tony, it's interesting how JFK's hottest August temperatures happened at the start of their POR and the only time they had two 100+ in a row in August, in 1983 they also had 2 100+ temperatures, but one was in July and the other one in August. In September 1983 came the closest, which was our hottest September on record (like how 1991 one was for May.)
-
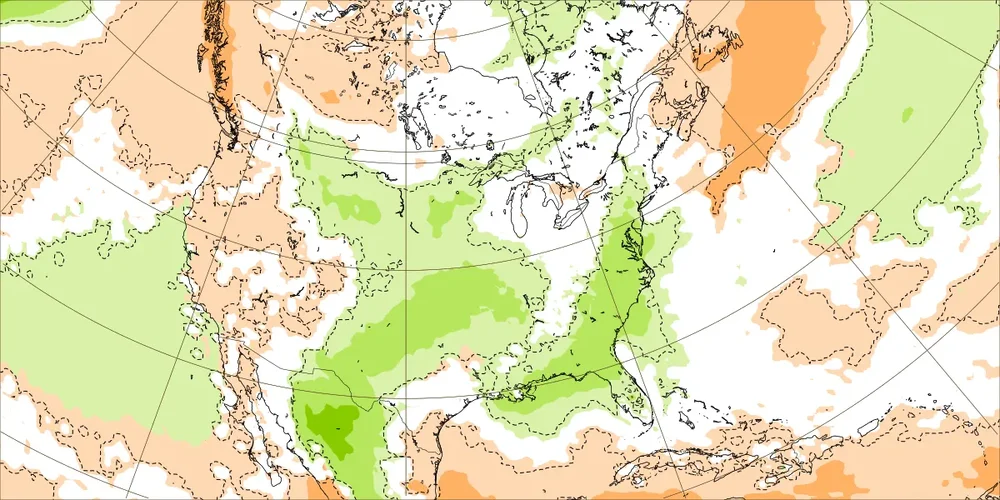
Just now, donsutherland1 said:
That’s increases in SLP. That’s where things are trending concerning ridges/heat domes.
Eastern Canada and especially northeastern Europe and western Asia are very strong hot zones wow.
-
17 hours ago, SnowGoose69 said:
Sucks that it sounds like the NAM is getting scrapped next year in favor of the new RRFS. I am not too thrilled on this as the 3km NAM just blows away anything, even the Euro on WAA winter events. No word yet on if they'll go the NGM route and let the NAM keep running for 3-5 years, just with no new updates or if it'll just be totally scrapped ala the LFM when the ETA came about. Overall, the ETA changed forecasting a ton. Up until 1994 when it came about, winter forecasting inside 24-36 hours largely sucked, especially when it came to Miller Bs or clipper/sharp trof cyclogenesis generating systems. The Euro was not used much yet because it ran once per day and came out 12 hours later. After the March 93 storm many began using the Euro/UKMET more as they both did so well at long range with it.
why are they scraping the NAM?
-
24 minutes ago, donsutherland1 said:
Climate change is forcing changes to predominant patterns. Here's the summer trend:
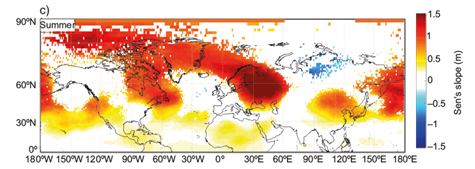
The underlying paper can be found here: https://www.scielo.org.mx/scielo.php?pid=S0187-62362024000100036&script=sci_arttext&tlng=en
Don does the deep red area show where the temperature anomalies are the greatest in the positive direction?
-
17 hours ago, Wannabehippie said:
ConEd made 1.8 billion after taxes, dividends, etc last year. That money is supposed to go in to R&D, system upgrades etc. Instead they just bank it for stockbuy backs, dividends in the future.
It's the same excuse Big Pharma uses for higher drug prices, none of that goes into R&D it mostly goes into marketing and corporate / shareholder pay.
-
12 minutes ago, bluewave said:
Don’t know if we can repeat 2010 east of NYC since the summer circulation patterns have shifted so much since then. Prior to 15-16 we would often get ridges over the Great Lakes and westerly flow summers. Since then we get a ridge over New England and the Rockies. This leaves a trough closer to the Great Lakes and more onshore flow here. So getting 30 days reaching 90° at JFK will be a challenge with onshore flow.
Is this shift in summer circulation patterns cyclical? I can't see why it would be connected to climate change in any way. Rainfall yes, but not circulation patterns.
-
3 minutes ago, bluewave said:
2010 will always be a tough act to follow east of NYC with how much more onshore flow we have been getting last decade. This summer we had that one interval back in late June when westerly flow made it down to the coast. But the onshore flow quickly returned. Parts of NJ surpassed 2010 for 90° days back in 2022 away from the sea breeze.
Time Series Summary for JFK INTERNATIONAL AIRPORT, NY - Jan through Dec Top 10 Years For 90° days
Click column heading to sort ascending, click again to sort descending.1 2010 32 0 2 1983 26 0 3 2002 21 0 4 1971 18 0 - 1949 18 0 5 2005 17 0 - 1991 17 0 6 2022 16 0 - 2012 16 0 - 1959 16 3 - 1955 16 2 7 2016 15 0 - 1995 15 0 - 1961 15 0 8 1999 14 0 - 1988 14 0 - 1966 14 0 - 1952 14 0 9 2011 13 0 - 1993 13 0 - 1984 13 0 - 1977 13 0 - 1970 13 0 - 1969 13 0 - 1963 13 0 10 2020 12 0 - 2015 12 0 - 2006 12 0 - 2003 12 0 - 1978 12 0 - 1968 12 0 - 1953 12 0
Time Series Summary for NEWARK LIBERTY INTL AP, NJ - Jan through Dec Top 10 Years For 90° Days
Click column heading to sort ascending, click again to sort descending.1 2010 54 0 2 2022 49 0 - 1993 49 0 4 1988 43 0 5 2021 41 0 - 2002 41 0 - 1991 41 0 6 2016 40 0 - 1983 40 0 - 1959 40 0 7 1994 39 0 - 1944 39 0 8 2005 37 0 - 1987 37 0 9 2018 36 0 - 1949 36 0 10 2015 35 0
Time Series Summary for HIGHTSTOWN 2 W, NJ - Jan through Dec Top 10 Years For 90° Days
Click column heading to sort ascending, click again to sort descending.1 2022 49 2 2 2010 48 4 3 2016 46 2 4 2020 42 0 5 2024 41 2 - 2021 41 0 - 1988 41 0 6 1983 40 0 7 2002 37 0 8 2018 36 1 - 2015 36 3 - 1957 36 0 - 1930 36 1 - 1895 36 11 9 2019 35 0 - 1999 35 0 - 1894 35 12 10 1944 34 1 It's interesting how only the top 3 summers had over 20 90 degree days at JFK.
EWR and JFK are actually a good match for summer weather, as the top summers in both are similar, I see 2010, 1983 and 2002 all in the top 10 list at EWR
1 2010 32 0 2 1983 26 0 3 2002 21 0 -
Just now, bluewave said:
2010 will always be a tough act to follow east of NYC with how much more onshore flow we have been getting last decade. This summer we had that one interval back in late June when westerly flow made it down to the coast. But the onshore flow quickly returned. Parts of NJ surpassed 2010 for 90° days back in 2022 away from the sea breeze.
Time Series Summary for JFK INTERNATIONAL AIRPORT, NY - Jan through Dec Top 10 Years For 90° days
Click column heading to sort ascending, click again to sort descending.1 2010 32 0 2 1983 26 0 3 2002 21 0 4 1971 18 0 - 1949 18 0 5 2005 17 0 - 1991 17 0 6 2022 16 0 - 2012 16 0 - 1959 16 3 - 1955 16 2 7 2016 15 0 - 1995 15 0 - 1961 15 0 8 1999 14 0 - 1988 14 0 - 1966 14 0 - 1952 14 0 9 2011 13 0 - 1993 13 0 - 1984 13 0 - 1977 13 0 - 1970 13 0 - 1969 13 0 - 1963 13 0 10 2020 12 0 - 2015 12 0 - 2006 12 0 - 2003 12 0 - 1978 12 0 - 1968 12 0 - 1953 12 0
Time Series Summary for NEWARK LIBERTY INTL AP, NJ - Jan through Dec Top 10 Years For 90° Days
Click column heading to sort ascending, click again to sort descending.1 2010 54 0 2 2022 49 0 - 1993 49 0 4 1988 43 0 5 2021 41 0 - 2002 41 0 - 1991 41 0 6 2016 40 0 - 1983 40 0 - 1959 40 0 7 1994 39 0 - 1944 39 0 8 2005 37 0 - 1987 37 0 9 2018 36 0 - 1949 36 0 10 2015 35 0
Time Series Summary for HIGHTSTOWN 2 W, NJ - Jan through Dec Top 10 Years For 90° Days
Click column heading to sort ascending, click again to sort descending.1 2022 49 2 2 2010 48 4 3 2016 46 2 4 2020 42 0 5 2024 41 2 - 2021 41 0 - 1988 41 0 6 1983 40 0 7 2002 37 0 8 2018 36 1 - 2015 36 3 - 1957 36 0 - 1930 36 1 - 1895 36 11 9 2019 35 0 - 1999 35 0 - 1894 35 12 10 1944 34 1 If we ever get a repeat of 2010 do you think we could break all time records? Wasn't 2010 following an 11 year cycle, so maybe every 11 years we would get a summer like that? If so the next one will be in 2032.
-
2 hours ago, SACRUS said:
Records:
HIghs:
EWR: 100 (1988)
NYC: 98 (1988)
LGA: 98 (1988)
JFK: 98 (1966)
New Brnswck: 100 (1911)
Lows:
EWR: 58 (1934)
NYC: 57 (1898)
LGA: 62 (1945)
JFK: 61 (2002)
New Brnswck: 48 (1898)
Histprical:1888 - Heavy snow reached almost to the base of Mt. Washington, NH, and the peaks of the Green Mountains were whitened. (David Ludlum)
1909: A deadly, estimated F2 tornado moved ESE across the Simpson Park section of Big Stone City in South Dakota. A bus was thrown from the road and the driver was killed. Two homes and several barns were destroyed. As the tornado crossed the foot of Big Stone Lake, it tore apart a railroad yard and killed four of the 26 Armenian laborers who were living in box cars at Ortonville, MN. 19 people were injured. A tornado in the eastern St. Louis metropolitan area in Missouri began as a waterspout on the Mississippi River, drove a steamer into a bridge. On land, the tornado destroyed several barns and damaged 15 homes and two factories in the west part of Alton. (Ref. Wilson Wx. History)
1912: Boston, MA recorded the end of the longest heat wave ever. It was 9 consecutive days with 90 °F or more.
(Ref. NOAA Boston Weather Events)1936: From July 5-17, temperatures exceeding 111 degrees in Manitoba and Ontario claimed 1,180 lives (mostly the elderly and infants) during the most prolonged, deadliest heat wave on record. Four hundred of these deaths were caused by people who drowned seeking refuge from the heat. In fact, the heat was so intense that steel rail lines and bridge girders twisted, sidewalks buckled, crops wilted and fruit baked on trees. Some record temperatures include; 112 degrees at St. Albans and Emerson, Manitoba, 111 at Brandon, Manitoba, 108 at Atikokan, Ontario, and Winnipeg, Manitoba.
1936: Unbelievable heat occurred across the Mid Atlantic states and the deadliest heat wave ever in parts of Canada. Ontario, Canada recorded its hottest temperature ever as the town of Atikokan hit 108°. On the same day in Manitoba, Winnipeg also reached 108°, the highest recorded temperature there since records began in the 1870's. St. Albans set Manitoba’s all-time record as they soared to 112°. In the United States, the all-time record high was set at Rochester, MN with 108°. Other daily record highs were set at Lincoln, NE: 109°; Peoria, IL: 108°; Rockford, IL: 108°, Grand Forks, ND: 108°, Decatur, IL: 107°, Moline, IL: 107°, Dubuque, IA: 107°, Minneapolis, MN: 106°, St. Cloud, MN: 106°, Fargo, ND: 106°, Springfield, IL: 105°, Champaign, IL: 105°, (Ref. Additional Temperatures Listed On This Link)
1939: All-time record highs of 110 °F and 106 °F were set for the city of Scottsbluff, NE and Kimball, NE, respectively, while Cheyenne, WY tied their all-time record high of 100°. Sioux City, IA also tied their all-time record high with 111°. Chadron, NE recorded its 3rd warmest day on record with a record high of 110°. (Ref. Wilson Wx. History)
1970: Seminole County in Oklahoma was hit hard by severe weather during the evening hours. Thunderstorm winds, estimated between 90 and 100 mph, damaged several buildings and blew out several plate-glass windows. Up to 5 inches of rain was also reported producing isolated flash flooding. (Ref. Wilson Wx. History)
1980: Hot weather prevailed from the southeast to the Plains. Daily records included: Wichita, KS: 111°, Columbia, MO: 108°, Dodge City, KS: 108°, Topeka, KS: 107°, DFW Airport, TX: 107°, Macon, GA: 104°, Savannah, GA: 103°, Memphis, TN: 103°, Houston, TX: 103°, Columbus, GA: 102°, Paducah, KY: 102°, Atlanta, GA: 101°, Chattanooga, TN: 100 °F. (Ref. Additional Temperatures Listed On This Link)
1981: Severe thunderstorms moved eastward across the entire length of South Dakota along the northern portion of the state. The storms produced large storms and an incredible amount of wind damage. Hail chicken egg size and up to 9 inches in circumference resulted in 100% crop loss in some areas. Many farmers reported that their crops were devastated by the storms winds and hail. Many trees were stripped of their leaves and large limbs were frequently lost. Winds exceeded 70 mph in many areas. Damage was so extensive that damage estimates were not even attempted. (Ref. Wilson Wx. History)1987 - Early morning thunderstorms produced wind gusts to 90 mph at Parkston, SD, and wind gusts to 87 mph at Buffalo, MN. Later in the day strong thunderstorm winds at Howard WI collapsed a circus tent injuring 44 persons. (The National Weather Summary) (Storm Data)
1988 - Thunderstorms produced heavy rain in southern Texas, with totals ranging up to 13 inches near Medina. Two men drowned when their pick-up truck was swept into the Guadalupe River, west of the town of Hunt. Ten cities in the eastern U.S. reported record high temperatures for the date. Baltimore, MD, reported a record high reading of 102 degrees for the second day in a row. (Storm Data) (The National Weather Summary)
1989 - Afternoon and evening thunderstorms produced severe weather from North Dakota to Indiana. Thunderstorms in North Dakota produced tennis ball size hail at Carson. Thunderstorms in Indiana produced wind gusts to 75 mph at Fort Wayne. Five cities in the Southern Atlantic Coast Region reported record high temperatures for the date, including Lakeland, FL, with a reading of 100 degrees. (The National Weather Summary) (Storm Data)
1990: The costliest hailstorm in U.S. history occurred along the Front Range of the Colorado Rockies. (Denver, Colorado): Softball-sized hail destroyed roofs and cars, causing more than $600 million in total damage.
1992: An isolated thunderstorm developed over northeast Nebraska and moved into west-central Iowa. Windows were blown out at a store in downtown Onawa and high winds downed trees about 6 miles northwest of Onawa. Golf ball size hail also produced crop damage in Monona County and 3.50 inches of rain fell in a short period of time. (Ref. Wilson Wx. History)
1993: The Great Midwest Flood continued as flood waters came close the Des Moines, IA water treatment plant, leaving the city's 250,000 residents without water for 12 days. (Ref. Wilson Wx. History)
1995: Winds gusted to 86 mph at Barstow, FL damaging several small airplanes and buildings.(Ref. Wilson Wx. History)
Shortly before 2 a.m. a house in Danielsville, PA, was hit twice by lightning. The chimney and roof were damaged and debris from the house damaged 3 cars. (Weather Guide Calendar with Phenomenal Weather Events 2011 Accord Pub. 2010, USA)so much wild stuff in this list
1993: The Great Midwest Flood continued as flood waters came close the Des Moines, IA water treatment plant, leaving the city's 250,000 residents without water for 12 days. (Ref. Wilson Wx. History)
was this great flood and our record heat both caused by the same thing in 1993?
1980: Hot weather prevailed from the southeast to the Plains. Daily records included: Wichita, KS: 111°, Columbia, MO: 108°, Dodge City, KS: 108°, Topeka, KS: 107°, DFW Airport, TX: 107°, Macon, GA: 104°, Savannah, GA: 103°, Memphis, TN: 103°, Houston, TX: 103°, Columbus, GA: 102°, Paducah, KY: 102°, Atlanta, GA: 101°, Chattanooga, TN: 100 °F. (Ref. Additional Temperatures Listed On This Link)
persistent heat in 1980 continued
1912: Boston, MA recorded the end of the longest heat wave ever. It was 9 consecutive days with 90 °F or more.
(Ref. NOAA Boston Weather Events)1936: From July 5-17, temperatures exceeding 111 degrees in Manitoba and Ontario claimed 1,180 lives (mostly the elderly and infants) during the most prolonged, deadliest heat wave on record. Four hundred of these deaths were caused by people who drowned seeking refuge from the heat. In fact, the heat was so intense that steel rail lines and bridge girders twisted, sidewalks buckled, crops wilted and fruit baked on trees. Some record temperatures include; 112 degrees at St. Albans and Emerson, Manitoba, 111 at Brandon, Manitoba, 108 at Atikokan, Ontario, and Winnipeg, Manitoba.
1936: Unbelievable heat occurred across the Mid Atlantic states and the deadliest heat wave ever in parts of Canada. Ontario, Canada recorded its hottest temperature ever as the town of Atikokan hit 108°. On the same day in Manitoba, Winnipeg also reached 108°, the highest recorded temperature there since records began in the 1870's. St. Albans set Manitoba’s all-time record as they soared to 112°. In the United States, the all-time record high was set at Rochester, MN with 108°. Other daily record highs were set at Lincoln, NE: 109°; Peoria, IL: 108°; Rockford, IL: 108°, Grand Forks, ND: 108°, Decatur, IL: 107°, Moline, IL: 107°, Dubuque, IA: 107°, Minneapolis, MN: 106°, St. Cloud, MN: 106°, Fargo, ND: 106°, Springfield, IL: 105°, Champaign, IL: 105°, (Ref. Additional Temperatures Listed On This Link)wtf was going on in 1912 and 1936? Wasn't 1912 the year Fenway Park opened and the year the Titanic sank? and look at that heat in 1936, you'd think with all that dust in the air from the Dust Bowl, the heat would actually be less.
-
2 hours ago, bluewave said:
Coastal areas are running a small rainfall deficit this year leading to the D0 conditions with the record June and July heat.
ISP
PRECIPITATION (IN)
  YESTERDAY        0.27          1.19 2010   0.10   0.17     0.00
  MONTH TO DATE    1.72                      0.94   0.78     0.12
  SINCE JUN 1      3.60                      4.94  -1.34     2.56
  SINCE JAN 1     19.33                     23.74  -4.41    29.94
But we have not had record July heat, just a lot of cloud cover and stalled fronts.
-
2 hours ago, FPizz said:
2 days ago was the shortest day ever recorded by about 1.6 milliseconds, so even less time for the sun to heat us

damn that's really bad for your solar panels!!
-
 1
1
-
-
5 hours ago, bluewave said:
It’s been tough to get 100° heat anywhere around the region in September. Could be related to the monsoonal type summers which have been increasing. Even August 100° heat isn’t as common anymore.
June 100 days
Time Series Summary for NEWARK LIBERTY INTL AP, NJ - Month of Jun
Click column heading to sort ascending, click again to sort descending.1 2025 3 0 2 2021 2 0 - 1994 2 0 - 1943 2 0 5 2024 1 0 - 2011 1 0 - 1993 1 0 - 1988 1 0 - 1966 1 0 - 1959 1 0 - 1953 1 0 - 1952 1 0 - 1934 1 0
Time Series Summary for LAGUARDIA AIRPORT, NY - Month of Jun
Click column heading to sort ascending, click again to sort descending.1 2025 1 0 - 2021 1 0 - 2017 1 0 - 2008 1 0 - 1952 1 0
Time Series Summary for JFK INTERNATIONAL AIRPORT, NY - Month of Jun
Click column heading to sort ascending, click again to sort descending.1 2025 2 0 July 100° days
Time Series Summary for NEWARK LIBERTY INTL AP, NJ - Month of Jul
Click column heading to sort ascending, click again to sort descending.1 2022 5 0 - 1949 5 0 3 2010 4 0 - 1993 4 0 - 1988 4 0 - 1966 4 0 7 2012 3 0 - 2011 3 0 - 1999 3 0 - 1955 3 0 11 2013 2 0 - 1997 2 0 - 1991 2 0 - 1980 2 0 - 1977 2 0 - 1954 2 0 - 1936 2 0 18 2025 1 21 - 2005 1 0 - 2002 1 0 - 1995 1 0 - 1986 1 0 - 1982 1 0 - 1963 1 0 - 1957 1 0 - 1937 1
Time Series Summary for LAGUARDIA AIRPORT, NY - Month of Jul
Click column heading to sort ascending, click again to sort descending.1 2013 2 0 - 2010 2 0 - 1999 2 0 - 1991 2 0 - 1966 2 0 - 1955 2 0 7 2019 1 0 - 2012 1 0 - 2011 1 0 - 2006 1 0 - 2005 1 0 - 1995 1 0 - 1957 1 0 Time Series Summary for JFK INTERNATIONAL AIRPORT, NY - Month of Jul
Click column heading to sort ascending, click again to sort descending.1 2010 3 0 - 1966 3 0 3 2011 2 0 - 1993 2 0 5 2013 1 0 - 1999 1 0 - 1983 1 0 - 1972 1 0 - 1963 1 0 - 1957 1 0
August 100° days
Time Series Summary for NEWARK LIBERTY INTL AP, NJ - Month of Aug
Click column heading to sort ascending, click again to sort descending.1 1953 4 0 - 1944 4 0 3 2006 3 0 - 2001 3 0 - 1993 3 0 - 1949 3 0 7 2005 2 0 - 1948 2 0 9 2024 1 0 - 2022 1 0 - 2002 1 0 - 1973 1 0 - 1955 1 0 Time Series Summary for LAGUARDIA AIRPORT, NY - Month of Aug
Click column heading to sort ascending, click again to sort descending.1 2006 3 0 2 1955 2 0 - 1953 2 0 4 2005 1 0 - 2001 1 0 - 1948 1 0 Time Series Summary for JFK INTERNATIONAL AIRPORT, NY - Month of Aug
Click column heading to sort ascending, click again to sort descending.1 1948 2 0 2 1983 1 0
September 100° daysTime Series Summary for NEWARK LIBERTY INTL AP, NJ - Month of Sep
Click column heading to sort ascending, click again to sort descending.1 1993 1 0 - 1953 1 0
Time Series Summary for LAGUARDIA AIRPORT, NY - Month of Sep
Click column heading to sort ascending, click again to sort descending.1 1953 1 0 Thanks for this extensive list Chris-- how is it possible that LGA did not record 100 degrees even one time in July 1993? EWR had 4 in a row, NYC had 3 in a row and JFK had 2 in a row in that month?
I also agree about the monsoonal type pattern, it seems like our summers are becoming cloudier and we are getting many more in the way of stalled fronts in our area in July? This never used to happen before, has the Bermuda Ridge become too weak to hold fronts well back to our west as it used to do in summers like 1993, 1999 and 2010?
Is there a way to specifically track amount of cloudiness for the month of July through the years and decades?
-
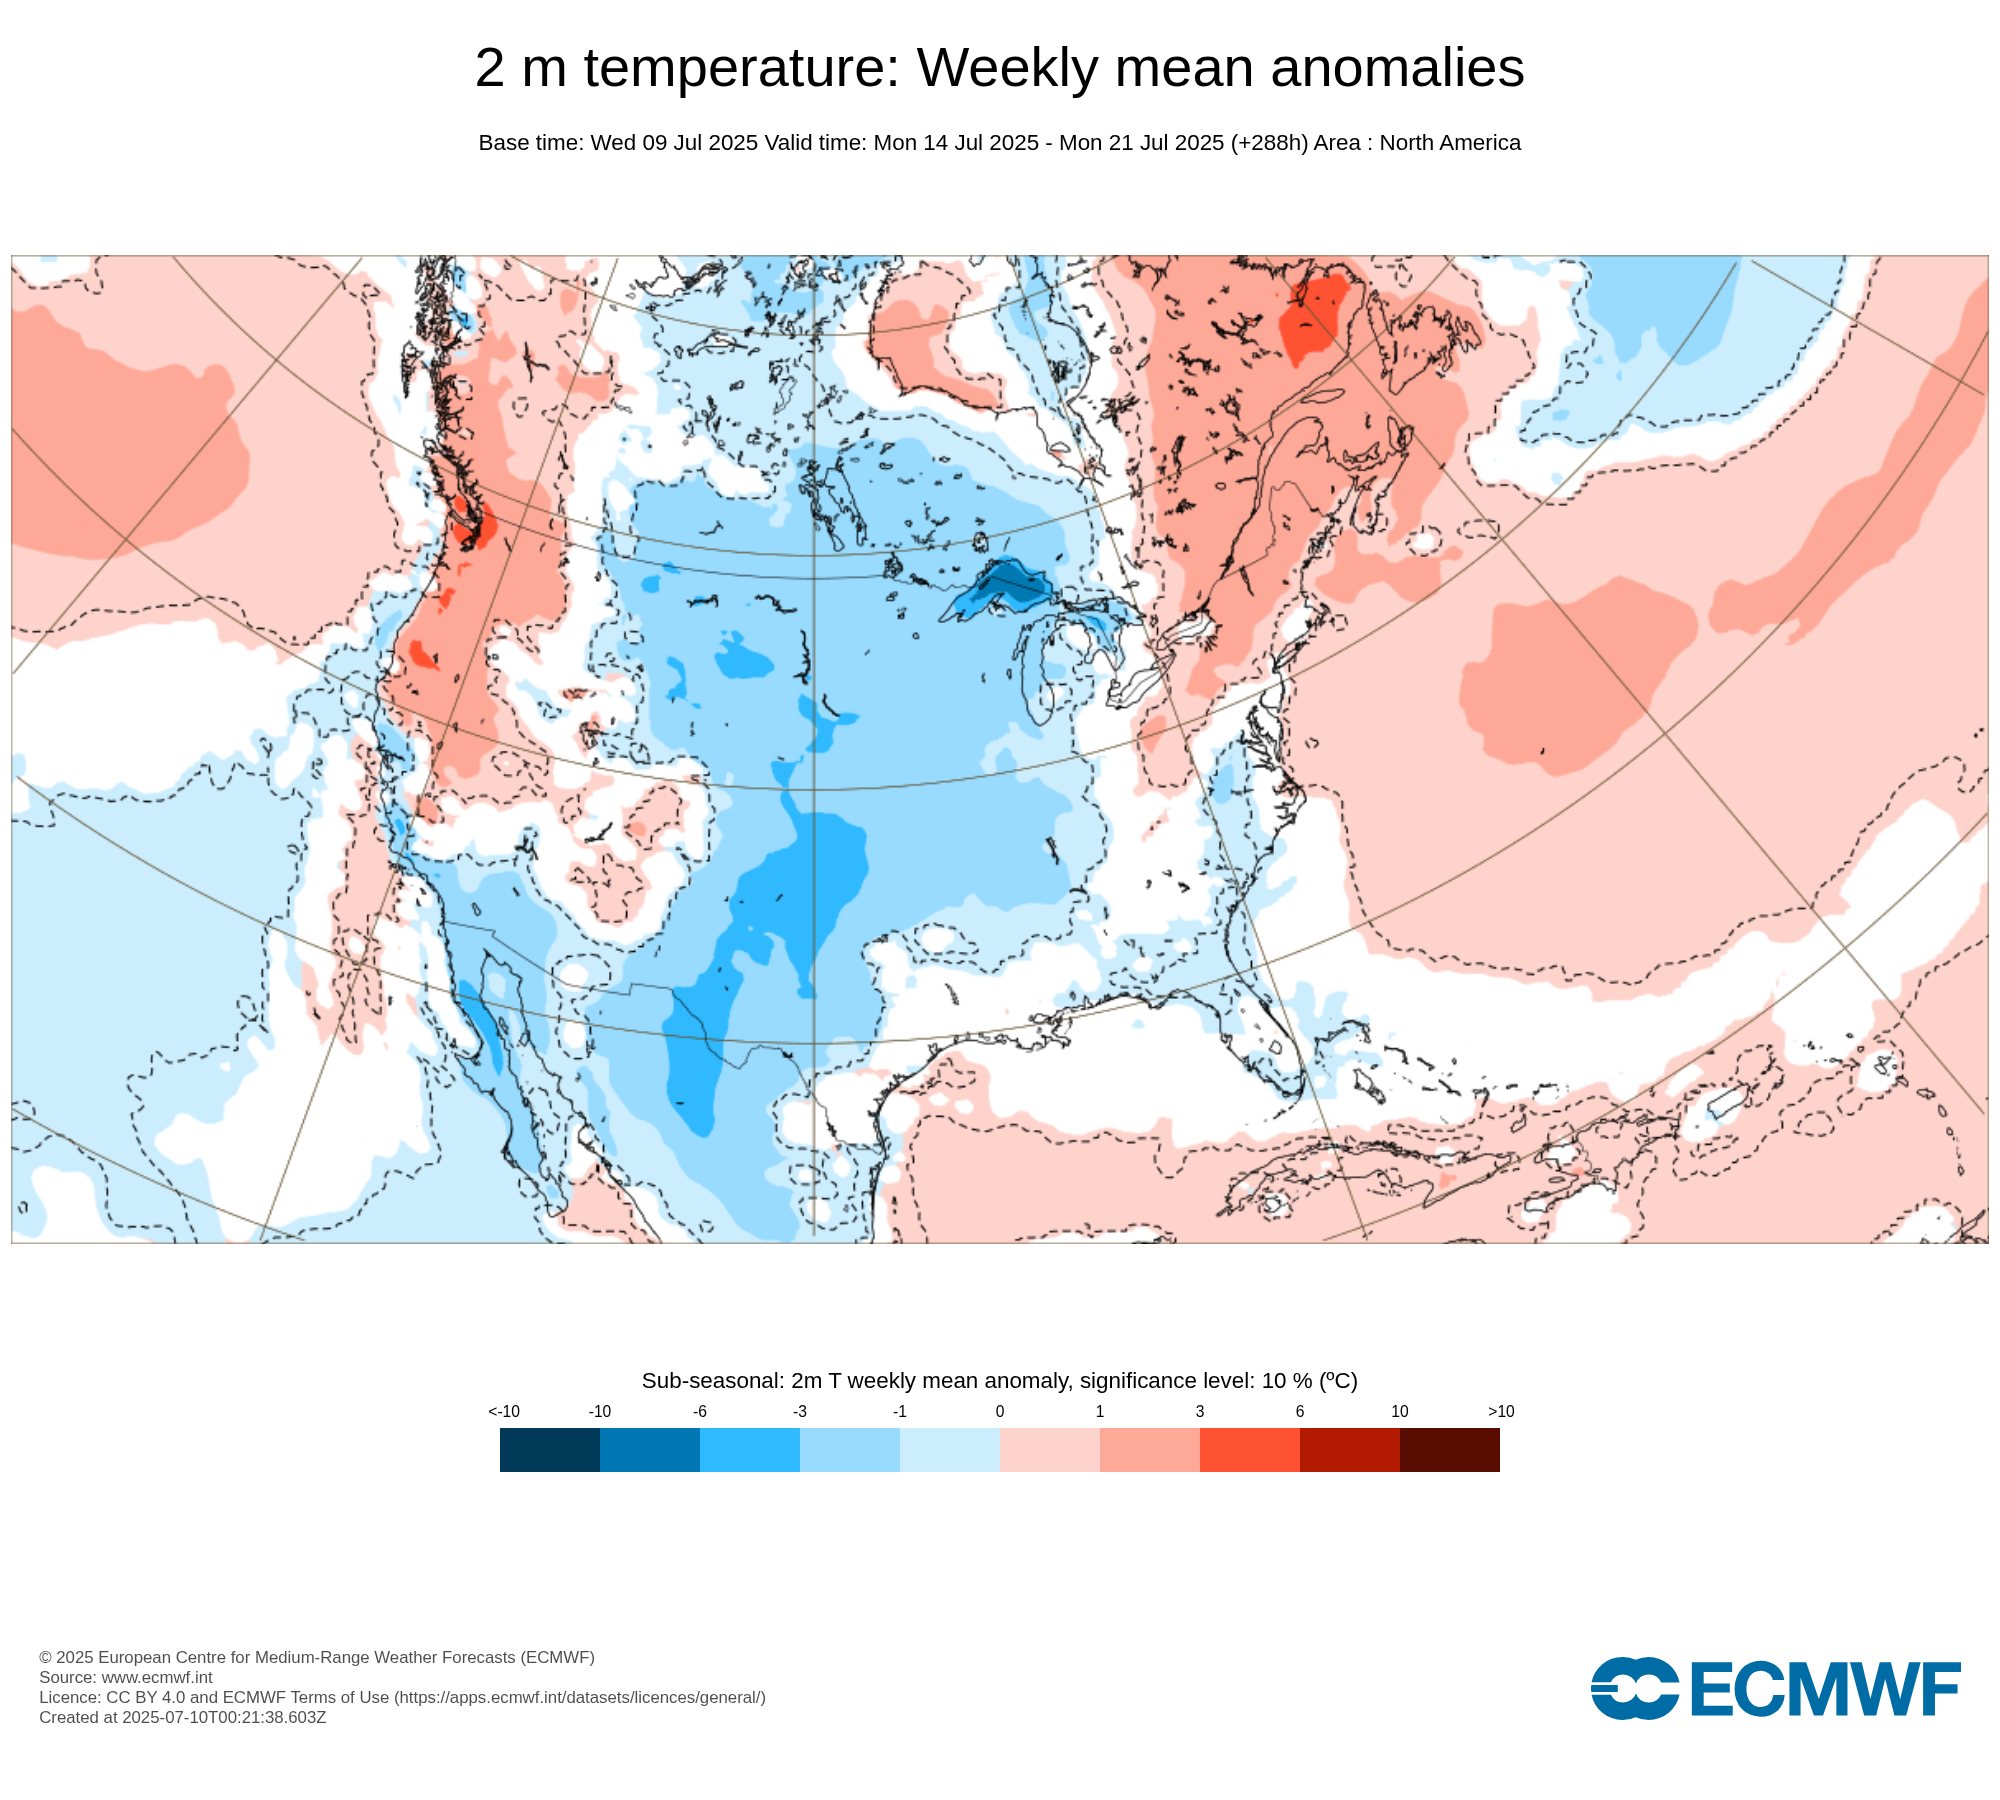
3 hours ago, bluewave said:
Familiar summer pattern coming up of cool in the middle snd warm along the coasts. Hopefully, we can get some decent rains on Long Island. But the forecast looks to keep the heaviest just inland from the coast.

Something I wanted to ask you about-- since we have broken the June 100 degree barrier here on the south shore / JFK the next barrier that needs to be broken is getting a 100 degree day in September. It's never happened at JFK has it? And the last time that Central Park had a 100 degree day in September was on September 2, 1953? The only other time Central Park hit 100 degrees in September was September 8, 1881? A notable 99 was reached on September 11, 1983, which was our latest 99. I don't think JFK has hit 99 in September (though they have hit 98 a few times.) So our next goal should be to get to 100 in September.....

July 2025 Discussion-OBS - seasonable summer variability
in New York City Metro
Posted
Nature is the final arbiter of all of the mistakes of humanity. Those mistakes are finally erased when the people who made those mistakes are all dead....