
LibertyBell
-
Posts
44,789 -
Joined
Content Type
Profiles
Blogs
Forums
American Weather
Media Demo
Store
Gallery
Posts posted by LibertyBell
-
-
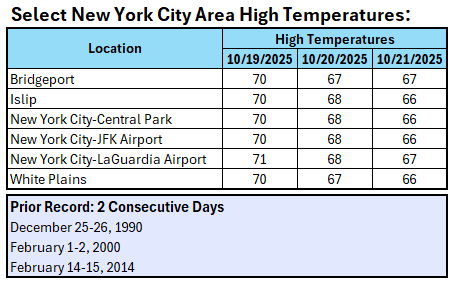
10 minutes ago, donsutherland1 said:
Today was the third consecutive day with a one-degree difference in high temperatures among Bridgeport, Islip, Central Park, JFK Airport, LaGuardia Airport, and White Plains. That set a new record for most consecutive such days.
What's causing this similarity, is it because the higher winds are equalizing temperatures across the region, Don?
-
1 hour ago, Sundog said:
@LibertyBell we need wetlands, you're going to have to get over it lol sorry bud
I know we do lol. Just not right up next to the road lol.
How come there's so many different terms used to describe the same thing 1) wetlands 2) marshes 3) swamps?
-
28 minutes ago, weatherpruf said:
the weather must be boring.....
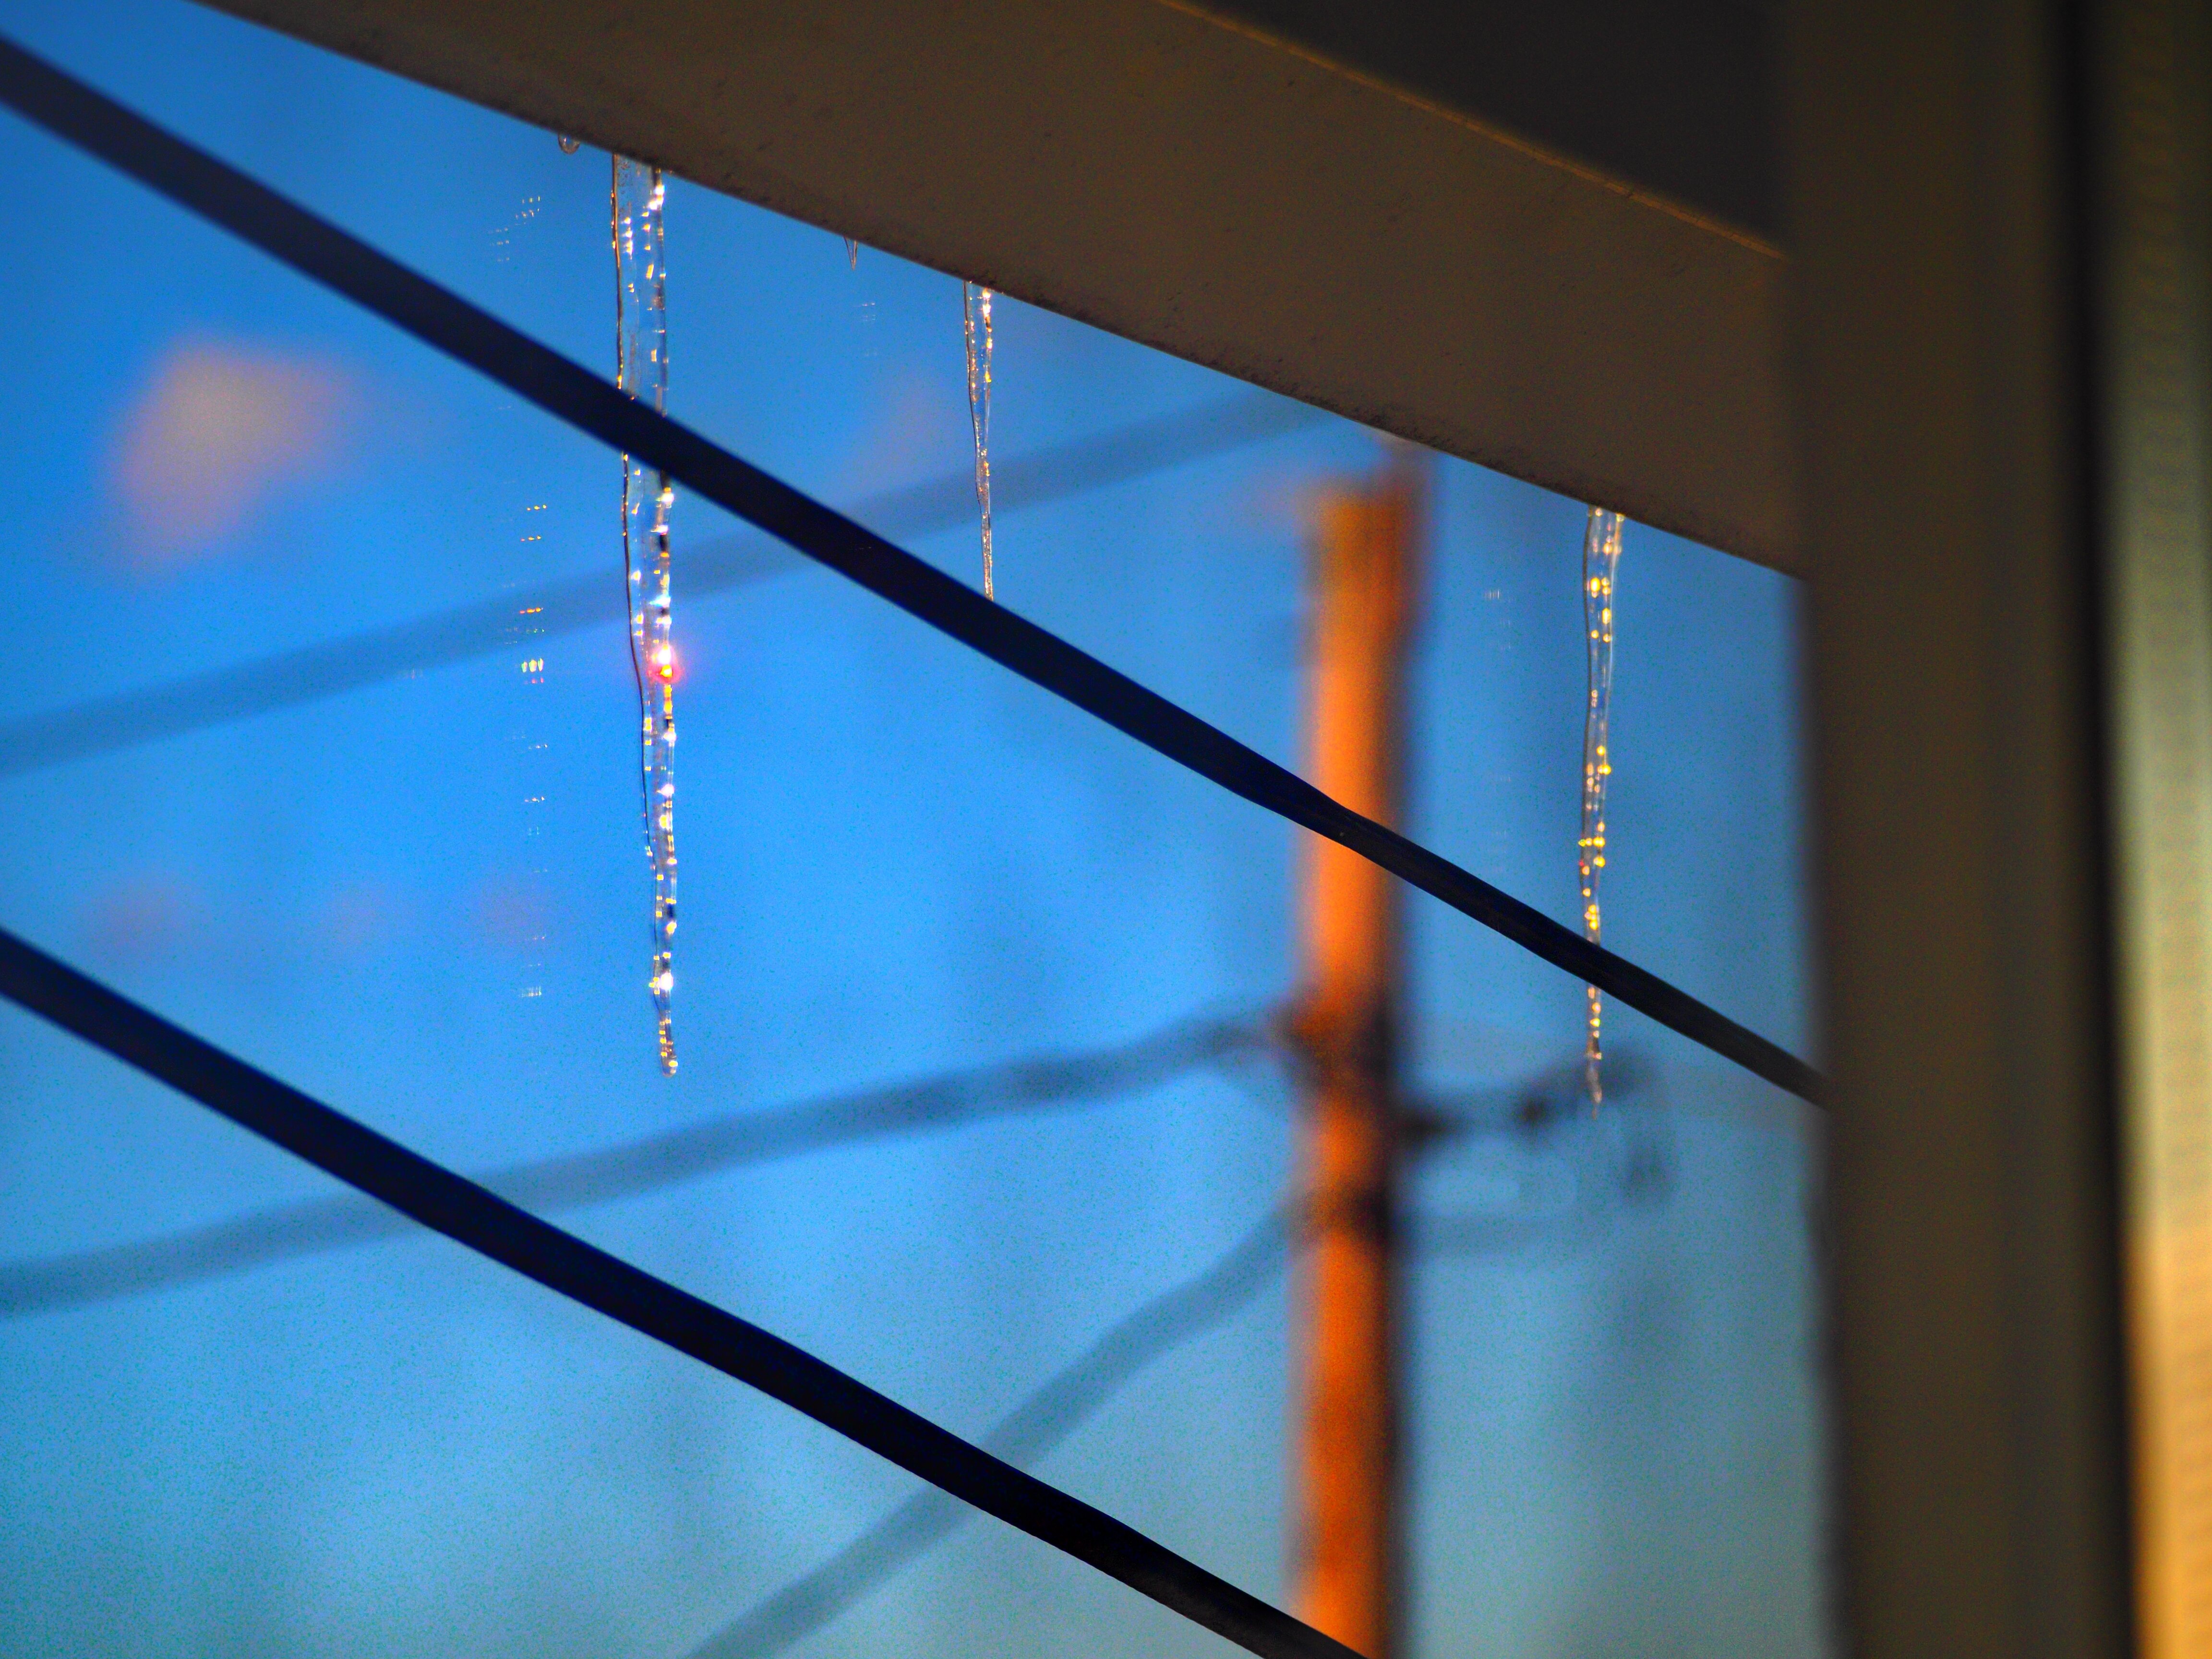
crystal clear blue skies are aesthetically very pleasing but not exciting weatherwise lol.
This was a great day though, maybe the best out of the next 10.
If it's windy later this week you'll see me complaining about allergies lol.
-
15 minutes ago, weatherpruf said:
we could not grow the amounts of food we do without pesticides. period. and we'd be inundated with roaches without them too. not all pesticides are onerous; boric acid and baking soda are pesticides. pyrethrins are pretty safe. if you've ever had a roach hitch a ride in your groceries and drop an egg sack, you would be much more inclined to be friendly to pesticides.....
Pesticides are more trouble than they are worth. I grow my own veggies organically without any. We have carcinogenic pesticides in our water here on Long Island, the consequences of farm runoff.
This is something where technology can come to the rescue, large farms are now using laser powered drones to effectively zap pests.
I don't mind the pesticides you've mentioned those are pretty safe. My issues are with organophosphates and 3,5-Dioxane.
-
1 hour ago, donsutherland1 said:
Yes, some of the ECMWF runs have been wildly unrealistic. Above normal rainfall is possible, though.
Could there be a big noreaster with very high winds as we have seen at the end of October before?
-
45 minutes ago, doncat said:
Hope so...it seems every system coming up from the south has high pressure building down from the north at the same time, suppressing it...just bad timing or what?
Sounds like a winter pattern setting up.
The end of October for whatever reason is one of those periods in which strong noreasters are common, so maybe we will have a big rain and wind event? If so, the noreaster pattern is setting up early this season.
-
59 minutes ago, JustinRP37 said:
The insecticide we were using in the nesting material was permethrin-laced cotton, so that it would not spread beyond the nesting site. The goal was to kill off the larval blacklegged ticks on the white-footed mice to help control Lyme disease spread, since the mice are the primary reservoir for the Lyme bacteria. There was limited success, but we would truly need way more than we could possibly put out in nature to truly make a difference. We try not to use any insecticides that can travel for the exact reasons you are wrong about below. Permethrin and insecticides that stay in fibers are safe while protecting the user. The number one most terrible thing being done today is things like Mosquito Joe, spraying backyards. Mosquitoes travel for well over a few miles, so treating a backyard does absolutely nothing for mosquitoes, while obliterating your local good insect population. The biodiversity crisis is honestly the most alarming thing to me, more so than climate change, and that is alarming as well. If we have to start paying people to pollinate all our major crops, we are screwed.
We are going backwards. People are more focused on weird health trends versus actually trying to be healthy by having a healthy environment. Many do not like spending any appreciable time outside because it is "gross" or "buggy". I always tell my students that you can always eat well, exercise, not smoke, etc., but if you live in an area with impaired drinking water, your risks for a lot of health issues skyrocket. If you live near a coal mine, your risks for various cancers skyrocket through no fault of your own. It is wild out there.
I don't spray anything outside, just inside, when mosquitoes come inside they are fair game. The ones that come inside are very aggressive, I've been chased across my house by mosquitoes. I guess the ones that come inside are of the extra aggressive variety? And now we have that new tropical parasite to worry about. I do let spiders handle most indoor insects. There's a spider in one of my windows that grabs mosquitoes and other insects regularly (even hornets). It fascinates me, it's a small spider and some of the insects it gets are up to 3x its size. I had to use Permethrin on my clothes because last summer I found 6 black legged ticks on my clothes and would have to undress and leave my clothes outside submersed in a bucket of water and change clothes in my garage. This was even with Permethrin on my clothes, so I'm not sure how effective it was.
Along with reduced pollinator populations, I'm not sure if people realize how fragile our entire ecosystem is, even our monotype agriculture is one step away from being completely wiped out. We have unsafe drinking water here, our aquifers have been found to have a carcinogenic pesticide that has infiltrated our drinking water so I've put a whole home six stage filter on our water, which I have to change once a year. The wild thing about coal is, it creates more radioactive waste than nuclear fission does and yet people are more worried about nuclear power for some reason. I understand that nuclear isn't without risk, but coal is so much worse.
-
 1
1
-
-
4 minutes ago, SACRUS said:
71 here - front into CPA

this is the ideal day, even the wind is much less than it was yesterday.
these frequent frontal passages are a fly in the ointment though (but a sign it's Fall.)
-
59 minutes ago, JustinRP37 said:
Dude that isn't out of the box thinking. It is not scientifically accurate or even remotely a good idea. Just so we are clear I have earned a Masters in environmental remediation and PhD in vector-borne diseases and published in both these fields. So no, I am not an uncreative robot. As for conventional *ideas* you haven't the slightest clue as to what we scientists have actually done to fix these issues. Did you know we have tried rather unconventional ways of reducing tick burdens throughout Long Island and the Hudson Valley? We have tried to have mice build nesting material made with insecticide in the threads. We have tried treating deer in the fall to reduce adult tick mating. We are thinking outside the box using science.
Humans LOVE living by water and water is vitally important, but complaining about the smell of a marsh that was literally there for hundreds of thousands of years is insane. The vast majority of marshlands exist in high human density areas. The US has lost over 50% of its wetlands to drainage and development since 1950. You make an awful lot of assumptions about people yourself. I literally live in The Great Swamp of NY. The used to call children from Patterson swamp creatures. I grew up spending summers with my grandparents in East Lyme, CT, in a marsh. Also the town where Lyme disease was officially discovered and why it is Lyme disease and not Lime disease. Did you know that marshes and swamps rival tropical rainforests for biological productivity? Swamps reduce pollution and reduce disease burden. Drained wetlands turn into some of our least productive, most disease burdened areas. These are what science tells us. Just take a look at how many chemicals it takes to run a golf course and also why they require more pest control.
As for people expressing their opinions, I am all for it, but I require students and people to back up their "opinions" with references and actual science. People in the field do call out bad ideas when we see them. I have had to take a lot of criticism in science, we all do, that is what makes us better scientists. Draining wetlands and exterminating mosquitos just isn't thinking outside the box, it is literally potentially sending us on a death spiral. We are likely already in another mass extinction event, only this time we are causing it through habitat fragmentation and way over using pesticides. Pardon me for being upset that we are literally gutting environmental protections.
I am not trying to be mean, but I am curious, what are the conventional ideas I have had? Because I'm pretty intense when I discuss that we really need to change the way we live if we are going to persist into the future. The fact that microplastics are found in literally everything is enough to cause concern.
I know about your credentials, we've discussed them before and I respect them.
But why are you using insecticides in mice nesting material? As a scientist you must be aware of the effect this has on local bird populations that feed on mice, like owls? There has to be a better way that doesn't impact other wildlife, such as birds. I had an invasion of ticks at my other house in the Poconos when a deer crashed into my pool and died there. Most of the ticks that I saw that summer were black ticks. I bought something to spray on my clothes as a tick repellant-- permethrin. I also read that opossum are the most efficient way to deal with ticks, as they are their main natural predator. So I've been encouraging more opossum onto that property and the ticks have been going down. We have opossum here too even though I live in a semi-urban area, I think they would be a great way to drive down the tick population without using chemicals.
I am well aware of Lyme disease and how it's spread to other areas. I blame stupid humans who decided that it's better to remove predators like coyotes and wolves and cougars that feed on white tailed deer who are the primary vector of the tick that carries Lyme disease. Maybe if humans didn't kill off the predators we wouldn't have an explosion of white tailed deer.
I think you misinterpreted what I stated, I never said we should remove ALL wetlands, just trim them back from highly populated areas. As for drainage, not using concrete and asphalt would help with drainage as well as helping with urban heat island. I'm all for more greenery, as in more trees and native plants and grasses, less of the invasive stuff that has become so common here.
I am 100% against pesticides. They are the main driver of the 6th mass extinction in the planet's history, as much of a problem as climate change is. And are destroying our own systems of food production by causing the collapse of pollinator populations. Something I always like to say is that humans are part of the environment, we can't consider ourselves separate from it, because what we do to it, we also do to ourselves. We're all interconnected. As far as mosquitoes are concerned, malaria is one of the top killers on the planet and there are many other mosquito borne diseases. We have better ways than using toxic chemicals. Bill Gates idea of using sterilized genetically modified mosquitoes is one of them to control their populations.
By the way, thanks for mentioning microplastics. Did you know that 6 out of 13 types of cancer are on a rapid rise even in younger people because of a combination of highly processed food, microplastics in food as well as environmental toxins like pesticides? It seems like we are going backwards and regressing. Humanity isn't sustainable in its current form.
-
5 minutes ago, Typhoon Tip said:
i know, and I find the inflation idea of our universe' supposed first eras of existence as eerily similar to the 'next is larger' ... like, maybe ... just maybe the inflation they're theorizing is actually that size recreation - wild idea perhaps
Yes this is how that would work, each inflationary period has to last longer. Here's something else interesting, the finding that dark energy oscillates and is now slowing down. We might be at the cusp of a contracting universe as the cosmological constant doesn't seem to be constant anymore.
The universe might be hitting middle age as it were.
By the way something else that goes along with this whole cosmic DNA idea is that a universe with life is more likely to give birth to another universe that has life in it. It transfers at least some of its physical properties to its offspring. There might be some random cosmic mutations that make certain things different (just like we have in biology). These could be the *improvements* you mentioned (in some cases.) Do you know what one improvement might be? Have life develop more early in the universe's history and even sentient life earlier on. That might make it easier to travel between systems and get around some of the unsustainable aspects of life (and at an earlier stage of the universe there was likely much more energy available to use as a resource.)
-
6 minutes ago, Typhoon Tip said:
That's precisely ... I tacitly embedded that idea with 'death as necessity'
Life gets passed the 2nd law by reproducing, where the offspring are - it is hoped, but succeeds more than 50% of the time - at least as good a copy as the progenitor. And, because mitosis ( by the way...) via gamete union has a natural ability to factor out imperfections, there's a chance the copies are improvements.
Yes this analog is perfect to describe how death and birth are part of a (nearly) endless cycle. I don't think the cycle is truly endless though, at some point the entire mechanism runs out of fuel (as it were).
By the way, for the cyclic model of the universe there is a specific requirement to get around entropy, it is that the next new universe has to be larger than the one preceding it. I'm not sure how this applies to offspring although maybe there is something in there that eventually drives the whole process to a halt.
I don't think true immortality is possible or that we should ever even desire it. It would probably just create a spike in the suicide rate.
-
On 10/20/2025 at 9:05 AM, Typhoon Tip said:
Fermi Paradox explanation, incarnate if you ask me.
It is a personal hypothesis of mine; in it's simplest preface states, 'the species evolves the ability, and then the ability unwittingly devolves the species'. Which yet even more succinctly equates to, 'species evolution emerges the devolution of the species'
Whether there is any veracity to that idea or not, we cannot deny the intuitive suspicion, nor the outright observation of the 'emerging Idiocrasy' phenomenon, and the precarious vision of that state of affairs being in charge of a climate future, nuclear armament future, biological toxicity future ...etc, etc.
Maybe human evolution has reached the point whence the Law of Diminishing Returns has kicked it. The law of diminishing returns, often referred to as the law of lessening returns, states that if you keep increasing one factor of production while keeping others constant, the additional output gained from each new unit of that factor will eventually decrease... I mean ... we can see that with a modest interpretation of that we might be observing how more and more provision of resource, both physical or informed, is resulting in less productivity ( perhaps a perversion of "intelligentsia" for this context ). Less is coming back from the people being effected by all that provision. Perhaps that's twisting things too much, but I don't believe so. It's anecdotal, but an example: I've been finding vis-à-vis. more and more with this current version of humanity, when ideas like the above are floated in mixed company, the points and/or abstractions fail to comprehended as readily as they once did ... decades ago. I'm just now old enough to recall water cooler conversations where among the colloquy were sincere head nodders. Now, you get a more gaped jaws under blank stares, followed by a some effacing joke about it being over heads.
Maybe in some analog ( if not physical) sense it is similar to entropy growing within the system - I kind of like that actually. Because we learn via formal academia that entropy does in fact gain in every system that exists in nature. Entropy in simplest definition is the measure of disorder in a system. So why would the evolutionary process not have to pay into that universal "cosmological tax" for existence.
It is not hard to see how species evolution might ironically lead to devolution. The reason is plainly acceptable, if one understands evolution to begin with, more specifically how it works. Evolution perfects the specie's ability to survive by a transactional relationship between chance mutations during and preceding competition. Those with insufficient mutation, thus lacking skill, don't win.
") And the trophy? the trophy is not OLED TV's, Buggatti cars, Yaughts and palatial estates, dinners with celebrities ... fortune providing eases of living - in fact, no "eases" even short of that illustrious list of aspiration is part of the trophy - not to nature.
And the trophy? the trophy is not OLED TV's, Buggatti cars, Yaughts and palatial estates, dinners with celebrities ... fortune providing eases of living - in fact, no "eases" even short of that illustrious list of aspiration is part of the trophy - not to nature.
In nature, the trophy is the ability to have sex with the best possible partner and give birth to the healthiest possible children, that in turn will carry on the lineage of those competition (and chance) refined genetics. The children of that union thus possess greater and greater prospects to achieve the same... Many generations later, the species has improved. That is what evolution is. Humanity is attempting, unwittingly, to take proxy away from the Darwinian process, and redraw it as "capital Darwinism" - which really isn't sustainable, because it has nothing to do with creating the best version of our species. It's no wonder that now, after the last 200 some-odd years since the Industrial Revolution accelerated capital Darwinism, we find that having done so has procreated all these existential perils.
That is also why we necessarily die. That model provides we are receptacles of growing disorder that our offspring have a better chance to survive for being better equipped. However, they too are ultimately doomed to being receptacles; but their children may in turn be better suited ...and on and so on. Evolution is kind of an eerily genius adaptation to fend off entropy eventually eroding at a system to the point of demise.
There's a bit of a catch-22 to all this, where "eases of living" intrinsically lowers competition ( or necessity for the arrival of favorable mutation) stresses, which halts perfecting the system. Attempting to perpetuate the intrinsic vitality of any species, while lowering challenges spanning successive generation, smacks like physically impossible due to the ever growing quotient of disorder; there are no longer needs to improve via adaptation.
This is why species - probably - fail once they get to some ceiling of achievements along their legacy, whence feedback lessens returns. That science fiction novel is easy to write. They end up in a figurative cul-de-sac of immensely powerful technological capacity but oops... the Idiocrasy has slipped below the necessary intelligence to responsibly serve as custodian and operator.
But... any such Fermi Paradox explanation needs to apply universally. The above essay might intuitively fit humanity. Based upon all available evidence, that is. Perhaps some other species has evolved the "genetics" - if their life form even uses genetics as wee know it ... - to always be compensating for lessening returns ( which otherwise leads to a build up in critical entropy). At least in our case, that's not possible though. But it is hard to imagine an alien evolutionary process that escapes the negative feed-back from lessening challenges of the Darwinian motif - or how.
Every aspect of biology in any living organism serves a purpose. Evolution provided that. Fits the biological model that living systems do not sustain cells and organs, etc, that are no longer being used. Everything in an organism is necessary. For earth biology, as far as we can assume human kind being a part ... intelligence was an emergent property of all that. In our case, absolutely necessary for our rise out of obscurity.
So, if the 'state of provision' and eases of living get in the way of needed intelligence, where does the intelligence go? Just the last 20 years of recent modernity's surplus in 'how-to' and/or what-you-need-to-know at finger tips with nearly zero challenges, has managed to en masse vote a convicted criminal, harboring a dark triad narcissistic personality disorder ... into a position of self-fulfilling power.
Breeding itself is by definition a diminishing return because of limited resources and finite land (unless we colonize space). It results in overpopulation. The road to evolution is also the road to the destruction of the evolving species. Human nature itself is unsustainable. The planet will be fine, it has a natural tipping point to take care of the offending species
It will always choose biodiversity over the dominance of one species, it self regulates just like the Gaia Hypothesis conjectures.
-
On 10/20/2025 at 9:05 AM, Typhoon Tip said:
Fermi Paradox explanation, incarnate if you ask me.
It is a personal hypothesis of mine; in it's simplest preface states, 'the species evolves the ability, and then the ability unwittingly devolves the species'. Which yet even more succinctly equates to, 'species evolution emerges the devolution of the species'
Whether there is any veracity to that idea or not, we cannot deny the intuitive suspicion, nor the outright observation of the 'emerging Idiocrasy' phenomenon, and the precarious vision of that state of affairs being in charge of a climate future, nuclear armament future, biological toxicity future ...etc, etc.
Maybe human evolution has reached the point whence the Law of Diminishing Returns has kicked it. The law of diminishing returns, often referred to as the law of lessening returns, states that if you keep increasing one factor of production while keeping others constant, the additional output gained from each new unit of that factor will eventually decrease... I mean ... we can see that with a modest interpretation of that we might be observing how more and more provision of resource, both physical or informed, is resulting in less productivity ( perhaps a perversion of "intelligentsia" for this context ). Less is coming back from the people being effected by all that provision. Perhaps that's twisting things too much, but I don't believe so. It's anecdotal, but an example: I've been finding vis-à-vis. more and more with this current version of humanity, when ideas like the above are floated in mixed company, the points and/or abstractions fail to comprehended as readily as they once did ... decades ago. I'm just now old enough to recall water cooler conversations where among the colloquy were sincere head nodders. Now, you get a more gaped jaws under blank stares, followed by a some effacing joke about it being over heads.
Maybe in some analog ( if not physical) sense it is similar to entropy growing within the system - I kind of like that actually. Because we learn via formal academia that entropy does in fact gain in every system that exists in nature. Entropy in simplest definition is the measure of disorder in a system. So why would the evolutionary process not have to pay into that universal "cosmological tax" for existence.
It is not hard to see how species evolution might ironically lead to devolution. The reason is plainly acceptable, if one understands evolution to begin with, more specifically how it works. Evolution perfects the specie's ability to survive by a transactional relationship between chance mutations during and preceding competition. Those with insufficient mutation, thus lacking skill, don't win.
And the trophy? the trophy is not OLED TV's, Buggatti cars, Yaughts and palatial estates, dinners with celebrities ... fortune providing eases of living - in fact, no "eases" even short of that illustrious list of aspiration is part of the trophy - not to nature.
In nature, the trophy is the ability to have sex with the best possible partner and give birth to the healthiest possible children, that in turn will carry on the lineage of those competition (and chance) refined genetics. The children of that union thus possess greater and greater prospects to achieve the same... Many generations later, the species has improved. That is what evolution is. Humanity is attempting, unwittingly, to take proxy away from the Darwinian process, and redraw it as "capital Darwinism" - which really isn't sustainable, because it has nothing to do with creating the best version of our species. It's no wonder that now, after the last 200 some-odd years since the Industrial Revolution accelerated capital Darwinism, we find that having done so has procreated all these existential perils.
That is also why we necessarily die. That model provides we are receptacles of growing disorder that our offspring have a better chance to survive for being better equipped. However, they too are ultimately doomed to being receptacles; but their children may in turn be better suited ...and on and so on. Evolution is kind of an eerily genius adaptation to fend off entropy eventually eroding at a system to the point of demise.
There's a bit of a catch-22 to all this, where "eases of living" intrinsically lowers competition ( or necessity for the arrival of favorable mutation) stresses, which halts perfecting the system. Attempting to perpetuate the intrinsic vitality of any species, while lowering challenges spanning successive generation, smacks like physically impossible due to the ever growing quotient of disorder; there are no longer needs to improve via adaptation.
This is why species - probably - fail once they get to some ceiling of achievements along their legacy, whence feedback lessens returns. That science fiction novel is easy to write. They end up in a figurative cul-de-sac of immensely powerful technological capacity but oops... the Idiocrasy has slipped below the necessary intelligence to responsibly serve as custodian and operator.
But... any such Fermi Paradox explanation needs to apply universally. The above essay might intuitively fit humanity. Based upon all available evidence, that is. Perhaps some other species has evolved the "genetics" - if their life form even uses genetics as wee know it ... - to always be compensating for lessening returns ( which otherwise leads to a build up in critical entropy). At least in our case, that's not possible though. But it is hard to imagine an alien evolutionary process that escapes the negative feed-back from lessening challenges of the Darwinian motif - or how.
Every aspect of biology in any living organism serves a purpose. Evolution provided that. Fits the biological model that living systems do not sustain cells and organs, etc, that are no longer being used. Everything in an organism is necessary. For earth biology, as far as we can assume human kind being a part ... intelligence was an emergent property of all that. In our case, absolutely necessary for our rise out of obscurity.
So, if the 'state of provision' and eases of living get in the way of needed intelligence, where does the intelligence go? Just the last 20 years of recent modernity's surplus in 'how-to' and/or what-you-need-to-know at finger tips with nearly zero challenges, has managed to en masse vote a convicted criminal, harboring a dark triad narcissistic personality disorder ... into a position of self-fulfilling power.
There is a way around the Second Law of Thermodynamics (Entropy) as far as the universe is concerned. In the cyclic model this is achieved by the universe coming back *empty*. In other words all of the universe's matter becomes part of a black hole. The black hole represents the maximum state of entropy possible. But..... with a specific type of black hole called the Kerr Black Hole (a spinning black hole), this maximum state of entropy can give birth to a new universe. The recent discovery of our own universe spinning is strong evidence in this regard (just like it is strong evidence of a multiverse, for our universe needs an outside frame of reference it is spinning in comparison to.) If this is correct, our universe itself is inside a spinning Kerr Black Hole inside a larger superverse.
-
On 10/20/2025 at 9:05 AM, Typhoon Tip said:
Fermi Paradox explanation, incarnate if you ask me.
It is a personal hypothesis of mine; in it's simplest preface states, 'the species evolves the ability, and then the ability unwittingly devolves the species'. Which yet even more succinctly equates to, 'species evolution emerges the devolution of the species'
Whether there is any veracity to that idea or not, we cannot deny the intuitive suspicion, nor the outright observation of the 'emerging Idiocrasy' phenomenon, and the precarious vision of that state of affairs being in charge of a climate future, nuclear armament future, biological toxicity future ...etc, etc.
Maybe human evolution has reached the point whence the Law of Diminishing Returns has kicked it. The law of diminishing returns, often referred to as the law of lessening returns, states that if you keep increasing one factor of production while keeping others constant, the additional output gained from each new unit of that factor will eventually decrease... I mean ... we can see that with a modest interpretation of that we might be observing how more and more provision of resource, both physical or informed, is resulting in less productivity ( perhaps a perversion of "intelligentsia" for this context ). Less is coming back from the people being effected by all that provision. Perhaps that's twisting things too much, but I don't believe so. It's anecdotal, but an example: I've been finding vis-à-vis. more and more with this current version of humanity, when ideas like the above are floated in mixed company, the points and/or abstractions fail to comprehended as readily as they once did ... decades ago. I'm just now old enough to recall water cooler conversations where among the colloquy were sincere head nodders. Now, you get a more gaped jaws under blank stares, followed by a some effacing joke about it being over heads.
Maybe in some analog ( if not physical) sense it is similar to entropy growing within the system - I kind of like that actually. Because we learn via formal academia that entropy does in fact gain in every system that exists in nature. Entropy in simplest definition is the measure of disorder in a system. So why would the evolutionary process not have to pay into that universal "cosmological tax" for existence.
It is not hard to see how species evolution might ironically lead to devolution. The reason is plainly acceptable, if one understands evolution to begin with, more specifically how it works. Evolution perfects the specie's ability to survive by a transactional relationship between chance mutations during and preceding competition. Those with insufficient mutation, thus lacking skill, don't win.
And the trophy? the trophy is not OLED TV's, Buggatti cars, Yaughts and palatial estates, dinners with celebrities ... fortune providing eases of living - in fact, no "eases" even short of that illustrious list of aspiration is part of the trophy - not to nature.
In nature, the trophy is the ability to have sex with the best possible partner and give birth to the healthiest possible children, that in turn will carry on the lineage of those competition (and chance) refined genetics. The children of that union thus possess greater and greater prospects to achieve the same... Many generations later, the species has improved. That is what evolution is. Humanity is attempting, unwittingly, to take proxy away from the Darwinian process, and redraw it as "capital Darwinism" - which really isn't sustainable, because it has nothing to do with creating the best version of our species. It's no wonder that now, after the last 200 some-odd years since the Industrial Revolution accelerated capital Darwinism, we find that having done so has procreated all these existential perils.
That is also why we necessarily die. That model provides we are receptacles of growing disorder that our offspring have a better chance to survive for being better equipped. However, they too are ultimately doomed to being receptacles; but their children may in turn be better suited ...and on and so on. Evolution is kind of an eerily genius adaptation to fend off entropy eventually eroding at a system to the point of demise.
There's a bit of a catch-22 to all this, where "eases of living" intrinsically lowers competition ( or necessity for the arrival of favorable mutation) stresses, which halts perfecting the system. Attempting to perpetuate the intrinsic vitality of any species, while lowering challenges spanning successive generation, smacks like physically impossible due to the ever growing quotient of disorder; there are no longer needs to improve via adaptation.
This is why species - probably - fail once they get to some ceiling of achievements along their legacy, whence feedback lessens returns. That science fiction novel is easy to write. They end up in a figurative cul-de-sac of immensely powerful technological capacity but oops... the Idiocrasy has slipped below the necessary intelligence to responsibly serve as custodian and operator.
But... any such Fermi Paradox explanation needs to apply universally. The above essay might intuitively fit humanity. Based upon all available evidence, that is. Perhaps some other species has evolved the "genetics" - if their life form even uses genetics as wee know it ... - to always be compensating for lessening returns ( which otherwise leads to a build up in critical entropy). At least in our case, that's not possible though. But it is hard to imagine an alien evolutionary process that escapes the negative feed-back from lessening challenges of the Darwinian motif - or how.
Every aspect of biology in any living organism serves a purpose. Evolution provided that. Fits the biological model that living systems do not sustain cells and organs, etc, that are no longer being used. Everything in an organism is necessary. For earth biology, as far as we can assume human kind being a part ... intelligence was an emergent property of all that. In our case, absolutely necessary for our rise out of obscurity.
So, if the 'state of provision' and eases of living get in the way of needed intelligence, where does the intelligence go? Just the last 20 years of recent modernity's surplus in 'how-to' and/or what-you-need-to-know at finger tips with nearly zero challenges, has managed to en masse vote a convicted criminal, harboring a dark triad narcissistic personality disorder ... into a position of self-fulfilling power.
I have an idea for how the limitations of biology can be overcome, what about inorganic bodies that can house our consciousness? Maybe that would enable the species to think more logically and not be so dependent on organic compounds (which is what fossil fuels are)? We would be automatically immune from all diseases too.
-
On 10/20/2025 at 9:05 AM, Typhoon Tip said:
Fermi Paradox explanation, incarnate if you ask me.
It is a personal hypothesis of mine; in it's simplest preface states, 'the species evolves the ability, and then the ability unwittingly devolves the species'. Which yet even more succinctly equates to, 'species evolution emerges the devolution of the species'
Whether there is any veracity to that idea or not, we cannot deny the intuitive suspicion, nor the outright observation of the 'emerging Idiocrasy' phenomenon, and the precarious vision of that state of affairs being in charge of a climate future, nuclear armament future, biological toxicity future ...etc, etc.
Maybe human evolution has reached the point whence the Law of Diminishing Returns has kicked it. The law of diminishing returns, often referred to as the law of lessening returns, states that if you keep increasing one factor of production while keeping others constant, the additional output gained from each new unit of that factor will eventually decrease... I mean ... we can see that with a modest interpretation of that we might be observing how more and more provision of resource, both physical or informed, is resulting in less productivity ( perhaps a perversion of "intelligentsia" for this context ). Less is coming back from the people being effected by all that provision. Perhaps that's twisting things too much, but I don't believe so. It's anecdotal, but an example: I've been finding vis-à-vis. more and more with this current version of humanity, when ideas like the above are floated in mixed company, the points and/or abstractions fail to comprehended as readily as they once did ... decades ago. I'm just now old enough to recall water cooler conversations where among the colloquy were sincere head nodders. Now, you get a more gaped jaws under blank stares, followed by a some effacing joke about it being over heads.
Maybe in some analog ( if not physical) sense it is similar to entropy growing within the system - I kind of like that actually. Because we learn via formal academia that entropy does in fact gain in every system that exists in nature. Entropy in simplest definition is the measure of disorder in a system. So why would the evolutionary process not have to pay into that universal "cosmological tax" for existence.
It is not hard to see how species evolution might ironically lead to devolution. The reason is plainly acceptable, if one understands evolution to begin with, more specifically how it works. Evolution perfects the specie's ability to survive by a transactional relationship between chance mutations during and preceding competition. Those with insufficient mutation, thus lacking skill, don't win.
And the trophy? the trophy is not OLED TV's, Buggatti cars, Yaughts and palatial estates, dinners with celebrities ... fortune providing eases of living - in fact, no "eases" even short of that illustrious list of aspiration is part of the trophy - not to nature.
In nature, the trophy is the ability to have sex with the best possible partner and give birth to the healthiest possible children, that in turn will carry on the lineage of those competition (and chance) refined genetics. The children of that union thus possess greater and greater prospects to achieve the same... Many generations later, the species has improved. That is what evolution is. Humanity is attempting, unwittingly, to take proxy away from the Darwinian process, and redraw it as "capital Darwinism" - which really isn't sustainable, because it has nothing to do with creating the best version of our species. It's no wonder that now, after the last 200 some-odd years since the Industrial Revolution accelerated capital Darwinism, we find that having done so has procreated all these existential perils.
That is also why we necessarily die. That model provides we are receptacles of growing disorder that our offspring have a better chance to survive for being better equipped. However, they too are ultimately doomed to being receptacles; but their children may in turn be better suited ...and on and so on. Evolution is kind of an eerily genius adaptation to fend off entropy eventually eroding at a system to the point of demise.
There's a bit of a catch-22 to all this, where "eases of living" intrinsically lowers competition ( or necessity for the arrival of favorable mutation) stresses, which halts perfecting the system. Attempting to perpetuate the intrinsic vitality of any species, while lowering challenges spanning successive generation, smacks like physically impossible due to the ever growing quotient of disorder; there are no longer needs to improve via adaptation.
This is why species - probably - fail once they get to some ceiling of achievements along their legacy, whence feedback lessens returns. That science fiction novel is easy to write. They end up in a figurative cul-de-sac of immensely powerful technological capacity but oops... the Idiocrasy has slipped below the necessary intelligence to responsibly serve as custodian and operator.
But... any such Fermi Paradox explanation needs to apply universally. The above essay might intuitively fit humanity. Based upon all available evidence, that is. Perhaps some other species has evolved the "genetics" - if their life form even uses genetics as wee know it ... - to always be compensating for lessening returns ( which otherwise leads to a build up in critical entropy). At least in our case, that's not possible though. But it is hard to imagine an alien evolutionary process that escapes the negative feed-back from lessening challenges of the Darwinian motif - or how.
Every aspect of biology in any living organism serves a purpose. Evolution provided that. Fits the biological model that living systems do not sustain cells and organs, etc, that are no longer being used. Everything in an organism is necessary. For earth biology, as far as we can assume human kind being a part ... intelligence was an emergent property of all that. In our case, absolutely necessary for our rise out of obscurity.
So, if the 'state of provision' and eases of living get in the way of needed intelligence, where does the intelligence go? Just the last 20 years of recent modernity's surplus in 'how-to' and/or what-you-need-to-know at finger tips with nearly zero challenges, has managed to en masse vote a convicted criminal, harboring a dark triad narcissistic personality disorder ... into a position of self-fulfilling power.
I've always believed the Great Filter lies ahead of us, there are some barriers that most sentient species simply cannot cross. Did you know that research has been done showing that human intelligence peaked about 3000 years ago and has been declining ever since? Dependence on technology, the industrial revolution, etc., all make humanity unsustainable.
-
11 minutes ago, donsutherland1 said:
I don’t think any tropical cyclone will make landfall. Some moisture could be tapped, allowing for an enhancement of rainfall.
I think those 3-6 inch rainfall amounts are somewhat overdone, 1-2 inches are more likely. That's what we need, heavier rainfall would just cause flooding and not help drought concerns.
-
8 minutes ago, donsutherland1 said:
Frontal passage possibly slowed by blocking, allowing for greater precipitation. There are some hints of a tropical moisture connection. Details remain to be resolved.
But that tropical system will probably remain offshore and the front will just funnel the moisture up here without any of the high winds?
-
1 hour ago, SACRUS said:
Records:
Highs:
EWR: 84 (1947)
NYC: 84 (1920)
LGA: 82 (1947)
JFK: 81 (1963)
Lows:
EWR: 31 (1974)
NYC: 31 (1871)
LGA: 33 (1974)
JFK: 31 (1973)
Historical:
1743: On the evening of the 21st Ben Franklin had hoped to observe a lunar eclipse in Philadelphia but cloudy skies from a VA coastal storm hide the moon. Franklin later learned from sources in Boston that the same eclipse seen in clear skies in the NE but a violent storm hit them the next day. Franklin reasoned that it was the same storm and that weather moves.
(Washington Weather Book 2002 by Ambrose, Henry, Weiss) It puzzled Franklin that the system seemed to move from southwest to northeast even though winds at his location were from the northeast. He theorized the winds in the storm system must have been rotating around a center. A brilliant deduction considering he had no satellite to show the big picture.
(Ref. AccWeather Weather History)
1780: Spanish Admiral Solano was enroute from Havana to Pensacola in October 1780 to capture the important port city. The third major hurricane of the month swept north through the Gulf of Mexico catching and scattering the fleet of 64 warships. (Ref. AccWeather Weather History)
1804: First snow of the season seen by the Lewis and Clark Expedition near Bismark, North Dakota. The snow fell to a depth of one-half inch. (Ref. AccWeather Weather History)
1934 - A severe windstorm lashed the northern Pacific coast. In Washington State, the storm claimed the lives of 22 persons, and caused 1.7 million dollars damage, mostly to timber. Winds, gusting to 87 mph at North Head WA, produced waves twenty feet high. (David Ludlum)
1952: Earliest first frost in Washington DC. (Ref. Washington Weather Records - KDCA)
1957 - The second in a series of unusual October storms hit southern California causing widespread thunderstorms. Santa Maria was drenched with 1.13 inches of rain in two hours. Hail drifted to 18 inches in East Los Angeles. Waterspouts were sighted off Point Mugu and Oceanside. (20th-21st) (The Weather Channel)
1975: Carlton Fisk made history on this day because of a walk-off home run in the 1975 World Series, after rain had postponed it for three days.1987 - Cold arctic air continued to invade the central U.S. Eleven record lows were reported in the Great Plains Region, including lows of 12 degrees at Valentine NE, and 9 degrees at Aberdeen SD. Temperatures warmed rapidly during the day in the Southern and Central Plains Region. Goodland KS warmed from a morning low of 24 degrees to an afternoon high of 75 degrees. (The National Weather Summary)
1988 - Joan, the last hurricane of the season, neared the coast of Nicaragua packing 125 mph winds. Joan claimed more than 200 lives as she moved over Central America, and total damage approached 1.5 billion dollars. Crossing more than 40 degrees of longitude, Hurricane Joan never strayed even one degree from the 12 degree north parallel. (The National Weather Summary) (Storm Data)
1989 - Unseasonably cold weather continued to grip the south central and southeastern U.S. Twenty cities reported record low temperatures for the date, including Calico AR with a reading of 26 degrees, and Daytona Beach FL with a low of 41 degrees. Squalls in the Great Lakes Region finally came to an end, but not before leaving Marquette MI buried under 12.7 inches of snow, a record 24 hour total for October. (The National Weather Summary) (Storm Data)
1996: A state of emergency was declared in Massachusetts, New Hampshire and Maine after a powerful coastal storm dumped over a foot of rain causing massive flooding. Portland, ME recorded 7.92 inches of rainfall in 24 hours to set their rainfall record.(Ref. AccWeather Weather History) Boston, Massachusetts on the 20th and 21st had the greatest 24 hour precipitation of 6.66 inches for the month of October. (Ref. NOAA Boston Weather Events)
1998: A tropical depression formed in the southwest Caribbean Sea, about 360 miles south of Kingston, Jamaica. This disturbance would intensify over the next few days to become Hurricane Mitch, a monster storm that would eventually become the second deadliest Atlantic hurricane on record, behind "The Great Hurricane" of 1780 in the Caribbean. (Ref. AccWeather Weather History)1743: On the evening of the 21st Ben Franklin had hoped to observe a lunar eclipse in Philadelphia but cloudy skies from a VA coastal storm hide the moon. Franklin later learned from sources in Boston that the same eclipse seen in clear skies in the NE but a violent storm hit them the next day. Franklin reasoned that it was the same storm and that weather moves.
(Washington Weather Book 2002 by Ambrose, Henry, Weiss) It puzzled Franklin that the system seemed to move from southwest to northeast even though winds at his location were from the northeast. He theorized the winds in the storm system must have been rotating around a center. A brilliant deduction considering he had no satellite to show the big picture.
(Ref. AccWeather Weather History)I would much rather see the eclipse
1996: A state of emergency was declared in Massachusetts, New Hampshire and Maine after a powerful coastal storm dumped over a foot of rain causing massive flooding. Portland, ME recorded 7.92 inches of rainfall in 24 hours to set their rainfall record.(Ref. AccWeather Weather History) Boston, Massachusetts on the 20th and 21st had the greatest 24 hour precipitation of 6.66 inches for the month of October. (Ref. NOAA Boston Weather Events)
How much rain did this storm drop here? I don't remember it at all Tony.
-
16 hours ago, donsutherland1 said:
Newark will probably approach or reach 70°. Most of the NYC area will probably fall just short.
it's close to 70 here now
-
16 hours ago, donsutherland1 said:
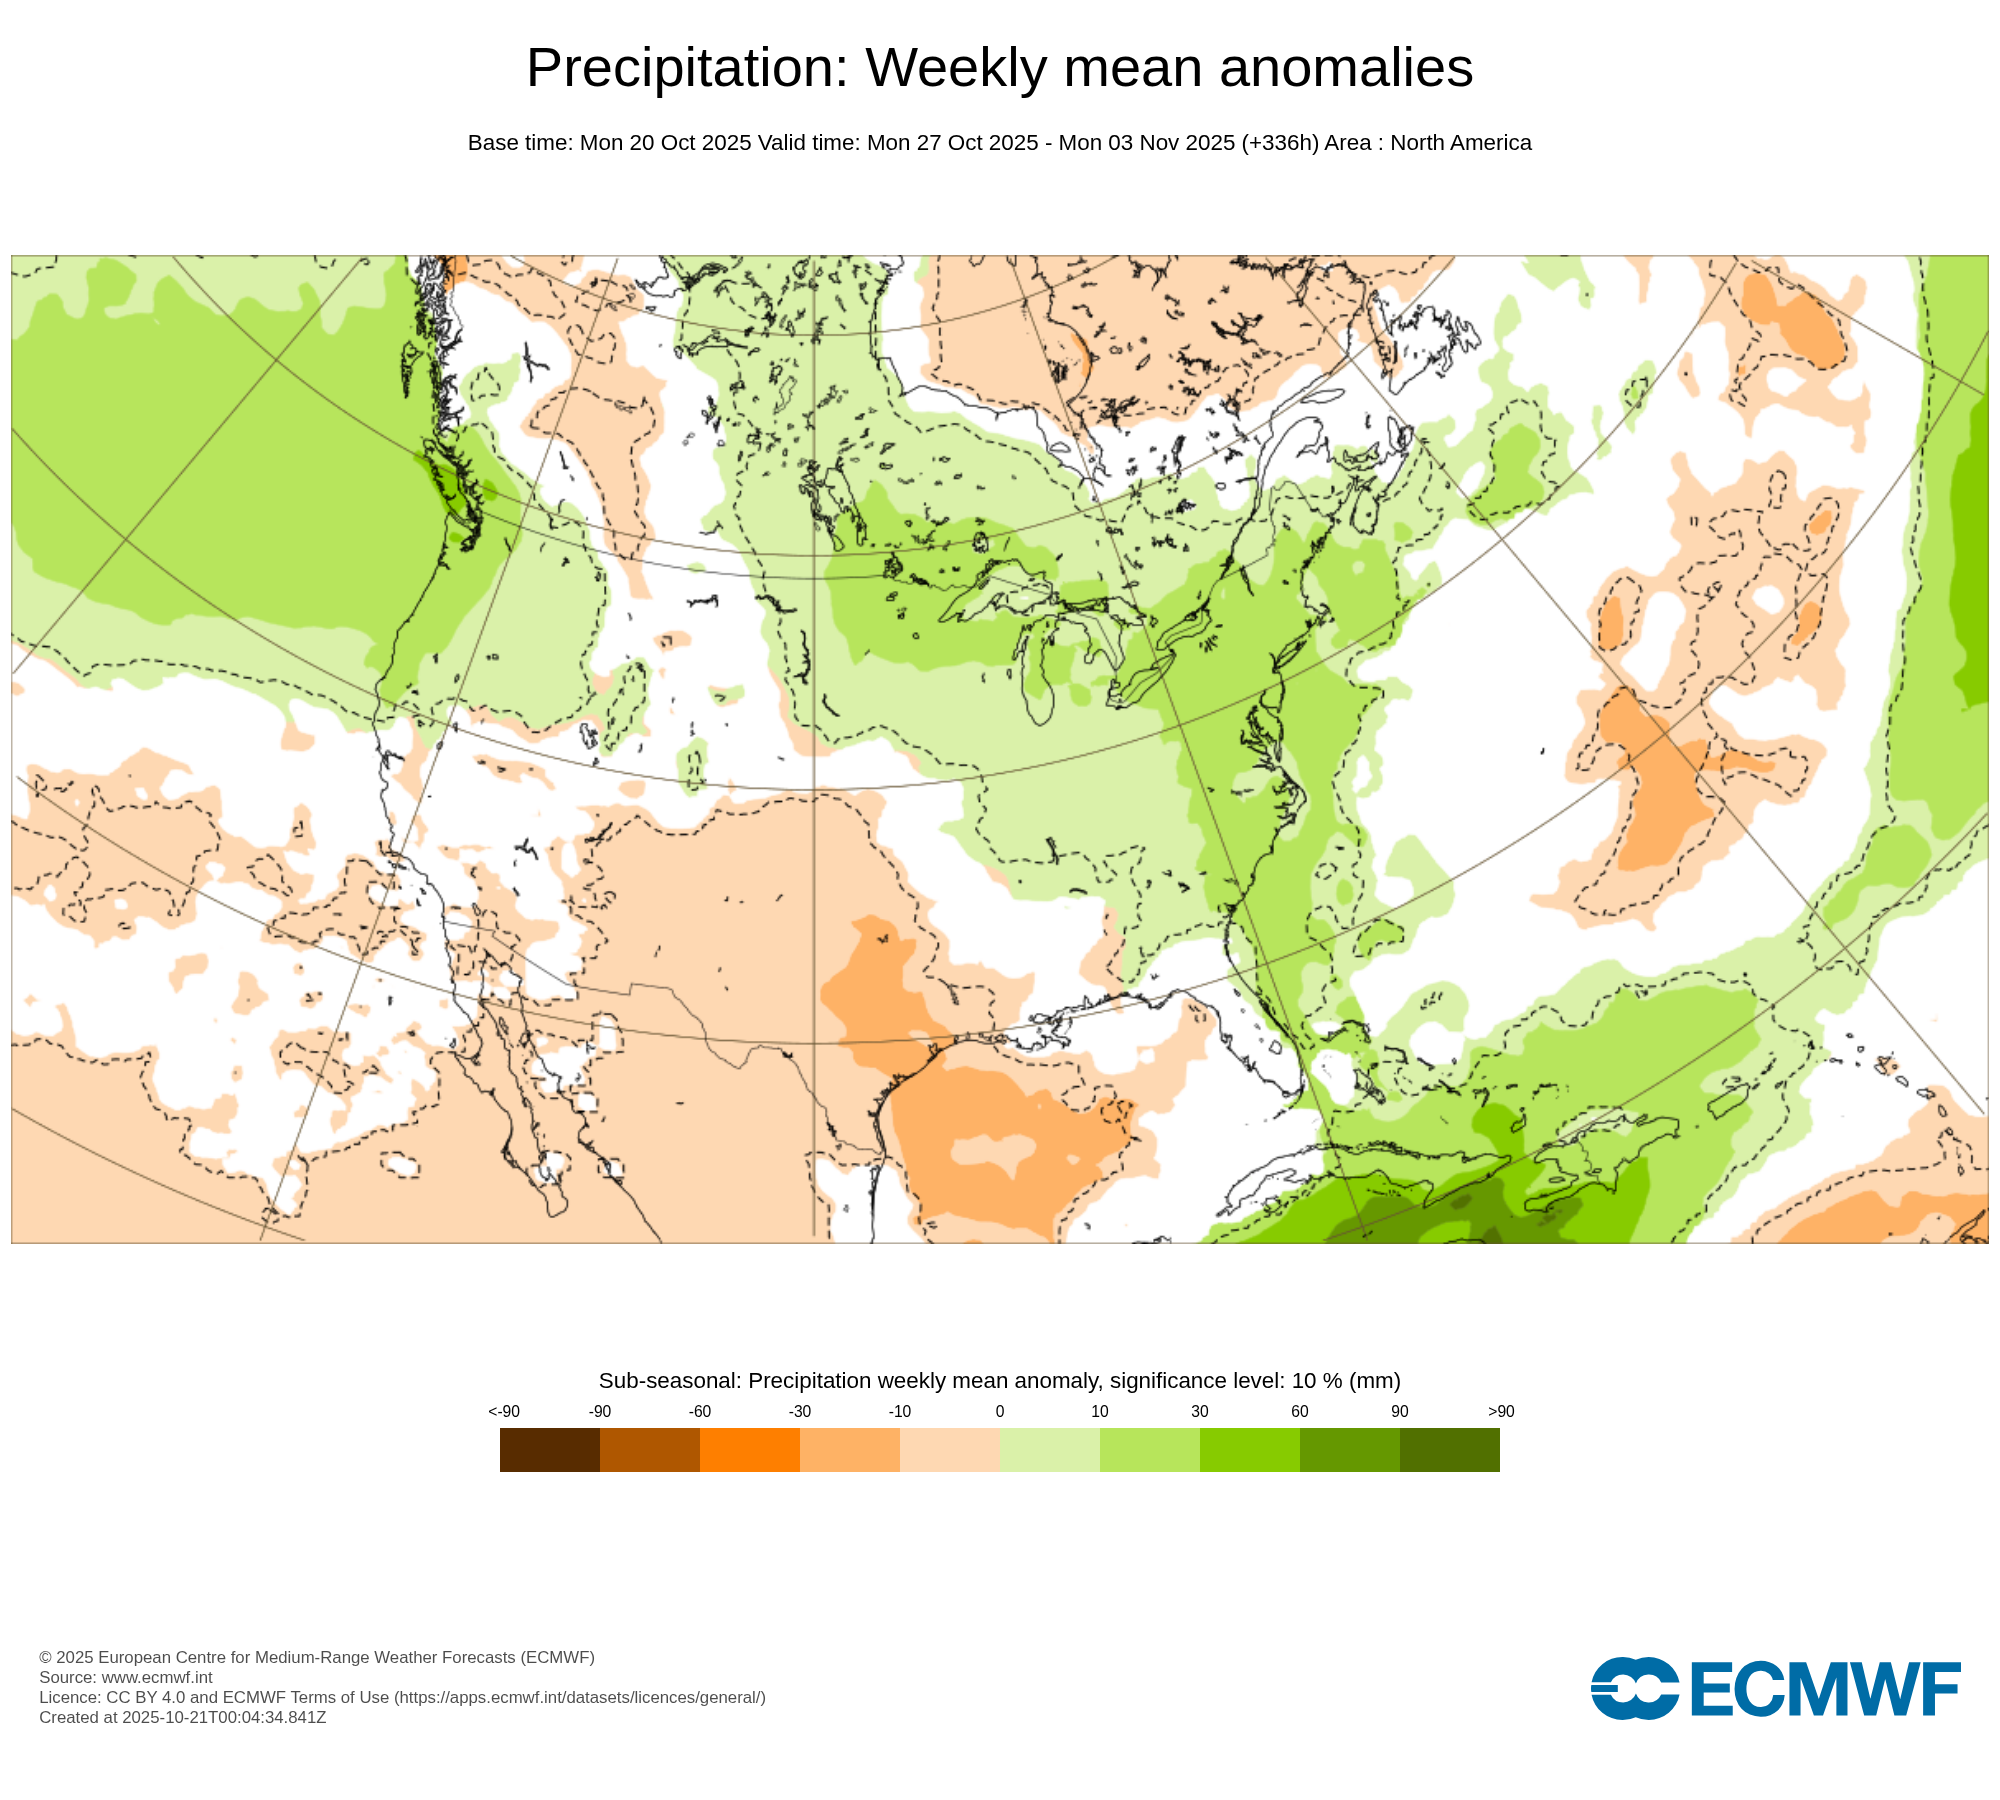
The idea of a potentially wet October 30-November 3 period, perhaps +/- a few days to allow for timing differences at the current forecasting range, still looks to be on track as per the latest ECMWF weekly guidance.

It should be noted that the CFSv2 is still not on board. On the other hand, the 12z ECMWF has insane rainfall amounts in the Middle Atlantic Region.
where exactly is this rain coming from Don?
-
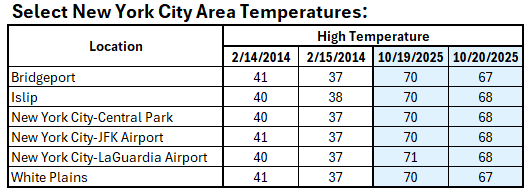
6 hours ago, donsutherland1 said:
Yesterday saw a one-degree difference in high temperatures among Bridgeport, Islip, Central Park, JFK Airport, LaGuardia Airport, and White Plains for the second consecutive day. The last time that happened was February 14-15, 2014.
Today it could hit 70 here
-
5 hours ago, bluewave said:
The worst was when my neighbor back in Long Beach decided to plant running bamboo all around his property. It came under the fence and grew about 15 feet high around my side yard in just a few months. It took me a long time to dig out all the roots since they were starting to climb up the side of my old place. That was the toughest garden challenge that I ever encountered. Long Beach passed some local ordinances against it.
https://patch.com/new-york/longbeach/city-council-votes-to-restrict-bamboo-plantings
Isn't bamboo an invasive species? Why don't people get arrested for doing this crap?
-
4 hours ago, JustinRP37 said:
This literally might be the dumbest f**king thing you have ever said on here and you say a lot of dumb $hit. Our wetlands provide flood control, pollution management, and yes disease regulation. They are some of our most productive systems. I’m sorry but you really need to be 5-posted with posts like this. Hell much of the reason we have awful flooding in the USA is because of how we got rid of so many wetlands…
Out of the box thinking is not *dumb*, just because you're an unimaginative uncreative robot. I've read some of your posts, so I know. The conventional *ideas* that people like you have will NOT get us out of the various crises we face.
It's not *dumb* to want to get rid of places that stink. I'm not talking about getting rid of ALL marshland obviously, just the ones near where people live. You obviously do not live near one. Do you know how bad that area smells in the summer? Most of the who live here want the swamp that runs near Rockaway Boulevard to be drained because it smells so awful that you can smell it even with your windows roll up.
Check yourself, there's plenty of good area for wetlands, but it doesn't have to be near where people live.
You might need a time out, people are allowed to express their opinions.
There are ways around flooding-- INCLUDING IMPROVED DRAINAGE SYSTEMS. There's a lot we can do to fix flooding issues, stop using concrete and asphalt are examples.
Take some Paxil so you can calm the hell down dude.
-
 1
1
-
-
4 hours ago, JustinRP37 said:
If you exterminated mosquitos you’d lose a lot of aquatic life that feed in their larvae. You’d also lose quite a few other species. Bats need mosquitos too. Draining wetlands leads to increased disease spread. Most of the aggressive mosquitos are NOT from swamps and marshes. But they are from stagnant standing water like clogged gutters, untreated pool covers, used tires filled with water inside (hence it is illegal to store tires outside with the inside exposed within nyc).
Bill Gates has the right idea, he has introduced sterile genetically modified mosquitoes that can't breed into Florida to lessen malaria and other diseases that they carry.
So different types of mosquitoes behave differently?
I get rid of standing water right away, it breeds not just mosquitoes but other biting bugs like horseflies and gnats.
October 2025 Discussion and Obs
in New York City Metro
Posted
Wasn't the February 14-15, 2014 occurrence during a snowstorm, Don?