
EastonSN+
-
Posts
6,846 -
Joined
-
Last visited
Content Type
Profiles
Blogs
Forums
American Weather
Media Demo
Store
Gallery
Posts posted by EastonSN+
-
-
7 minutes ago, EastonSN+ said:
Also, as Bluewave has mentioned with the fast PAC jet, faster flow leads to lett time for NS interaction.
Lol, Don/Bluewave, I may have just answered my own question as to why the Delmarva/Norfolk are fairing much better to average than us. The faster PAC flow keeping them north of the storm track.
-
2 minutes ago, EastonSN+ said:
This is what I was referring to w/R/t NS interaction. The northern low is further south and west, allowing for the storm to track a bit north. Still possible, however it's a tricky setup. If the N stream low is further north or east, the storm will exit further south.
Also, as Bluewave has mentioned with the fast PAC jet, faster flow leads to lett time for NS interaction.
-
2 minutes ago, Allsnow said:
This is what I was referring to w/R/t NS interaction. The northern low is further south and west, allowing for the storm to track a bit north. Still possible, however it's a tricky setup. If the N stream low is further north or east, the storm will exit further south.
-
3 minutes ago, donsutherland1 said:
I agree. Warming is just one impact of climate change. Climate change is putting a lot more energy into the system. Volatility (extremes) are growing more frequent. Wave lengths and patterns are being distorted. Even the MJO has been altered, as you noted in point 1, leading to more days in the Marine Continent and generally more warmth in parts of North America.
Thanks. Also, phases 1 and 2 are cold for the east and central plains as we witnessed in January. Perhaps this will be more common given the IO temps. I do fear we are losing 8 though. Water temps do have a limit, so regions 1,2 and 3 will likely "catch up", which is why I do believe we will see more record cold shots, albeit perhaps relatively brief in nature. Central plains more favored in general.
-
 1
1
-
-
2 minutes ago, Allsnow said:
@EastonSN+ what is making you think the MA is favored? I see no evidence of this currently
I am taking models verbatim and I do subscribe, sometimes to my detriment like 14/15, that winters do follow a pattern. We need the NS interaction to bring this north. A little tricky.
-
8 minutes ago, bluewave said:
1998 didn’t have the strong MJO 2 response which helped to drive the brief Arctic outbreak to our west back in January.
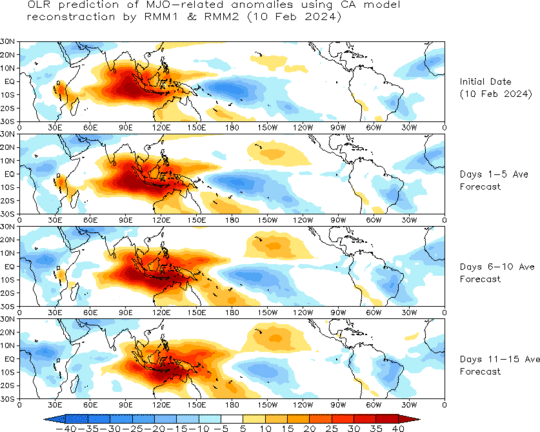
Thanks. Looking at the MJO, it looks like we will see more forcing in this location, likely why the MA is favored again for the next storm. Per the snip below looks like forcing is commencing in 1/2 again.
-
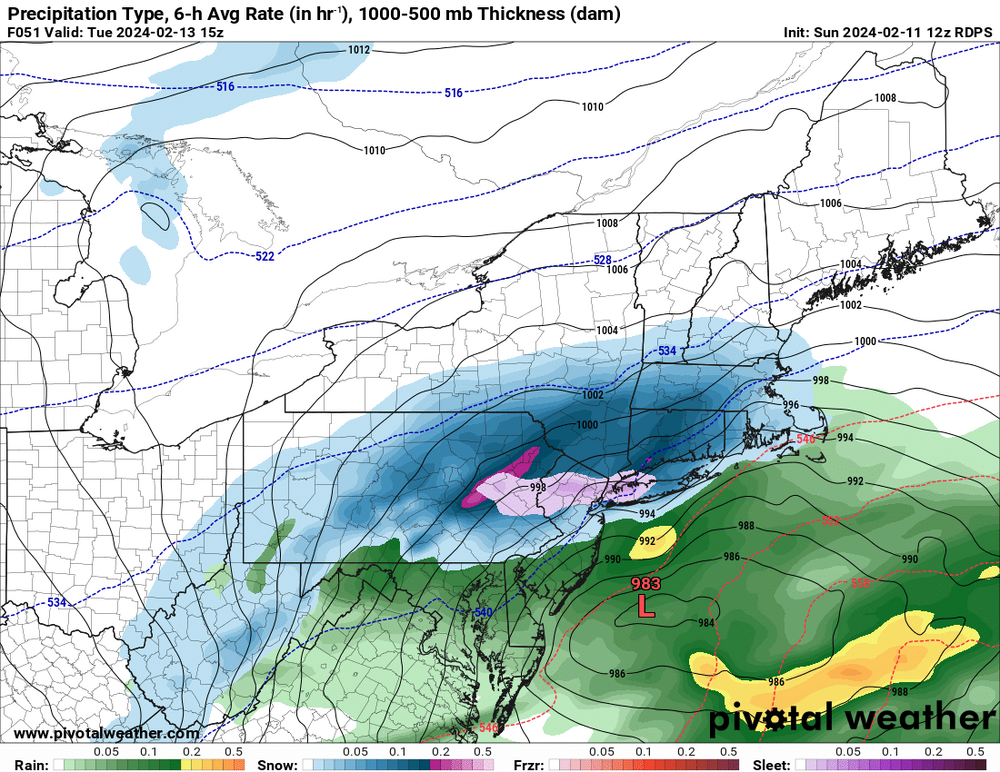
18 minutes ago, SBUWX23 said:
weenies will be surprised at how it will struggle to snow when a 979mb low is 50 miles south of the coast.
Yeah a strong low over the Delmarva/off Atlantic City is never good for our area. See December 1992, EXTREMELY powerful storm over the Delmarva yet mostly rain. We do far better with a storm EXITING the Delmarva moving east northeast. Not our setup unfortunately. Still have a shot at some snow as the ow deepens and moves east.
-
Just now, bluewave said:
Through February 10th we have been running a few degrees warmer than 1998. Plus we have had a stronger ridge and weaker trough response over North America. Makes sense with the forcing much further west than 1998.
Time Series Summary for NY CITY CENTRAL PARK, NY
Click column heading to sort ascending, click again to sort descending.RankEnding DateMean Avg Temperature Dec 1 to Feb 10Missing Count1 2016-02-10 42.4 0 2 2002-02-10 41.6 0 3 1932-02-10 41.3 0 4 2024-02-10 41.0 0 5 2023-02-10 40.4 0 - 2012-02-10 40.4 0 6 1991-02-10 39.8 0 7 1950-02-10 39.6 2 8 2020-02-10 39.3 0 9 1998-02-10 39.1 0
Stronger ridge and weaker trough than 1998 with forcing much further west


Thanks, is this difference also why the MA is doing better with snowfall than 1998 this Year? That year we had no hope at all, yet this year they may receive another event next week. Something else caused 1998 to be far less snowy than this year down there. Is the faster flow allowing them to stay on the colder side?
-
11 hours ago, donsutherland1 said:
No surprise. One needs to adjust for climate change. One also has to consider how marine heatwaves can distort patterns e.g., this could be the first strong El Niño event during which the PDO was negative in all three winter months. Ignoring such changes leaves one with a forecasting framework that is obsolete and often useless.
Thanks Don,
This is true, however, I fear that while we focus on the current anomolies we may not be contemplating future change as well. The one constant in life and weather is chang.
1.) IO temperatures are warming extremely fast. This will be MJO 1,2 and 3. Will this offset forcing in 4,5,6. Or will this provide us with another new setup?
2.) We witnessed the "blob" off the west coast which greatly affected 13 through 15. What caused that and will it happen again? The PAC jet cut the PNA repeatedly the last 2 years, however, what if we see the return off the west coast?
3.) What is causing the Delmarva/Norfolk to continue to receive snow while we do not? Does this current environment favor them? Faster jet=faster flow therefore when it's cold enough storms do not have time to climb the coast (they do not warm and change)?
4.) If the aforementioned is true and the PAC jet is screaming, why are we still seeing very powerful cutters? Why is the fast PAC allowing it cutters? Why not huggers or coastals?
5.) What worked right in 00/01 to allow for a KU in Feb and a borderline KU earlier that December? One would think this is impossible given last 2 years, however it did work out. That is obviously still possible, perhaps more often as well?
IMO climate change is more than just "everything is warmer", but rather "increased volatility". Therefore, by nature temperatures from a day to day perspective will be volatile as well, meaning more powerful cold shots (like we just witnessed will the record cold out west) as well as more powerful storms, both tropical and extra tropical. Coastal NC was hammered 2 years ago, perhaps this will also be more common.
-
2
-
-
20 minutes ago, bluewave said:
Most overpowering STJ into the Baja and SOCAL to start February since 1998.


Yeah, and Don referenced "the elephant in the room" before the season began, referring of course to 1998. Unfortunately here we are. Although, the Middle Atlantic has performed much better than us this year.
-
-
Heat island effect lol
-
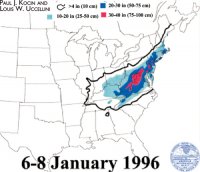
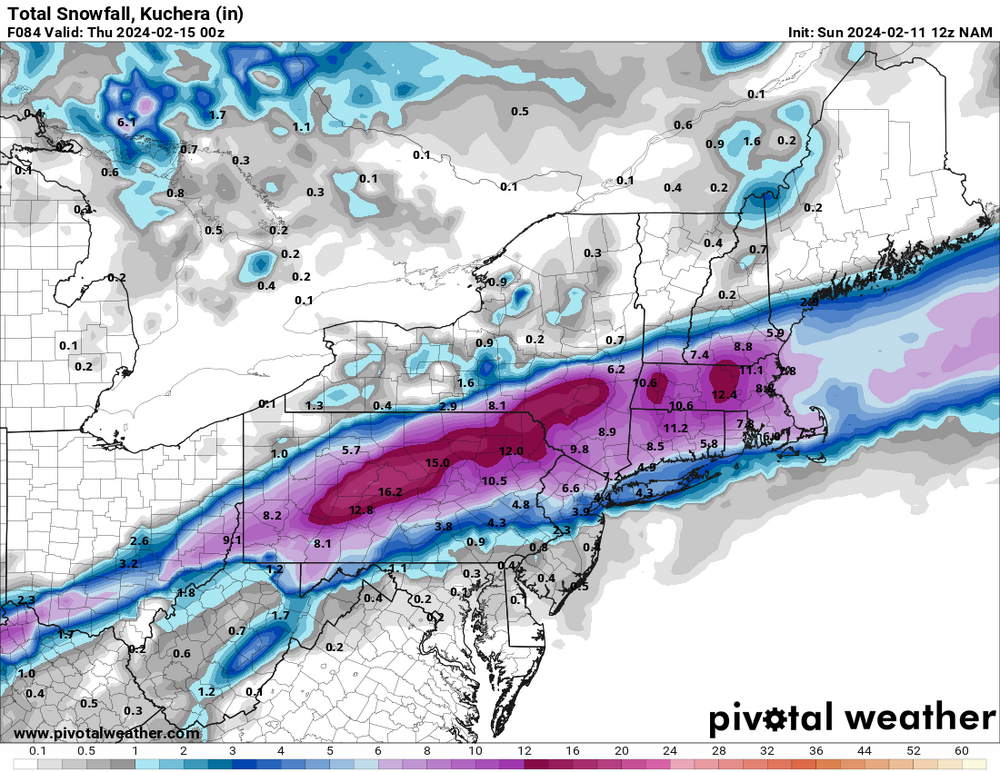
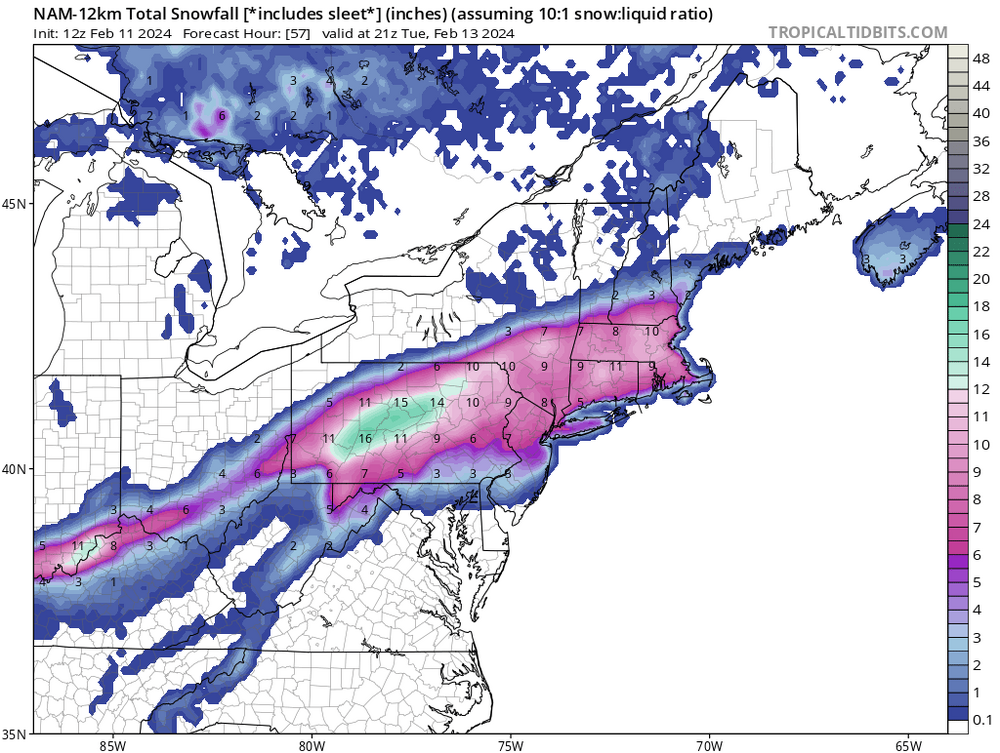
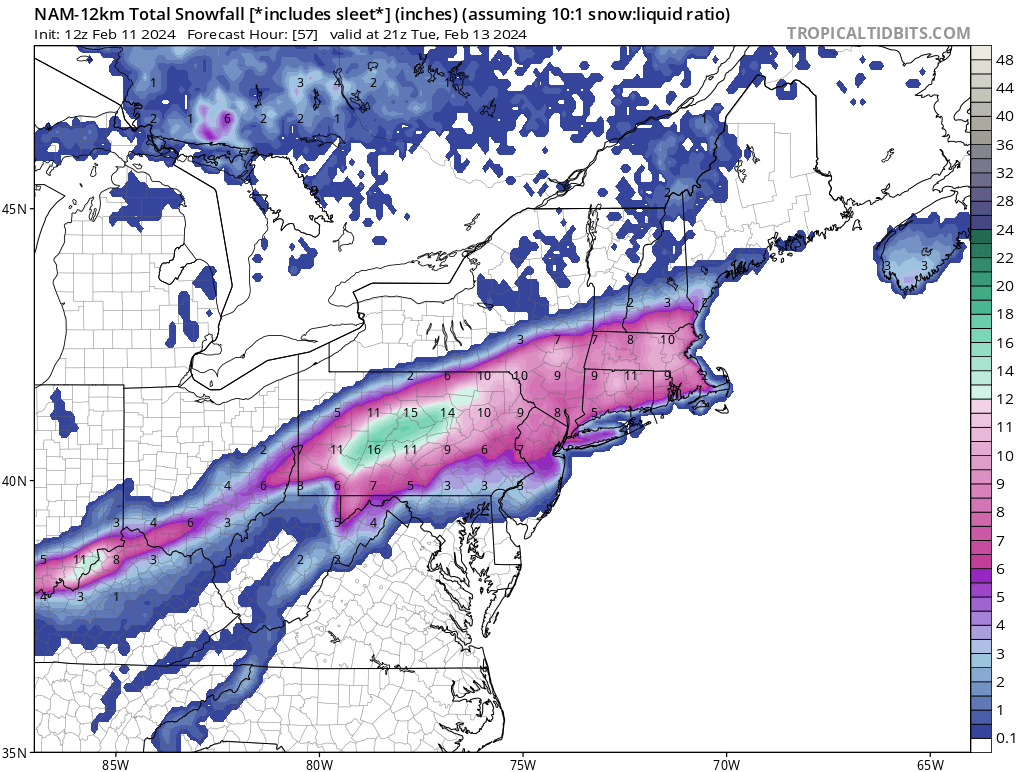
5 minutes ago, forkyfork said:
there's a very important phrase in that map's title
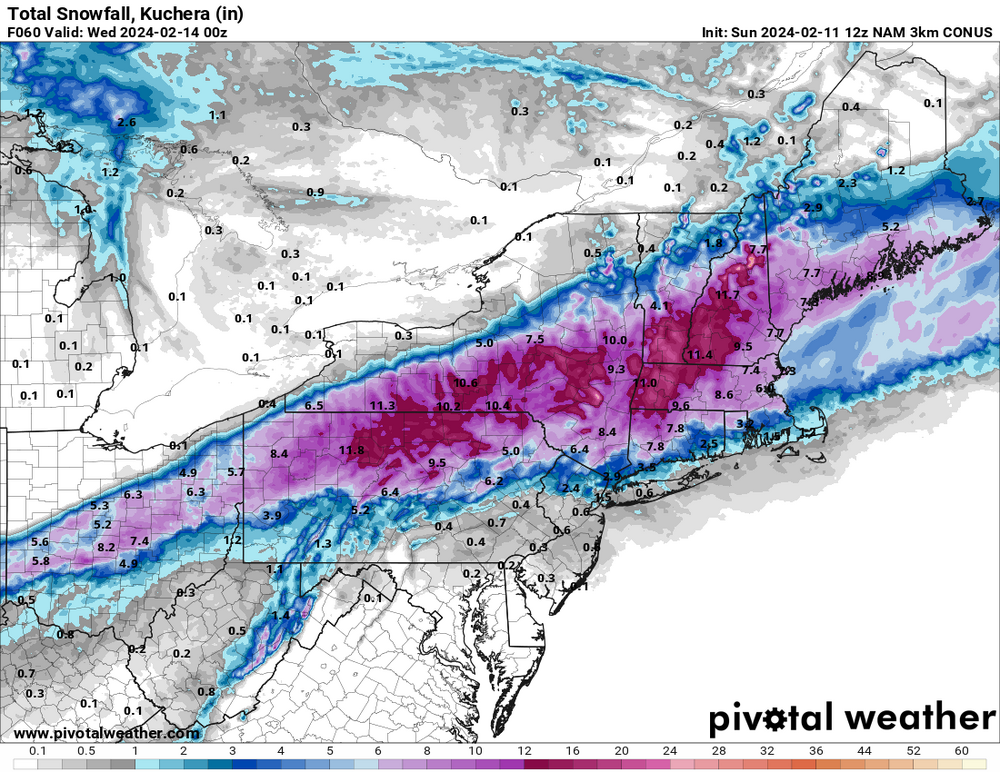
Yeah I was lazy, here is Kuchera. Would be best case for CPK and LI.
-
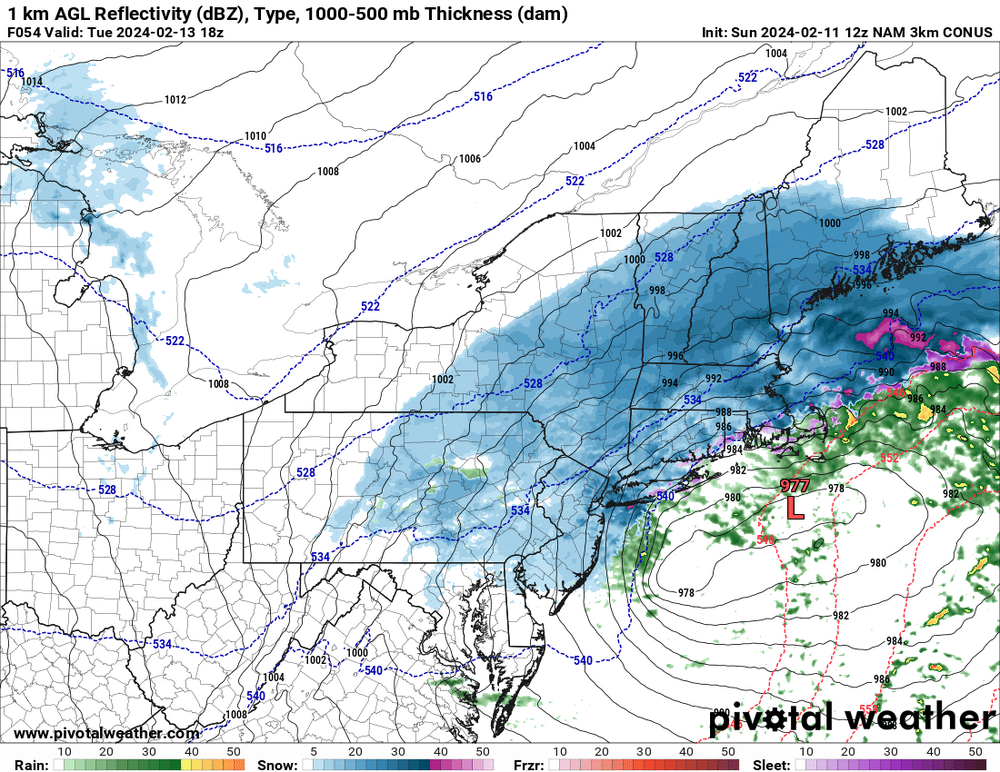
11 minutes ago, SnowGoose69 said:
3K is bad though, even for places like BDL for a time...that said the 3K does suck until inside 30, the 12K can usually begin to be reliable to a degree inside 48...I still doubt we'd see this dip south enough as far ML low track to see anything more than 1 inch near NYC...if this was moving slower its likely we'd actually be able to see something as everything crashed behind the departing low but its moving so darn fast that is not really realistic
Yeah I saw that. I think it comes down to the back end. How much is left and how much does the low deepen. I literally live 1.5 miles north of the Merritt lol.
-
12 k was colder and snowier than 3k south of 84 FWIW.
-
NAM a bit colder and snowier FWIW.
-
1
-
 1
1
-
-
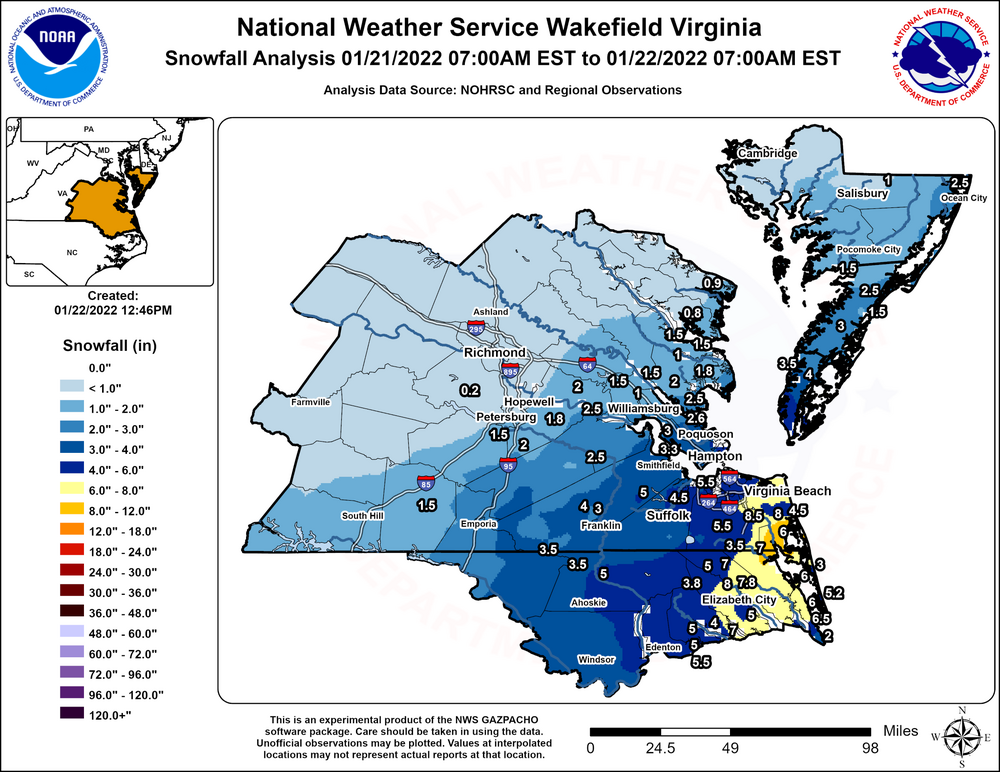
52 minutes ago, SBUWX23 said:
Snow may be a thing of the past for NYC and Long Island. Category 6 storms but no snow.
Lol don't worry, just take a 4 hour drive south to the Delmarva they are above average snowfall for last few years. Heck even coastal North Carolina got hammered one storm.
-
46 minutes ago, Sey-Mour Snow said:
GEFS with another good bump nw.. south ct crew with toasters on stand bye
Yeah not feeling this one down here.
-
3 hours ago, bluewave said:
We are going to need to see some improvements during the rest of the 2020s for NYC to stay out of the cardinal decade snowfall basement since the 1950s.
Monthly Total Snowfall for NY CITY CENTRAL PARK, NY
Click column heading to sort ascending, click again to sort descending.YearOctNovDecJanFebMarAprSeasonMean 0.0 T 2.6 4.4 6.0 0.1 T 13.2 2023-2024 0.0 T T 2.3 0.0 M M 2.3 2022-2023 0.0 0.0 T T 2.2 0.1 0.0 2.3 2021-2022 0.0 T 0.2 15.3 2.0 0.4 0.0 17.9 2020-2021 0.0 0.0 10.5 2.1 26.0 T 0.0 38.6 2019-2020 0.0 0.0 2.5 2.3 T T T 4.8
Monthly Total Snowfall for NY CITY CENTRAL PARK, NY
Click column heading to sort ascending, click again to sort descending.YearOctNovDecJanFebMarAprSeasonMean 0.3 1.1 5.3 12.9 11.8 6.0 0.6 37.9 2018-2019 0.0 6.4 T 1.1 2.6 10.4 0.0 20.5 2017-2018 0.0 T 7.7 11.2 4.9 11.6 5.5 40.9 2016-2017 0.0 T 3.2 7.9 9.4 9.7 0.0 30.2 2015-2016 0.0 0.0 T 27.9 4.0 0.9 T 32.8 2014-2015 0.0 0.2 1.0 16.9 13.6 18.6 0.0 50.3 2013-2014 0.0 T 8.6 19.7 29.0 0.1 T 57.4 2012-2013 0.0 4.7 0.4 1.5 12.2 7.3 0.0 26.1 2011-2012 2.9 0.0 0.0 4.3 0.2 0.0 0.0 7.4 2010-2011 0.0 T 20.1 36.0 4.8 1.0 T 61.9 2009-2010 0.0 0.0 12.4 2.1 36.9 T 0.0 51.4
Monthly Total Snowfall for NY CITY CENTRAL PARK, NY
Click column heading to sort ascending, click again to sort descending.YearOctNovDecJanFebMarAprSeasonMean T T 6.6 7.2 10.1 3.5 0.5 28.0 2008-2009 0.0 T 6.0 9.0 4.3 8.3 T 27.6 2007-2008 0.0 T 2.9 T 9.0 T 0.0 11.9 2006-2007 0.0 0.0 0.0 2.6 3.8 6.0 T 12.4 2005-2006 0.0 T 9.7 2.0 26.9 1.3 0.1 40.0 2004-2005 0.0 T 3.0 15.3 15.8 6.9 0.0 41.0 2003-2004 0.0 0.0 19.8 17.3 0.7 4.8 0.0 42.6 2002-2003 T T 11.0 4.7 26.1 3.5 4.0 49.3 2001-2002 0.0 0.0 T 3.5 T T T 3.5 2000-2001 T 0.0 13.4 8.3 9.5 3.8 0.0 35.0 1999-2000 0.0 0.0 T 9.5 5.2 0.4 1.2 16.3
Monthly Total Snowfall for NY CITY CENTRAL PARK, NY
Click column heading to sort ascending, click again to sort descending.YearOctNovDecJanFebMarAprSeasonMean 0.0 0.8 3.0 6.1 8.7 5.7 0.1 24.4 1998-1999 0.0 0.0 2.0 4.5 1.7 4.5 0.0 12.7 1997-1998 0.0 T T 0.5 0.0 5.0 0.0 5.5 1996-1997 0.0 0.1 T 4.4 3.8 1.7 T 10.0 1995-1996 0.0 2.9 11.5 26.1 21.2 13.2 0.7 75.6 1994-1995 0.0 T T 0.2 11.6 T T 11.8 1993-1994 0.0 T 6.9 12.0 26.4 8.1 0.0 53.4 1992-1993 0.0 0.0 0.4 1.5 10.7 11.9 0.0 24.5 1991-1992 0.0 T 0.7 1.5 1.0 9.4 T 12.6 1990-1991 0.0 0.0 7.2 8.4 9.1 0.2 0.0 24.9 1989-1990 0.0 4.7 1.4 1.8 1.8 3.1 0.6 13.4
Monthly Total Snowfall for NY CITY CENTRAL PARK, NY
Click column heading to sort ascending, click again to sort descending.YearOctNovDecJanFebMarAprSeasonMean T 0.1 2.3 7.9 5.4 3.0 1.0 19.7 1988-1989 0.0 0.0 0.3 5.0 0.3 2.5 0.0 8.1 1987-1988 0.0 1.1 2.6 13.9 1.5 T 0.0 19.1 1986-1987 0.0 T 0.6 13.6 7.0 1.9 0.0 23.1 1985-1986 0.0 T 0.9 2.2 9.9 T T 13.0 1984-1985 0.0 T 5.5 8.4 10.0 0.2 T 24.1 1983-1984 0.0 T 1.6 11.7 0.2 11.9 0.0 25.4 1982-1983 0.0 0.0 3.0 1.9 21.5 T 0.8 27.2 1981-1982 0.0 0.0 2.1 11.8 0.4 0.7 9.6 24.6 1980-1981 0.0 T 2.8 8.0 T 8.6 0.0 19.4 1979-1980 T 0.0 3.5 2.0 2.7 4.6 T 12.8
Monthly Total Snowfall for NY CITY CENTRAL PARK, NY
Click column heading to sort ascending, click again to sort descending.YearOctNovDecJanFebMarAprSeasonMean T 0.3 2.0 8.0 9.9 2.3 0.1 22.5 1978-1979 0.0 2.2 0.5 6.6 20.1 T T 29.4 1977-1978 0.0 0.2 0.4 20.3 23.0 6.8 T 50.7 1976-1977 0.0 T 5.1 13.0 5.8 0.6 T 24.5 1975-1976 0.0 T 2.3 5.6 5.0 4.4 T 17.3 1974-1975 0.0 0.1 0.1 2.0 10.6 0.3 T 13.1 1973-1974 0.0 0.0 2.8 7.8 9.4 3.2 0.3 23.5 1972-1973 T T T 1.8 0.8 0.2 T 2.8 1971-1972 0.0 T T 2.8 17.8 2.3 T 22.9 1970-1971 0.0 0.0 2.4 11.4 T 1.3 0.4 15.5 1969-1970 0.0 T 6.8 8.4 6.4 4.0 T 25.6
Monthly Total Snowfall for NY CITY CENTRAL PARK, NY
Click column heading to sort ascending, click again to sort descending.YearOctNovDecJanFebMarAprSeasonMean T 0.4 8.3 7.1 10.1 6.1 0.1 32.0 1968-1969 0.0 T 7.0 1.0 16.6 5.6 0.0 30.2 1967-1968 0.0 3.2 5.5 3.6 1.1 6.1 0.0 19.5 1966-1967 0.0 0.0 9.1 1.4 23.6 17.4 T 51.5 1965-1966 T 0.0 T 11.6 9.8 T 0.0 21.4 1964-1965 0.0 0.0 3.1 14.8 2.5 2.8 1.2 24.4 1963-1964 0.0 T 11.3 13.3 14.1 6.0 T 44.7 1962-1963 T T 4.5 5.3 3.7 2.8 T 16.3 1961-1962 0.0 T 7.7 0.6 9.6 0.2 T 18.1 1960-1961 T 0.0 18.6 16.7 18.2 1.2 T 54.7 1959-1960 0.0 0.5 15.8 2.5 1.9 18.5 0.0 39.2
Monthly Total Snowfall for NY CITY CENTRAL PARK, NY
Click column heading to sort ascending, click again to sort descending.YearOctNovDecJanFebMarAprSeasonMean 0.1 0.5 3.3 4.8 4.0 6.2 1.0 19.9 1958-1959 0.0 T 3.8 1.5 0.4 6.7 0.6 13.0 1957-1958 0.0 T 8.7 9.2 10.7 15.9 0.2 44.7 1956-1957 0.0 T 0.9 8.9 7.0 2.6 2.5 21.9 1955-1956 0.0 1.0 3.3 1.2 2.7 21.1 4.2 33.5 1954-1955 0.0 T 0.1 2.6 5.2 3.6 0.0 11.5 1953-1954 0.0 2.2 T 12.7 0.5 0.1 0.3 15.8 1952-1953 0.5 1.7 7.5 4.1 0.4 0.9 T 15.1 1951-1952 0.0 T 3.3 6.2 2.8 7.4 0.0 19.7 1950-1951 0.0 T 3.8 0.9 1.9 2.7 0.0 9.3 1949-1950 0.0 0.5 1.3 0.4 8.5 1.4 1.9 14.0 I always take decadal stats from 0, i.e. 00/01, 10/11, 20/21, which would put this decade at 15.275. still bad but a bit better.
-
Just now, jm1220 said:
Thing is unfortunately next time will trend north too and screw us. Disaster of a winter that can’t end soon enough. Nice mild day today at least.
Maybe, winters tend to have a theme. Hopefully next year is our next 20/21.
-
3
-
-
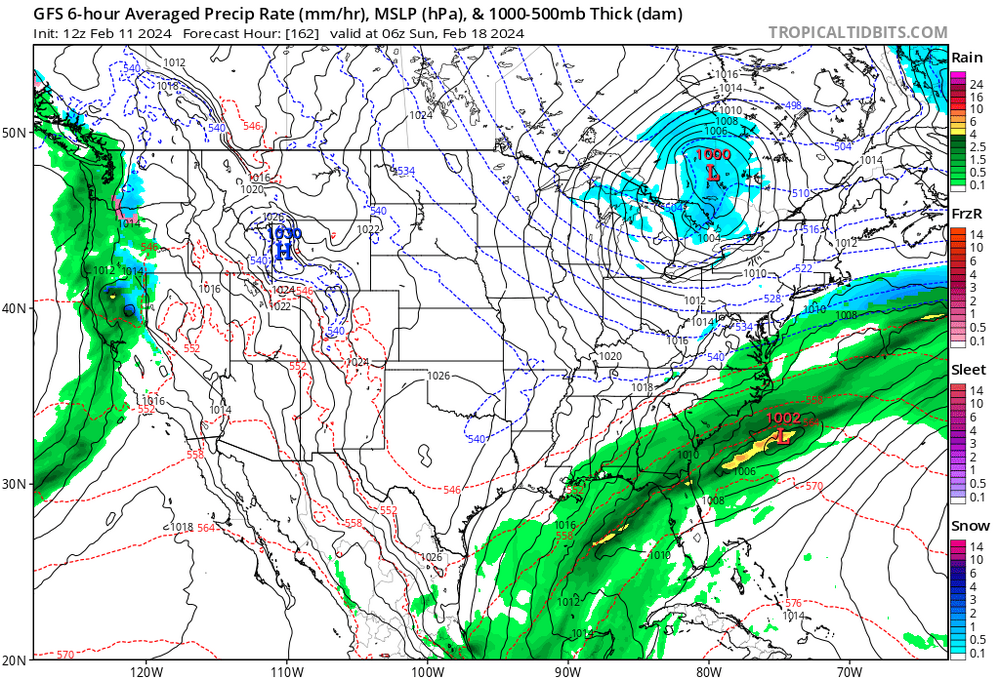
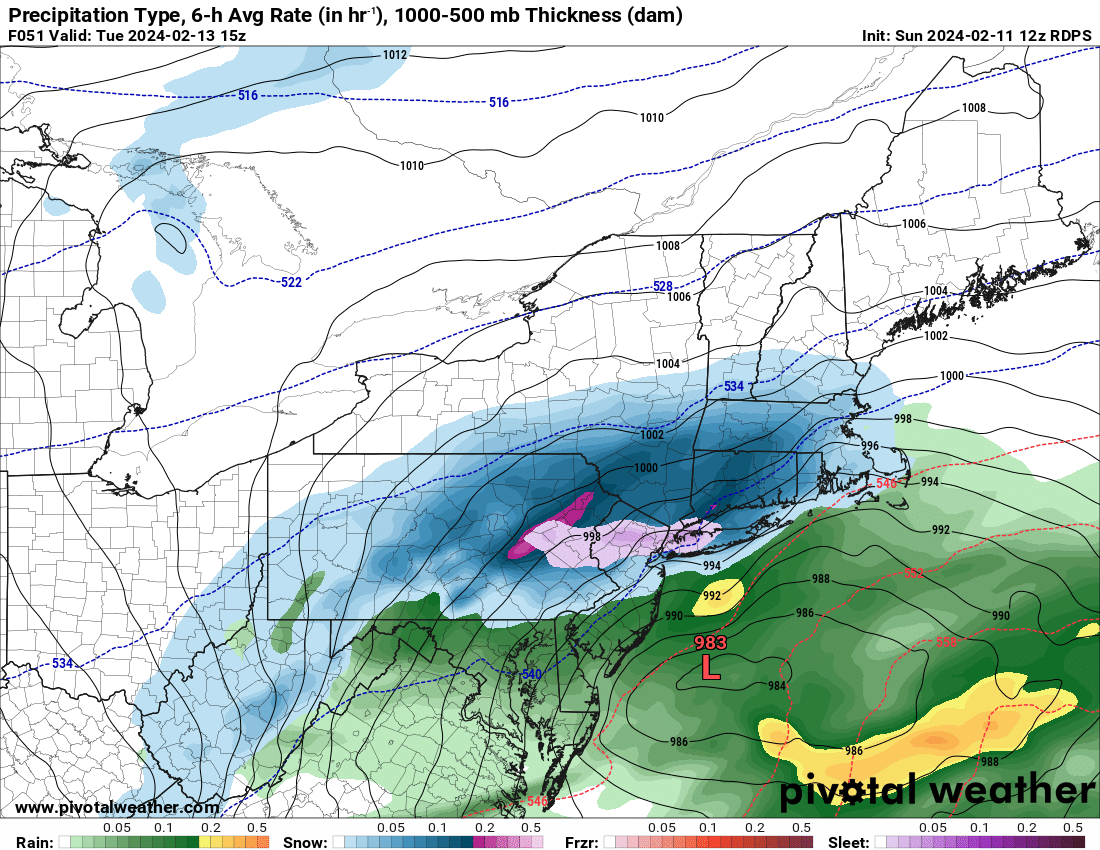
7 minutes ago, RUNNAWAYICEBERG said:
More phasing. Deeper and colder. Smashing incoming…
Kind of a big cut back for coastal plain.
-
1
-
-
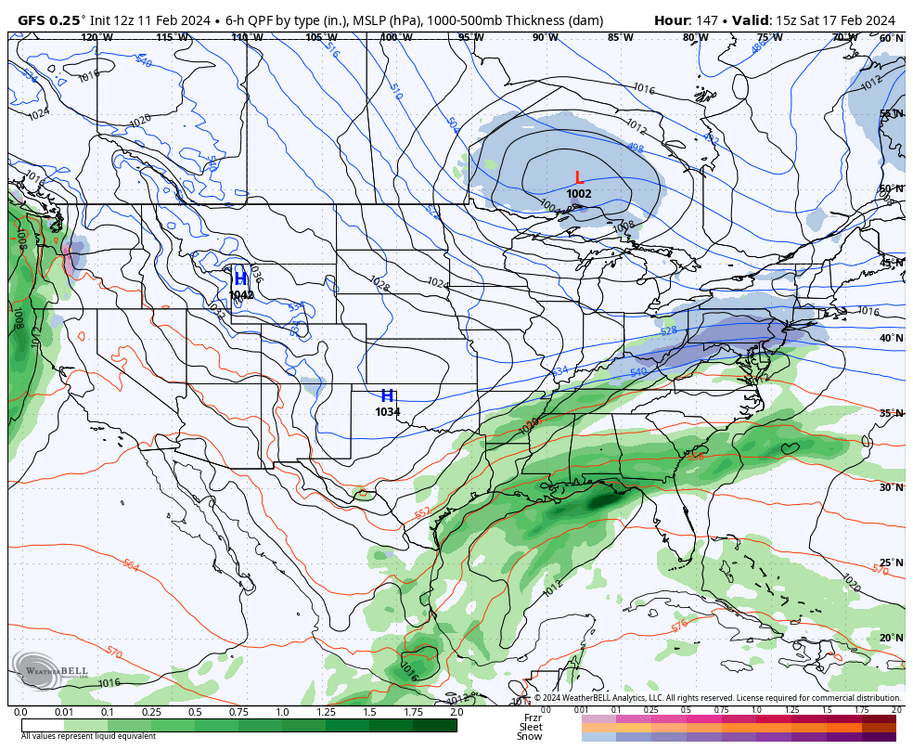
2 minutes ago, MJO812 said:
Euro north
Done
If it does not work out we will get em next time.
-
3 minutes ago, Brian5671 said:
It's been hard to get that vaunted 8-1-2 run so I'm a bit skeptical right now.
We had a high amplitude 1, 2 and 3 in January.
The IO temps are rising fast which will increase 1,2 and 3.
-
Just now, Brian5671 said:
COD could be doable. If it pops out into 4 then it's going to be rough sailing. The Jan pop into 4-5-6 at high amplitude gave us this 3 week nationwide torch
It's going to go through 1,2 and 3.


February 2024
in New York City Metro
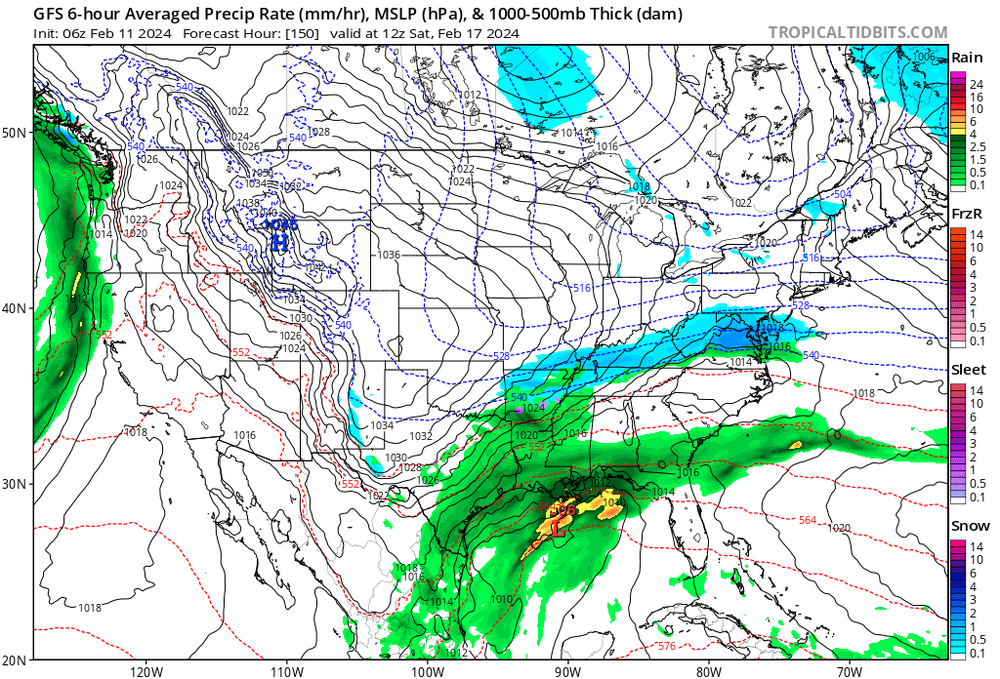
Posted
Yup, that's why I mentioned that there is more N/S interaction on this run, however need to see that continue and other models to match on. However, if the fast PAC theory is correct the southern low will escape east. This is a good test to the fast PAC theory (i.e. can we still get N/S interaction).