
EastonSN+
-
Posts
7,917 -
Joined
-
Last visited
Content Type
Profiles
Blogs
Forums
American Weather
Media Demo
Store
Gallery
Posts posted by EastonSN+
-
-
1 minute ago, Allsnow said:

Thanks HUGE gradient between BDR and Greenwich

-
1 hour ago, Hoth said:
Amazing echoes of last winter. Another dud December/Jan, same fake out by the modeling for an epic pattern in the back half of January. Modoki goes in the fraud five if this season winds up where '19 did.
I can't believe I had more snow by this time in 11/12.
One positive. If this winter follows last we will have another 11.5 inches in March
-
3 minutes ago, Allsnow said:
Final call
KNYC 2
KEWR 3
KLGA 1.5
KJFK .9
KBDR 4
I actually agree with those 100%.
Do u have the 6z EURO?
-
18 degrees. Local station said only 1 to 3.
-
1 hour ago, wdrag said:
Good Saturday morning everyone (Jan 18). This is an mPING day. Should produce some accumulation for our entire forum area.
I've added some ensemble products as self checks against big amounts... the questions I have...ultimate water equivalent QPF and does it sleet in a marginally thermal column late today, or does upward motion, compensate to produce 1/2S at 5-6PM. I've opted for the snow-sleet=trim amounts scenario for my own area of interest (I84 corridor of ne PA/nw NJ). The EC Kuchera is rather robust in the Poconos/nw NJ and as is the Experimental HRRR. I am definitely concerned about sleet...already sleeting (mPING) where one might have thought it be snowing in w MD. It will be hazardous at times this afternoon-evening on all surfaces up here nw NJ and se NYS. Ground too cold and air temps I do not think can rise as fast as modeled away from LI. So the first 3 graphics are NWS ensemble chances of 1+, 2+ and 4+ inches. Then the EPS prob courtesy Weather.US, for 3+ inches which continues uncertainty nw NJ but favors 3+ with its ~80% probs. Finally the 06z HRRRX variable density product and these amounts look a little too high to me.... I could see this would be possible if ALL snow. So my confidence in an all snow situation til 02z is below average for nw NJ and ne PA. Hope I'm wrong. 658A/18


Thanks. Just one of those years nothing goes our way.
-
 1
1
-
-
18z euro snow map is in New England thread.
-
14 minutes ago, donsutherland1 said:
Below are the 500 mb maps (GEFS forecast and February 1-10, 1992):
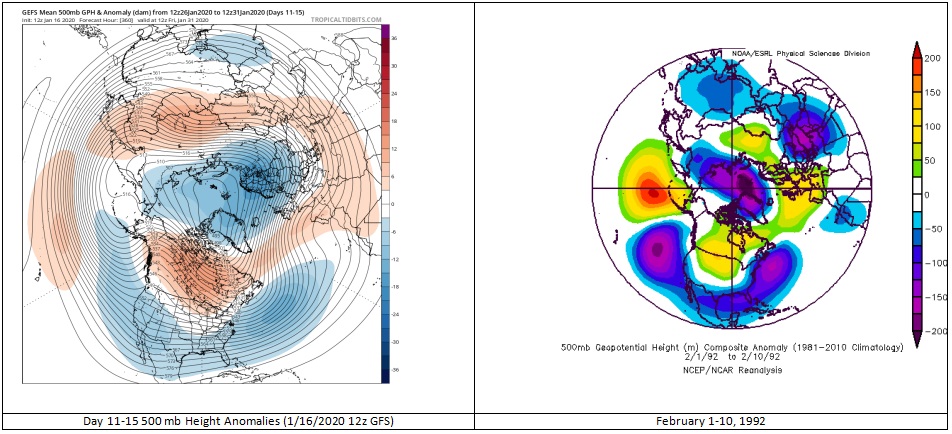
During February 1-10, 1992 the MJO was in Phase 1 (low amplitude by February 4). By February 12, it moved into Phase 4, quickly attaining an amplitude of 1.000 or above. For much of the rest of the month, it was locked between Phases 4 and 5.
The February 1-15 mean temperature in New York City was 30.9° and in Philadelphia it was 32.5°. The February 16-29 mean temperature in New York City was 42.2° and in Philadelphia it was 42.9°.
For now, this outcome should be seen as a potential alternative scenario should a colder pattern fail to take hold. The evolution of the teleconnections and progression of the MJO will provide insight.
If I remember correctly, March was quite snowy (unless that was 91).
-
1
-
-
2 minutes ago, Snow88 said:
Weeklies?
Probably in the panic thread
")
-
1
-
 1
1
-
-
8 minutes ago, PB-99 said:
OMG dude, If you go from plus 15 to minus 5 in late Jan, do you not realize what a major flip that is ?
Your N splits are 38 / 28 , so you go from 53 / 43 to 33 /23 with a trough in the means where the ridge was for 30 days and a great 500 with a " potential " stormy look.
That`s a major flip.
There`s no warmth coming back at all, you will prob see 3 days of 40 +degree highs due to a ridge extending out of Canada in response to an AAM spike. Do you know what that ridge is ? It`s your Hudson Bay block for what`s coming.
It is what you will need to get 1 or 2 snowstorms in the pattern. Because that`s the risk with that 500. HB blocking with the trough cutting underneath. You couldn`t ask for anything more and that look was being set up here while others were certain the ridge would not be kicked out.
It is the look you want and that is what I always believed the set up would look.
To your point the teles now look good.
Nao going negative as well as AO.
-
1
-
-
2 hours ago, Ginx snewx said:
Unreadable
I agree with you
-
1
-
-
21 minutes ago, Spanks45 said:
Its going to be 2016 all over again, the GFS at 18z gives me flashbacks....No snow, followed by a monster storm just to our south, that would push many off the edge, lol
I actually reached climo that season partially due to that storm. 4 storms in a 3 week stretch. Then a 3 incher in mid March. Other than that winter non existent
-
4 minutes ago, NorEastermass128 said:
Indices overload!
I know they are coming out if the woodwork. Now one that's named after a baseball player award. Probably went negative with all the cheating issues in baseball.
-
4 minutes ago, frd said:
I need to study about the - MVP, first I heard about this. Another wrinkle in my expectations.
Not enough time in the day. So much data.
Maybe Bob or psu know.
No idea what it means stole from another forum. Perhaps Mets in this board know of the -mvp.
-
 1
1
-
-
56 minutes ago, bluewave said:
You can see the models adjusting milder around the 25th now that they have such a strong AAM rise. This is occurring as the record MJO enters the Western Pacific phases. We are getting a very strong WWB with this and a more El Niño looking regime. The stronger ridge building into SE Canada around the 25th is part of this pattern.


Great discussion by Bluewave on the shorter term warm up.
-
11 minutes ago, ineedsnow said:
18z GEFS are ugly!!
Agreed and the end of the run looks bad for the first time. It has to be wrong with the MJO heading to 781. No negative EpO.
-
3 minutes ago, NorEastermass128 said:
H5 looks good though!
I thought that but looking at the temps they torch as the blocking in Canada drops south. It's really weird but it's on all the ensembles. Should say 850 temps.
https://www.tropicaltidbits.com/analysis/models/?model=ecmwf-ens®ion=us&pkg=z500a
-
Every low on this run pretty much tracks right over New England. We need some blocking
-
3 minutes ago, Dan76 said:
Hopefully this changes
Looks like a rainy version of NEMO 2013.
-
1 hour ago, Ji said:
Taken from MA forum. You have to laugh at this point.
-
For some reason I cannot attach anymore.Yesterday showed epo pretty negative
-
Just lost the negative EPO on the GEFS charts.
-
Just now, Brian5671 said:
Even if so, what an amazing run, 12 years without a below normal couplet. I had thought BDR was close to normal last year after the March snows brought us up but if we did finish below it was just below.
Agreed. That that was the only back to back below average snowfall this century!
-
Wow what a bad morning.
All the teleconnections went in the wrong direction and the MJO now not moving to phase 8.
Hopefully just a blip.
-
 1
1
-
-
10 minutes ago, donsutherland1 said:
Morning thoughts...
The GEFS and GEFS bias-corrected MJO forecasts have retreated somewhat from a scenario where the MJO moves into Phase 8 in the extended range. However, the extended range of the MJO forecasts does not exhibit high skill, though a trend away from Phase 8 would need to be watched should it develop.
The historical evidence from the MJO's reaching Phase 4 and Phase 5 at amplitudes of 1.500 or above during January 5-20 strongly argues that the MJO will move into Phases 7 and 8. That remains the base case.
Newly published research showed that oceanic heat content continued to increase.
https://link.springer.com/content/pdf/10.1007%2Fs00376-020-9283-7.pdf
Interestingly enough, the long-term mean amplitude of the MJO has also increased. The 1980-99 average amplitude was 1.238. The 2000-19 preliminary average was 1.284. During the last 5 years, the preliminary average was 1.326. However, on scales of a decade or less, there can be fluctuations in MJO amplitude due to internal variability e.g., ENSO.
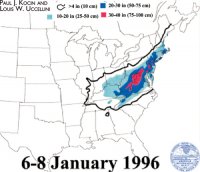
Finally, the upcoming system that will impact the region this weekend continues to look like the kind that has delivered 1"-3"/2"-4" to such cities as Philadelphia, Newark, and New York City in the past. Higher amounts, generally 3"-6" (with some locally higher figures) had occurred to the north and west of those cities and in parts of New England (cities such as Scranton, Binghamton, Albany, and Boston). Lesser amounts occurred to the south and east (cities such as Atlantic City and Islip). The multi-model mean is reasonably consistent with the historic data (1950-2019).
A 1"-3" snowfall would represent a nice increase in seasonal snowfall for Philadelphia (0.1" season-to-date), Newark (5.1" season-to-date), and New York City (2.7" season-to-date).
Thanks Don. The way this winter has gone it would be fitting for the wave to die before 8.
I can't believe I am starring at my first back to back below average snowfall winter since 06/07 07/08
-
1
-


January 2020 General Discussions & Observations Thread
in New York City Metro
Posted
Do you think that March will be kind to us similar to last year and most March months this decade?