
EastonSN+
-
Posts
7,917 -
Joined
-
Last visited
Content Type
Profiles
Blogs
Forums
American Weather
Media Demo
Store
Gallery
Posts posted by EastonSN+
-
-
1 minute ago, bluewave said:
The difference back in that era was that we didn’t have the persistent have cutter, hugger, and suppressed Southern Stream storm tracks like since 18-19. We would get clippers dropping south of us for snow. Plus we often get coastal tracks near the BM which weren’t KU events but more moderate events. Then there were the KU years sprinkled in but not of the 2010 to 2018 frequency and magnitude. So we had more options for NYC to get to within the 19” to 29” range which was very common. These days we need a major snowstorm or multiple ones for NYC to approach the 24” to 25” range. So there was more variety to get the job done instead of having to rely exclusively on KU NESIS events since the 1990s.
And I fully believe we will get back to clippers dropping South and get three to six four to eight snow storms at some point again. From 2000 to 2018 this board was actually discussing how the coastal hugger was completely extinct and Albany and inland was complaining that the coast always got snow. Well since 2017 the coastal hugger has become unextinct so I fully expect the same for clippers. In fact we have some clippers they have just been moisture starved which is odd considering the higher moisture content from the higher ocean temperatures.
Also remember in that 30-year period of 1970 through 1999, 14 out of the 30 years were below 19 inches for Central Park. Almost 50%.
As the weather always changes, at some point the fast flow will calm down and it'll change and maybe for the worst or better depending on other factors,but it will change.
And a question I have is why is nobody analyzing the warmer temperatures in the Indian Ocean and just focusing on Indonesia?
If Forky is correct and saying that warmer Waters circulate to the Western areas of our oceans (I mean it's true of curse), the same must hold true for the Indian Ocean which would increase the frequency and intensity of phases 1 and 2 which are colder for this region. It's sort of a balance if you will. However this ocean seems to be totally ignored.
My mind is blown however on how well Ocean City Maryland has been doing since 2018, it's mind-boggling. My childhood vacation spot which is completely surrounded by water, one side the bay, one side the ocean and is a toaster bath with extreme humidity in the summertime.
-
 2
2
-
-
1 hour ago, snowman19 said:
Agree with you that the blocking looks very impressive, no doubt about it. That said, it’s do or die time. We are going to have a limited window starting next week and into the following week to do something snow wise with the high latitude (-AO/-NAO) blocking we get. There is growing evidence that by the time we get to the beginning of March, all the blocking breaks down, MJO forcing goes back to the IO and Maritime Continent and the SPV strengthens substantially…I mean it can't last forever right. Looking at the CFS weeklies it aligns with the mjo progression through phases 1 and 2 which are colder than average. Then around mid March reward which is good for spring.
-
2
-
-
I do find the southeast ridge AO connection interesting, and Don's statistics showed it happened twice in the 30-year period while I already happened three times in the recent times. So there seems to be an uptick statistically.
That being said I do not believe it is the southeast ridge in and of itself flexing otherwise we would not have suppressed tracks this often or Gulf Coast snow. I believe the southeast ridge is getting pumped up by more intense storms, which would make more sense as it would explain why we are storms don't fly north because of a pumping Southeast ridge, rather intensifying storm just pulls the line up. Obviously this would occur when there's an RNA.
Another Factor is just looking at the statistical value of blocking does not tell the whole story. One has to look at where the blocking develops in addition to the strength.
Remember this bad period only started in 2018/2019. A tiny snapshot in the overall picture.
-
1
-
-
1 minute ago, LibertyBell said:
got 3.5 from the last event and expecting 2 from this one, not a bad week. This storm will get me to double digits and closer to last season's total (13 inches)
I got four on the last one but only expecting a half inch at best on this one. All good though. I am happy when everybody on the board get snow.
-
1
-
-
I don't know to me what I've experienced the past 7 years is exactly what I experienced back in the 80s and 90s, and apparently the '70s were the same too. Yes it was a little colder but the same the storm tracks were exactly the same. Always cutter hugger suppressed over and over again.
Whether or not it has to do with the southeast ridge linking up to the AO more often than that time frame, the results are the same.
I don't want to upset the board and say that we're in a middle of a 30-year bad period for snowfall like that one was, however I was actually hopeful that the warmer temperatures would help eliminate the suppressed track and move everything a bit north (and more moisture-laden) but obviously that's not the case as DC, Ocean City Maryland, New Orleans, Kansas City, Tennessee are all doing fine while we endure suppression yet again.
A positive would be that although temperatures are a little warmer than that time frame, we are a long long ways away from removing snow from our environment for obvious reasons.
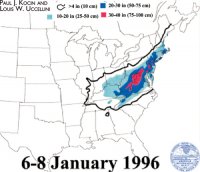
We will have a 1995-96 type winter again, a 2002 2003 again and so on and so on. It's just we're in a low snowfall period however where a lot of areas were losing out on snowfall during our time frame from 2000 to 2018 they are now reaping the benefits that are expense. Sharing the wealth LOL.
-
1
-
 1
1
-
-
1 hour ago, SnoSki14 said:
If the SE ridging ends up being too strong then storms will still cut. GFS/Euro OP show that for the 20th system.
Western ridging is too far west for my liking. The Arctic block has to compensate to ensure there's enough confluence in place so that system takes on coastal track.
What model shows a cutter for the 20? I looked at the Canadian the GFS in the euro and not one of them is even close to a cutter.
Remember a cutter goes to the Great lakes.
-
1
-
-
Happy the South and Southwest part of the forum are going to make up for the last event on this one good luck everyone.
-
2
-
-
-
-
10 minutes ago, LibertyBell said:
so the warming climate is enhancing the la nina base state
The water should pile up in the Western Indian Ocean too if we're talking circulation which would enhance phases 1 and 2 of the mjo which are colder for us.
-
1
-
-
Just now, SnowGoose69 said:
The PV orientation if I recall right in Canada was far east and elongated which prevented it. Also we had more of a neutral NAO and -AO.
The linking of the southeast ridge has happened in the past per Don's stats I posted above. We had a trough to our East where the confluence was pushing down on the Southeast ridge and linking to the trough to the west of the southeast ridge which stopped it from linking.
-
14 minutes ago, SnowGoose69 said:
The pattern honestly screams suppression post 2/17 or so but not totally sure I buy it
Would be funny if we had a repeat of the Southern snow as well LOL. Rain verbatim for now.
-
On 2/9/2025 at 11:39 AM, donsutherland1 said:
The website came back online. During 1950-1999, there were two blocking episodes (AO -4 or below) where the ridges linked up. Since 2000, there have been 3 cases. That means that the 2000-2024 period has seen such episodes twice as frequently as during the 1950-1999 period.
-
12 minutes ago, bluewave said:
The Southeast Ridge wouldn’t have linked up with a -4 to -5 -AO block in that much colder climate era.
In all fairness Don did pull stats which showed that although the frequency has increased, it has happened in the past.
-
31 minutes ago, eduggs said:
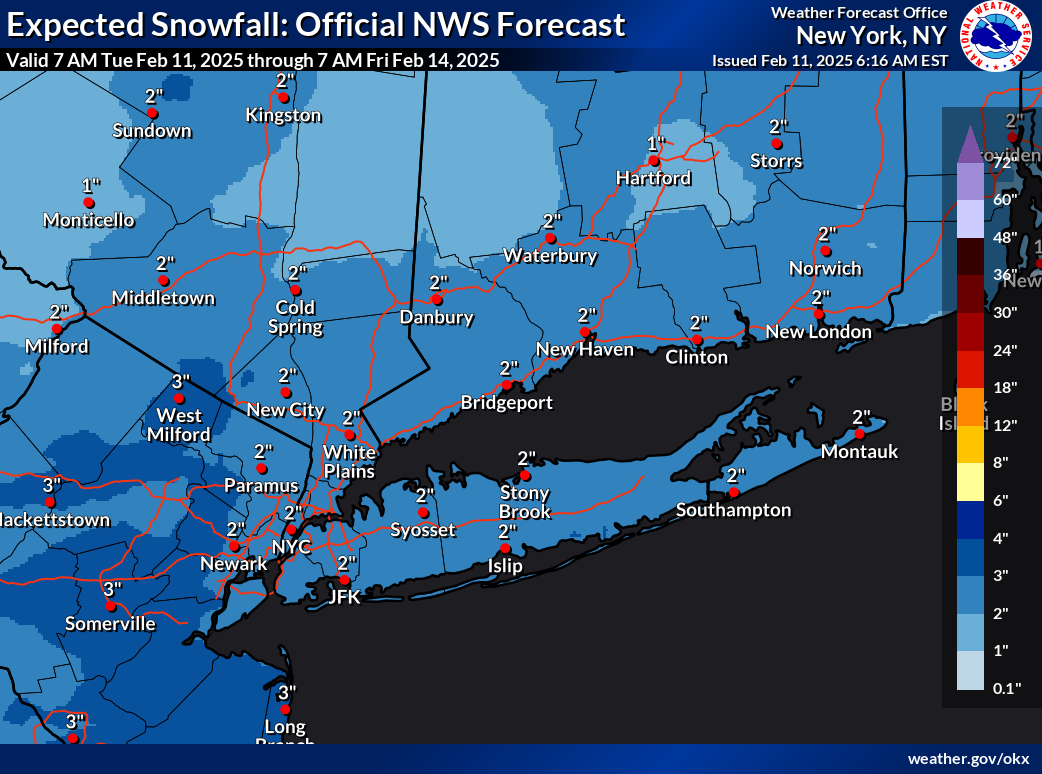
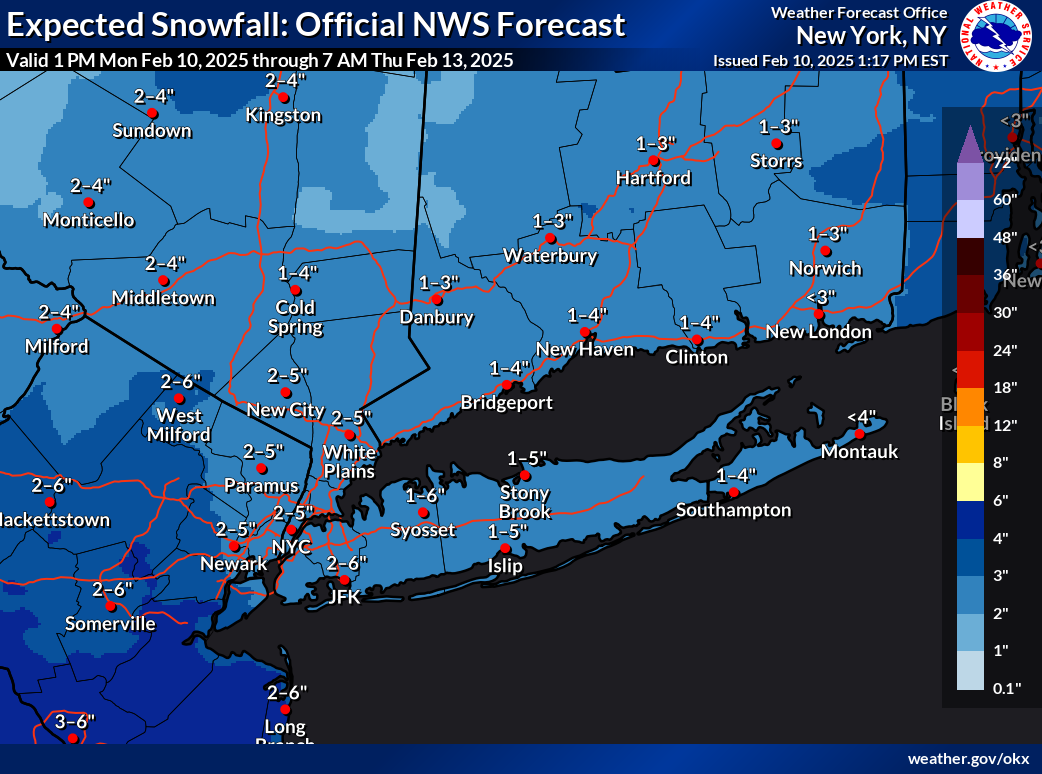
There were dozens of GFS ensemble runs last week that showed a range of mean 10-day snowfall totals for NYC... something like 6-15". As was pointed out multiple times, the 10-day total included a parade of mostly minor events. Some areas are running a little ahead of the multi-day ensemble consensus and other areas a little behind. What's missing is the 6" snowstorm as the cherry on top.
Agreed it just throws me off as I saw a post saying what happened to what the ensembles were showing with the large snowfall amounts. Really it's not far off so it wasn't a failure.
-
6 minutes ago, Allsnow said:
The ensembles this time last week had nothing for the Chicago area lol
At least they look pretty good for Central Park they had 11.5 on the mean in Central Park is at 4.1. let's see if they get close.
-
Might beat last blocking episode
-
2
-
-
Just now, Stormlover74 said:
Rgem unfortunately is south
The low pressure itself is actually a bit north it's just that the precept shield is a bit more condensed. Just noise.
-
1
-
-
1 minute ago, LibertyBell said:
there were some very underrated winters back then that should be mentioned more often
1977-78 everyone knows about
1981-82 below 0 and two major snowstorms, one in April.
1982-83 had the big HECS of the decade
1986-87 multiple major snowstorms
1987-88 snowy first half of winter
1991-92 multiple major snowstorms
Yeah if we do not just focus on snowfall average which was just 5 years and 30 years, then we see some positives just like we had a great month in 2022 and a great March in 2019. Also this year when looking back is going to look like another below average snowfall season, yeah we're going to have three below average temperature months as well as a lot of days of snow coverage. This winter will definitely be underrated.
-
1
-
-
Just now, Stormlover74 said:
And people are already looking ahead at a supposedly great pattern after the 20th instead of just focusing on what's right in front of us
What's crazy is Central Park might actually get close to the crazy high snow mean of 11.5 in on the ensembles that we we're all shocked about.
It is already at 4.1 and will likely get a few more inches this week. If they reach 8 then the ensemble mean was not that off base.
-
1
-
-
Just now, LibertyBell said:
Probably Atlantic City too then.
Yeah this is why I don't think the issue is the water temperatures. The heat island effect does come into play for the city itself.
I know I sound like a broken record at this point but Cold and dry warm and wet was the theme for 30 years from 1970 to 1999. This is why I'm tracking the average snowfall for that period Against the 2018 till now.
As you stated earlier mother nature tends to repeat herself.
-
1
-
-
6 minutes ago, LibertyBell said:
But does it mean that climate change affects NYC more than it does DC or Baltimore in terms of snowfall because NYC is closer to the ocean?
Ocean City Maryland is right on the water and they're doing great since 2018 and they're literally on the beach LOL.
-
1
-
-
3 minutes ago, MJO812 said:
Not bad

You're in a great spot for this one!
-
1
-
-
Just now, dseagull said:
The 80s were tough. I have a hard time reminding others in my family that despite the cold, we had very few big snows. Having said that, we actually had true Alberta Clippers back then. My nephew is currently doing a study on pattern changes that have led to the disappearance of frequent clippers.
Some of those systems would give some surprises.
It's going to be interesting to see how the next few years shake out. We thought the coastal hugger was extinct from 2000 through 2016. Suddenly one appeared March of 2017 and now we're getting a lot of coastal huggers so they became un extinct.
We are getting clippers this year the problem is they've been moisture-starved.
If your nephew hasn't already started your nephew should investigate 1955 through 1969 and see if we had clippers during that period. It could be cyclical as well.
-
1
-


Discussion for a probable 2 or 3 winter storms/events between Tue Feb 11 - Sat Feb 15. OBS threads for each will be added as needed.
in New York City Metro
Posted
In this Storm makes no sense however I do like looking in that direction for storms that are going to change over for us as more snow for them would mean more snow for us LOL.