
EastonSN+
-
Posts
9,110 -
Joined
-
Last visited
Content Type
Profiles
Blogs
Forums
American Weather
Media Demo
Store
Gallery
Posts posted by EastonSN+
-
-
Not over yet but the funny part was the EURO op stood alone at one point lol.
Atrocious model performance outside of the EURO despite the fact that it was over 5 days.
-
23 minutes ago, Weather Will said:
WB 18Z GEFS shows about a 23% of accumulating snow. Not saying it is correct, but keep expectations in check.
From MA forum
-
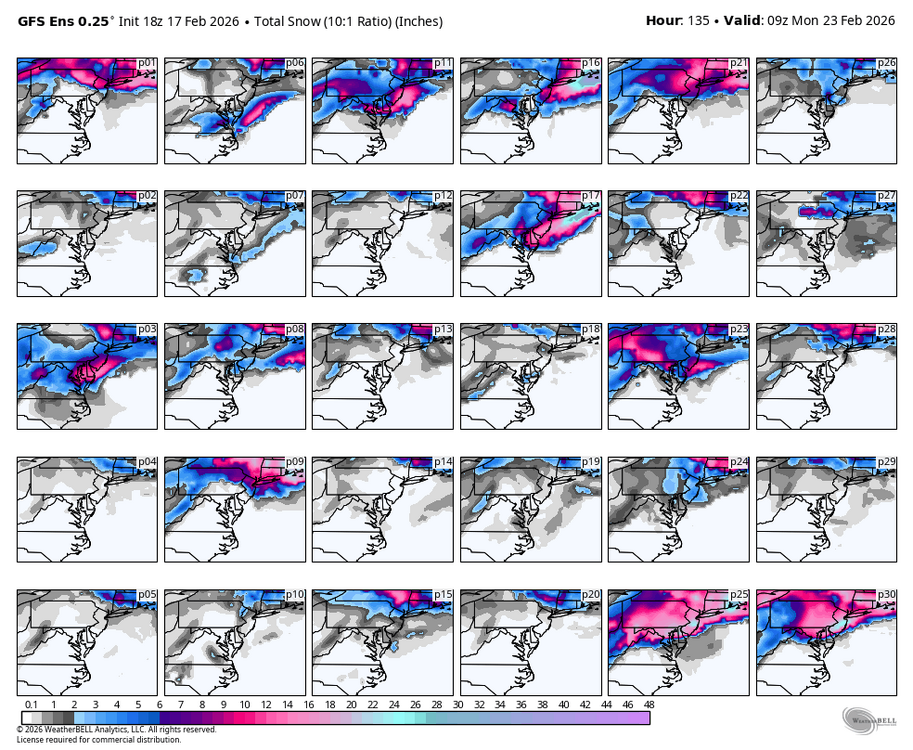
They posted the GEFS too.
7 out of 30 members have 6 plus.
2 members foot plus.
15 members 1 to 3 or nothing.
-
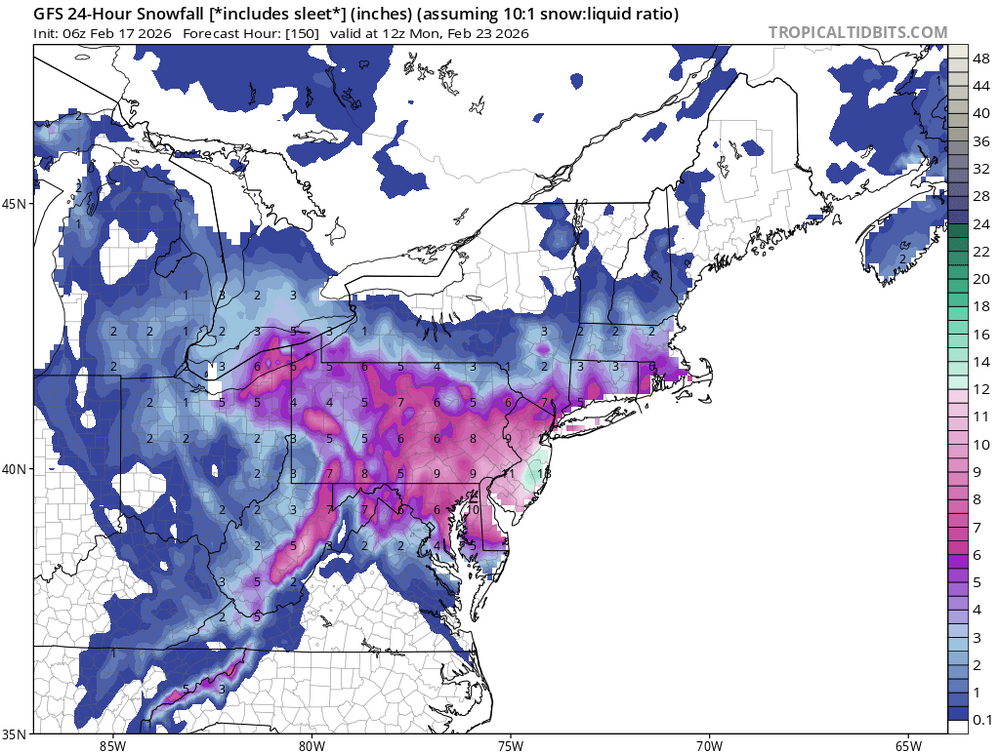
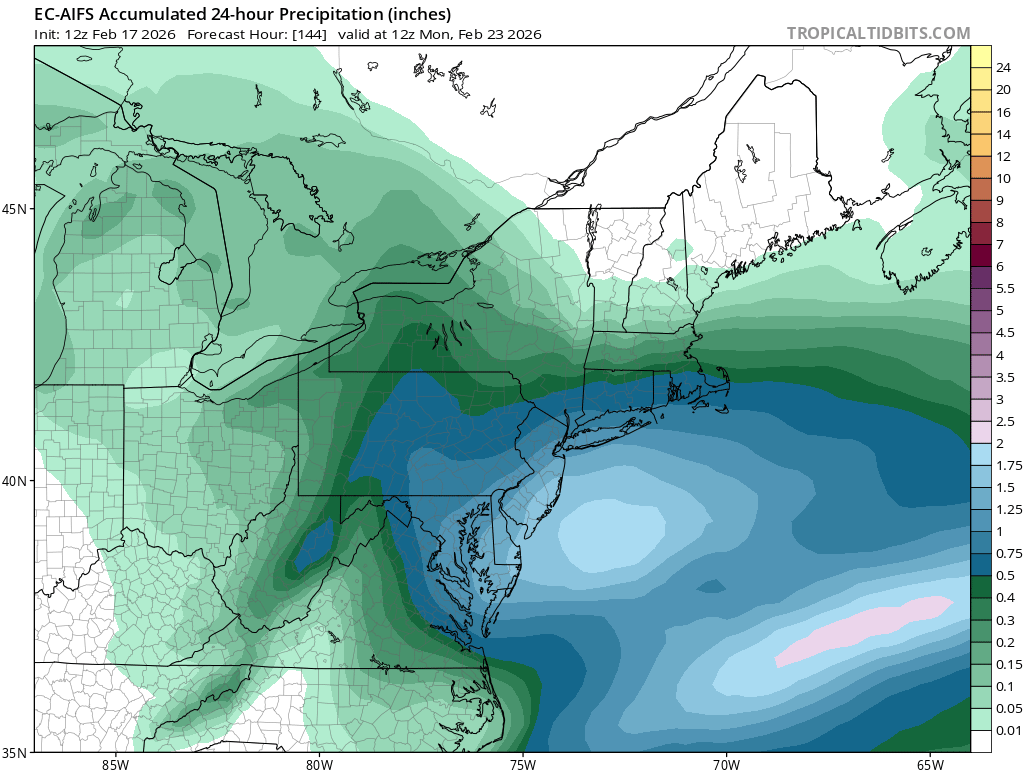
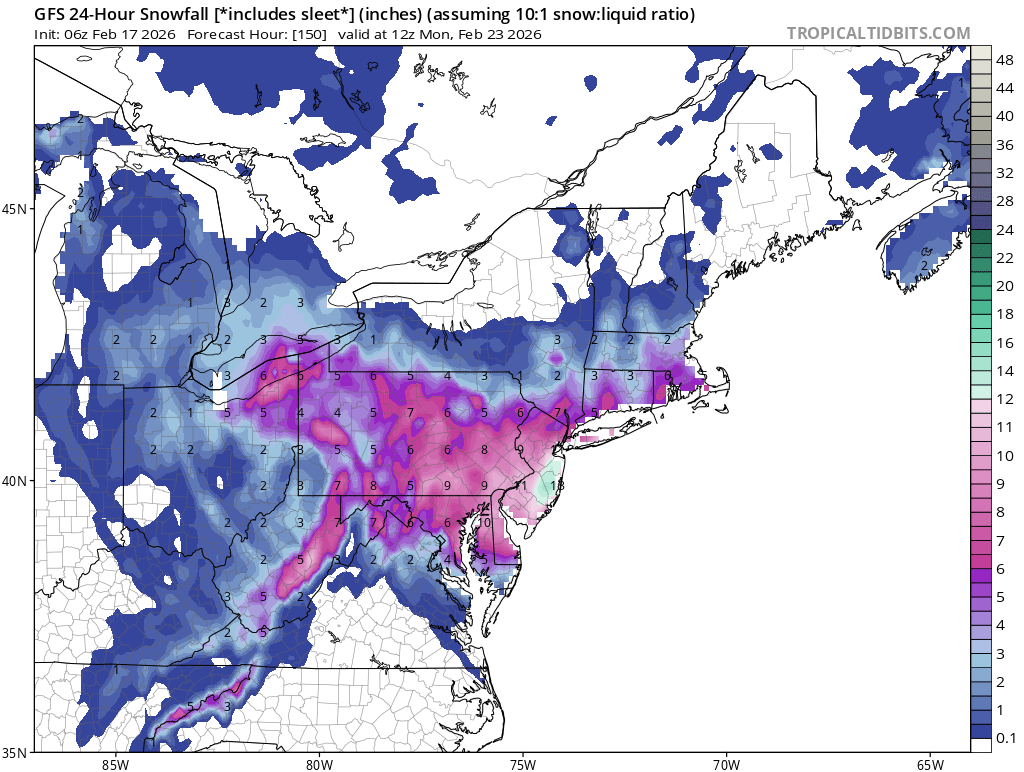
Actually they posted the snow map in the MA forum for the AI. Looks like a 3 to 6 event here. Philly DC 6 to 12.
-
Any word on the 18z ukmet?
-
31 minutes ago, RUNNAWAYICEBERG said:
Agree. I’m 80/20 plowable/memorable.
Kind of worried about even plowable.
-
 1
1
-
-
1 minute ago, nycsnow said:
How about the 18z
-
5 minutes ago, RUNNAWAYICEBERG said:
Skynet shows the whiff/graze possibility, the biggest concern imo.
Yeah the latest GEFS was not inspiring
-
-
-
9 minutes ago, GaWx said:
Thanks for posting that.
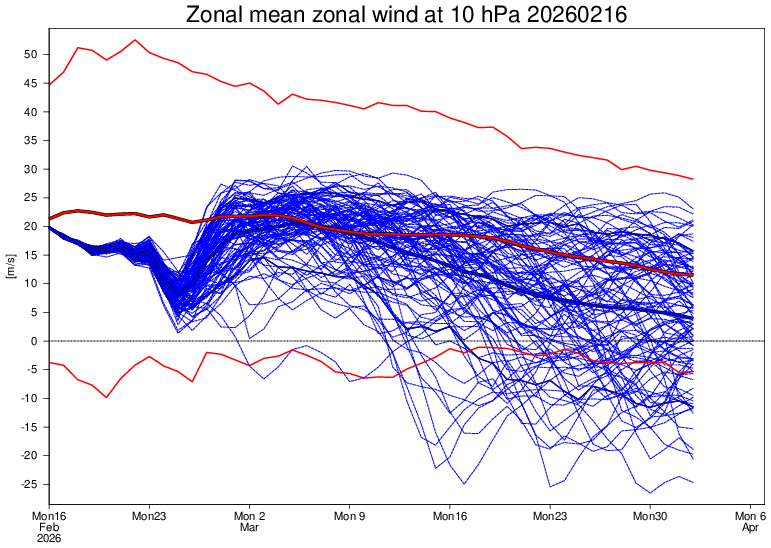
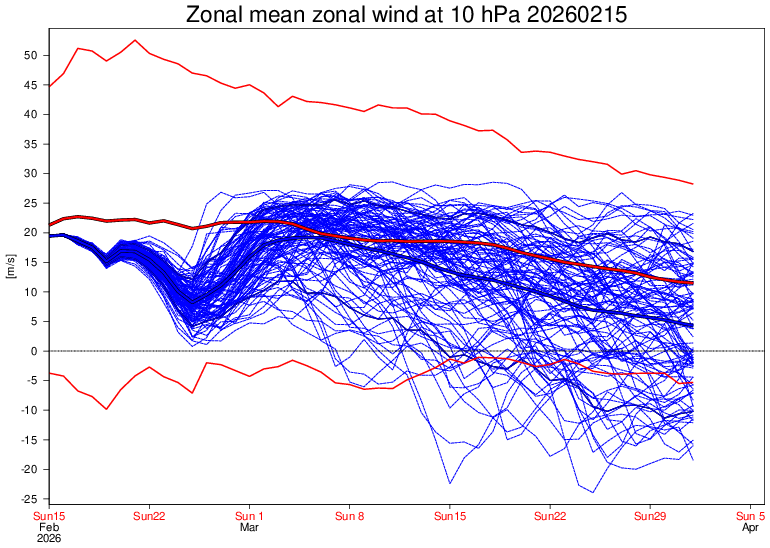
Will it get the dip right this time? It busted with those runs having it very weak around 2/10-15. So far this month the weakest has been down only to 19 m/s.
Also a rather quick rebound. @40/70 Benchmark may be able to opine on the effects.
-
 1
1
-
-
Fairly significant dip coming up.
-
 1
1
-
-
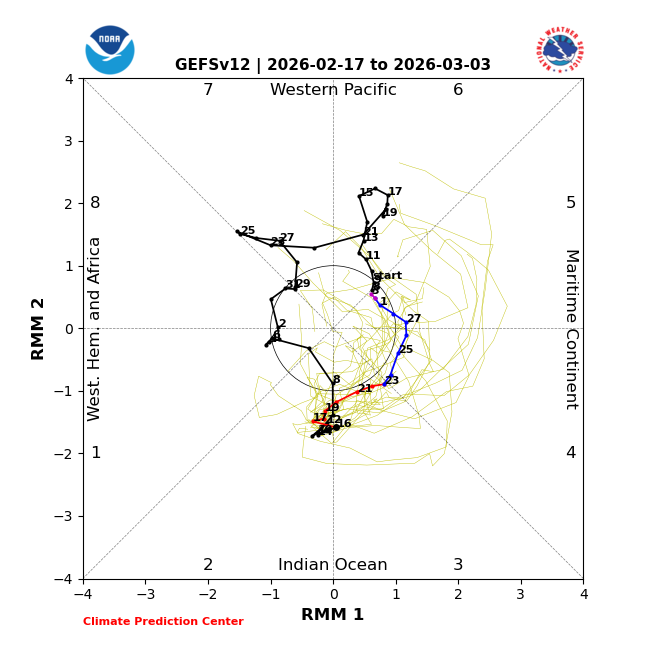
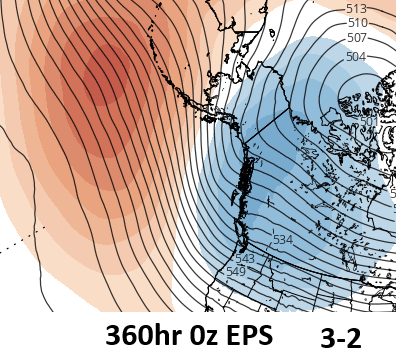
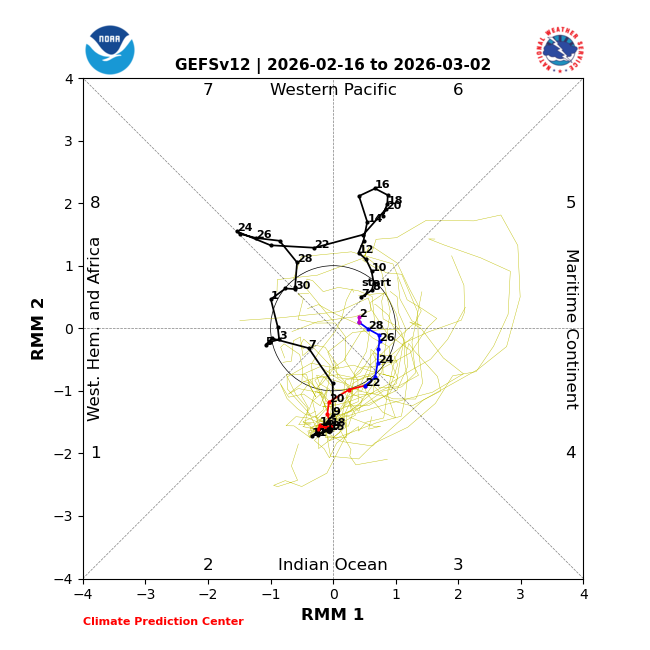
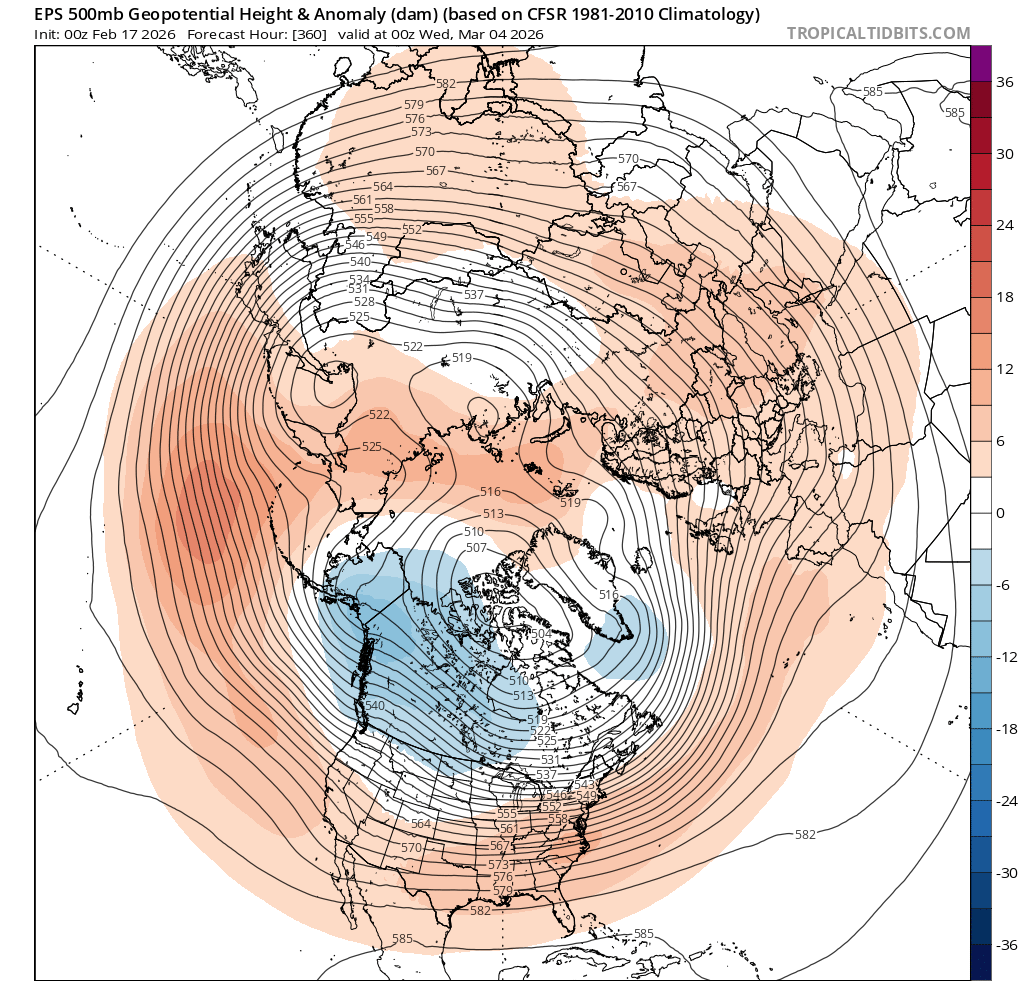
End of the EPS run which fits nicely into the phase 6 look.

-
MJO is taking too long to get to phase 7. If it takes 5 more days to reach 7, with a 5 day lag (guessing here) we are talking the 13th before we flip colder. Really late in the game for the MA.
-
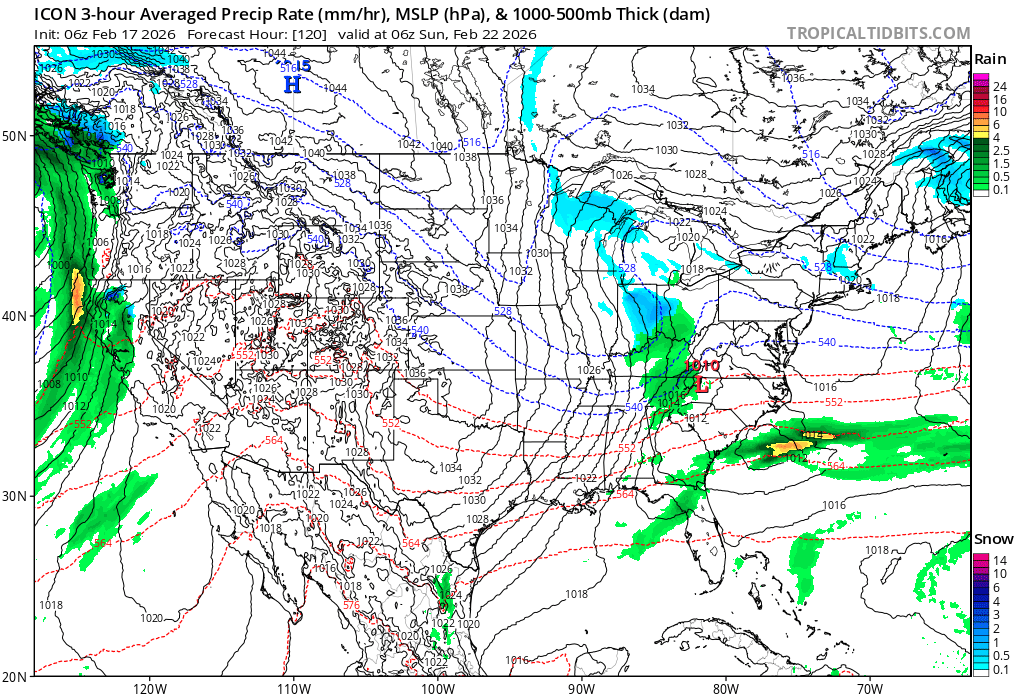
The ICON FWIW
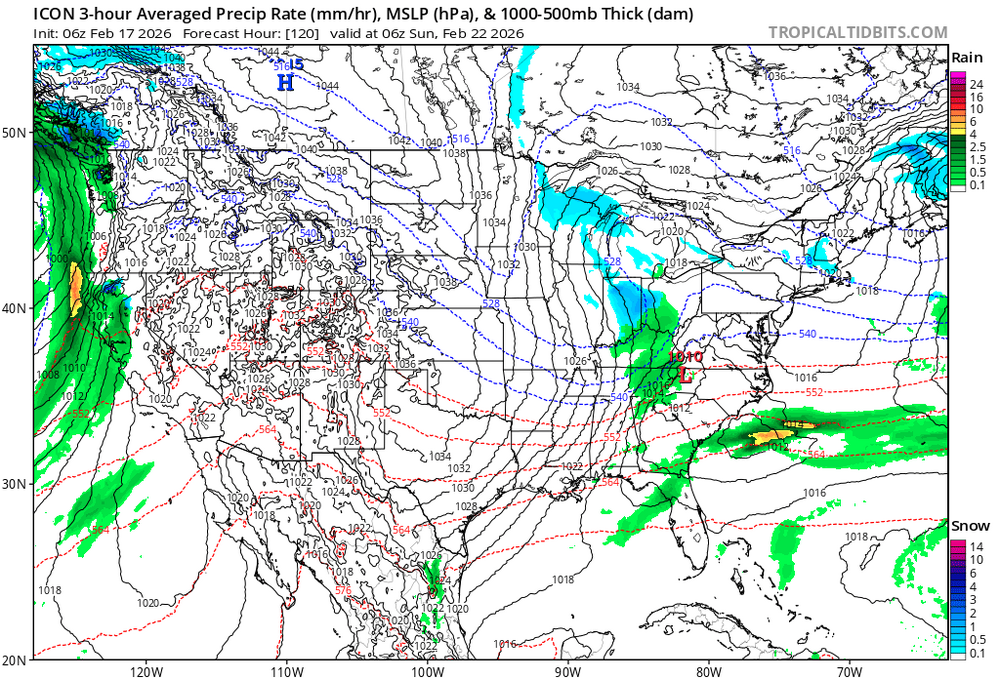
-
6z GFS was solid. ICON looked like it was going to improve over 0Z.
Of the operational runs, only the EURO showed nothing.
Either we all hail EURO in the end or all other models end up closer to correct.
Still a lot of time of course.
-
3 minutes ago, LakePaste25 said:
i’m fine with spring warmth. 40s feel like heaven here after that cold snap. obviously can’t really say i am done with snow here though because march can be quite wintery here in the great lakes.
I would rather get the cold phases out of the way in Feb and March so we can get warmth in April for a change. Spring has been awful here.
-
1
-
-
2 minutes ago, snowman19 said:
Not saying it can’t happen, but the models have been awful with showing the MJO propagating into phase 8 since late November only to have it fail. I guess all we can do is wait and see if it holds and is real this time
It did get to phase 8 twice, although for a couple days each. That being said, both phase7 periods ended up snowy for the NE.
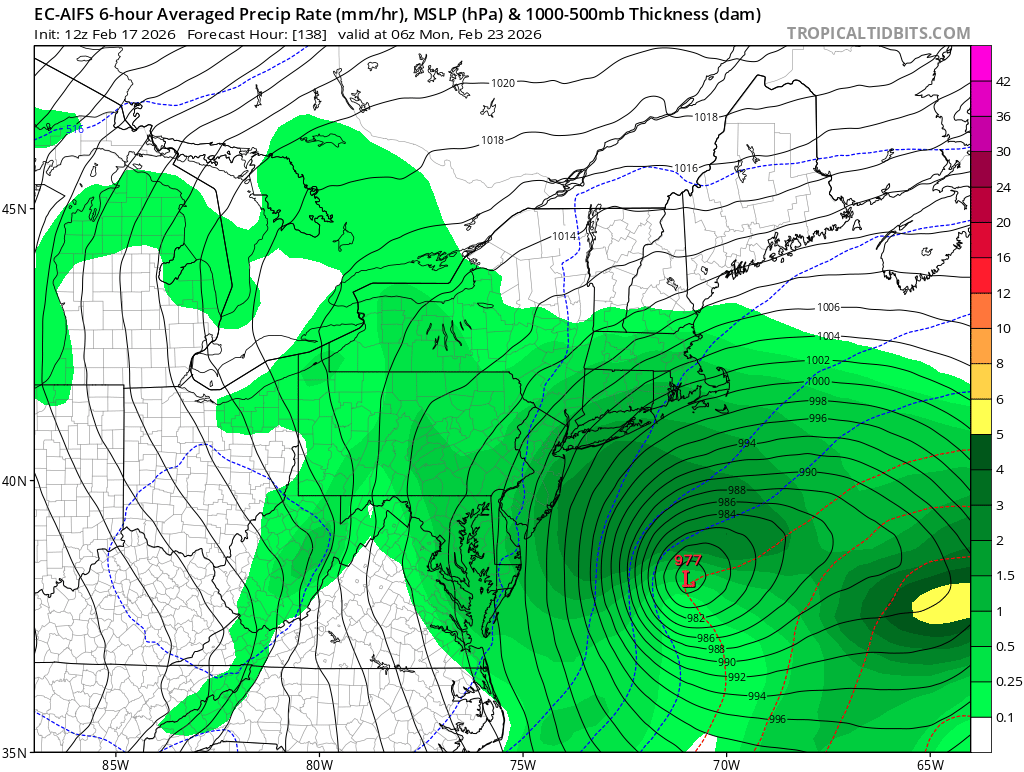
What I am curious about is the large snowstorm the GFS, EURO AI and now the ICON are showing. The only favorable telecommunications are the RNA coupled with the negative AO, which is only SLIGHTLY negative. I would think this would lead to an inside track. Could the FAST flow be helpful here in pushthe storm east before it can gain too much latitude?
-
1
-
-
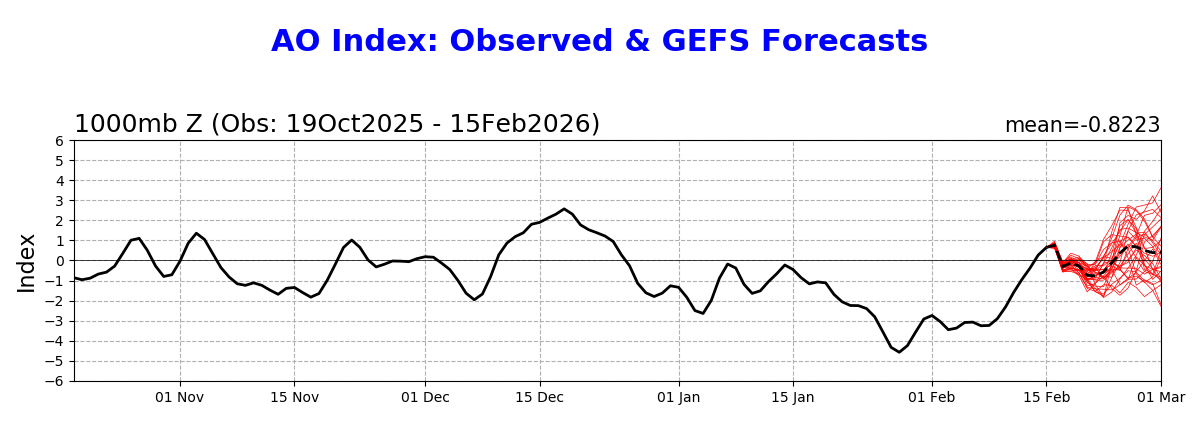
29 minutes ago, donsutherland1 said:
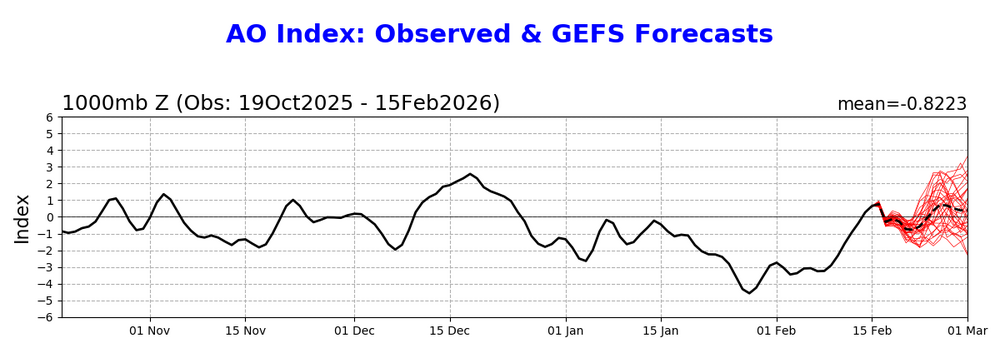
The latest AO forecast is even more aggressive with the development of an AO+:
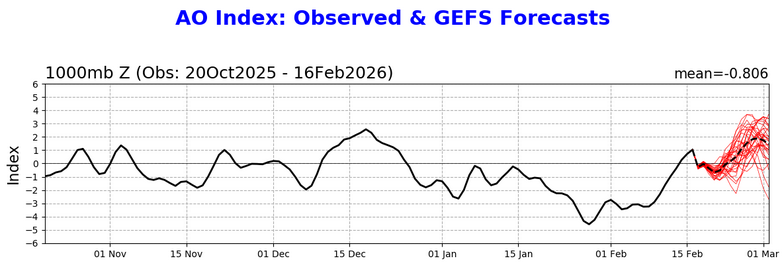
Given the other forecast teleconnections, this implies that the late February cold shot will likely be short-lived. Temperatures could return to near normal or above normal levels in the Great Lakes Region and Northeast in the closing days of the month.
Thanks Don.
Its far out there however the members are starting to drop at the end. This would align with the MJO heading to phase 7 and the dip in the zonal winds posted above.
This COULD make for a wild 2nd week of March.
-
1
-
-
Pretty solid dip forming EOM. Not sure what the lag time is but could align with the 2nd week of March?
-
Towards the end of the EPS run a LITTLE blocking looks like its forming by Greenland. This will likely be the key for as Don mentioned, an RNA is beneficial after mid Feb. with blocking.

-
2 hours ago, Stormchaserchuck1 said:
Warm pattern setting up for the 1st week of March.. strong ensemble signal for long range
The 2nd week of March SHOULD be a little interesting, although today's MJO forecast looks like its going into the COD.
-
1
-
-
Just now, Sey-Mour Snow said:
.2”
55 minutes ago, The 4 Seasons said:If anyone has S/SW CT totals from this let me know
0.1 here in Easton.
-
1
-
-
AO looks to be slightly negative during this window.


The Allsnow Blizzard of 2026
in New York City Metro
Posted
The only teleconectiion that supported a big hit was the negative PNA.
Red flag.