
EastonSN+
-
Posts
6,846 -
Joined
-
Last visited
Content Type
Profiles
Blogs
Forums
American Weather
Media Demo
Store
Gallery
Posts posted by EastonSN+
-
-
5 minutes ago, LibertyBell said:
And there are some years when we had zero blocking but still had a great deal of snow and very cold temperatures, 1993-94 being a case in point.
Yup like 2013/2014. PAC will always have greater importance than the Atlantic. Of course, if you are big storm hunting, you want them to align.
The PAC is like the cold water faucet, the Atlantic, or blocking, the drain. Turn the cold water on high the close the drain....
-
 1
1
-
-
13 hours ago, LibertyBell said:
Chris, weren't some of these other winters pretty warm too-- we didn't see much snow in 1998-99 or 1987-88 either (although we did have the one snowstorm in January 1988 that was pretty good.) 1970-71 and 1965-66 didn't give us much snow either, but they were definitely colder.
The two years over 20 inches were not surprisingly during our two cyclical extreme snowfall periods. The other three during our 30 year snow drought.
The PAC is cyclical so I believe this proves that blocking alone will never help us, we need blocking PLUS a good background state. Look at the last two years, just a repeat of 70 through 99.
-
1
-
-
13 hours ago, bluewave said:
On track for one of the warmest winters with a double SSW.
Snowfall for CPK.
Odd that only one year had above average snowfall, and that was the year Amy said barely qualified. Was suppression the issue? I remember 98/99 being a Trainwreck. The two years over 20 inches were during the two extreme snowfall periods, so perhaps the cyclical PNA pattern.
65/66 - 21.4
70/71 - 15.5
87/88 - 19.1
98/99 - 12.7
09/10 - 51.4
-
1
-
-
Daily 14th. Obviously will not get pushed back or can-kicked at this point so last day posting these.

-
-
37 minutes ago, bluewave said:
It seems like the increase in 6”+ days has masked the decline in 1-3”. So when we get the inevitable drop in larger events, there isn’t a small events cushion to fall back on. This has resulted in 5 out of the last 6 seasons in NYC with below average snowfall so far.
Monthly Total Snowfall for NY CITY CENTRAL PARK, NY
Click column heading to sort ascending, click again to sort descending.YearOctNovDecJanFebMarAprSeasonMean 0.0 1.1 2.2 3.9 5.5 2.2 T 14.4 2023-2024 0.0 T T 2.3 0.0 M M 2.3 2022-2023 0.0 0.0 T T 2.2 0.1 0.0 2.3 2021-2022 0.0 T 0.2 15.3 2.0 0.4 0.0 17.9 2020-2021 0.0 0.0 10.5 2.1 26.0 T 0.0 38.6 2019-2020 0.0 0.0 2.5 2.3 T T T 4.8 2018-2019 0.0 6.4 T 1.1 2.6 10.4 0.0 20.5 We have to carve out 70 through 99 and and compare against 2020 onwards. 2000 through 2018 was more in line with 55 through 69 especially in terms of KUs.
I am tracking the average annual CPK snowfall 70 through 99 against 2020 onwards. My thoughts are still +-2.5 inches.
-
46 minutes ago, donsutherland1 said:
Here are the graphed outcomes:
Do you think the war had anything to do with that massive drop in the late 30s early 40s?
-
9 minutes ago, LibertyBell said:
DelMarVa maybe but Tennessee maybe not because areas near the ocean are warming faster because the ocean itself is warming faster.
I'm not sure what's up with the DelMarVa because DC's snowfall has dropped pretty quickly.
DC always had issues as they are too far north for SE sliders and too far south for many Miller Bs.
How much warmer can ocean temps realistically get to (obviously boiling but that would be a much much graver situation lol).
Remember coastal NC just had a good snowfall event too. That is important considering water temps.
-
1 minute ago, LibertyBell said:
IMO it's not the decline in 1-3 thats a big deal, it's the decline in 3-6 thats the real issue here. a bunch of 3-6 storms add up quickly and thats what we've really lacked
This time period compared to 70 through 99 will be telling, as we cannot compare this to 00 through 18 (55 through 60 is a direct pattern comparison to 00 through 18).
I am tracking average annual snowfall starting this decade against that period. I suspect they will be very close (+-2.5 inches CPK). Reasons I have already stated (increased moisture/dynamics offsetting temps).
My tipping point will be when we stop seeing Tennessee, Delmarva getting hammered.
-
5 minutes ago, forkyfork said:
how are we going to get those events if we struggle to get airmasses like that
This is where my thoughts diverge from some.
I believe GW is linear, with repeated patterns from the past reoccurring with higher temps. I do not subscribe to outright regime shifts where patterns from the past can no longer exist.
Caveat MAY be large urban areas where HIA plays a larger role in EC, especially early/late season. However, I need more time/seasons to digest.
Please keep in mind, I grew up in the 85 through 99 years where snowfall seemed next impossible (even wearing short sleeve shirts one January in the early 90s). Therefore, the last two years are not a shock to my system, but rather a familiar pattern that I lived through.
-
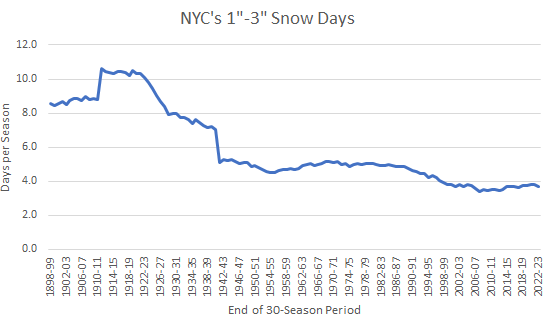
26 minutes ago, donsutherland1 said:
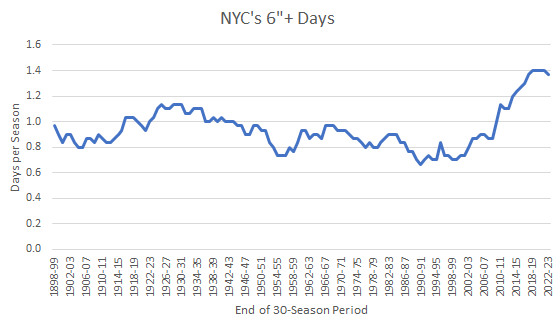
NYC Statistics on the Number of Snow Events:
Early Recorded Climate:
1869-1870 through 1898-1899:
1"-3" days: 6.2 per winter
6"+ days: 1.0 per winterMore Recent Climate:
1961-1962 through 1990-1991:
1"-3" days: 4.7 per winter
6"+ days: 0.7 per winter1991-1992 through 2020-2021:
1"-3" days: 3.7 per winter
6"+ days: 1.4 per winterThanks Don!
The decline in 1 to 3 coupled with the increase of 6+ really shows the effects of increased moisture/dynamics resulting from temps.
Do you happen to have 1890 through 1960?
-
1
-
-
16 minutes ago, bluewave said:
The issue with much warmer winters is that we have become very KU dependent for NYC to get close to 25” on the season since the 1990s. During colder winters before then, it was easier for NYC to get closer to average with a bunch of small to moderate events. But snowfall seasons like that are pretty much non-existent these days.
To be fair, a lot of snow events in the 70 through 99 era were 20 to 25 degrees with snow. Those events would still be snow today, and likely higher amounts due to higher moisture content.
-
1
-
-
Just now, bluewave said:
We can get small to potentially moderate events with a hostile Pacific like we saw in January. But I think we’ll need to see improvements in later model runs out West to have a chance for NYC to go over 10” in the season. There is still time to out something together. But it’s not a guarantee.
Completely agree. This is likely why KU events, outside of 55-60 and 00 through 18 are typically hard to come by.
-
21 minutes ago, bluewave said:
The improvements out West got pushed back as we have seen that we can’t just rely on the -AO without Pacific cooperation for major events. We still have time to put something together from later February into early March. But there are no guarantees with how hostile the Pacific has been in recent years.
I do agree, however, I think there is a difference between a trough out west and what we have experienced the last two years. Those troughs were to BAJA and that's impossible to overcome (unless you have a PV press like wx orhman pointed out happened in December 2002).
If you have a moderate trough blocking can still overcome. Also, the last blocking episode failed in a different way, the middle Atlantic received the snow. Troughing to Baja means cutter.
-
1
-
-
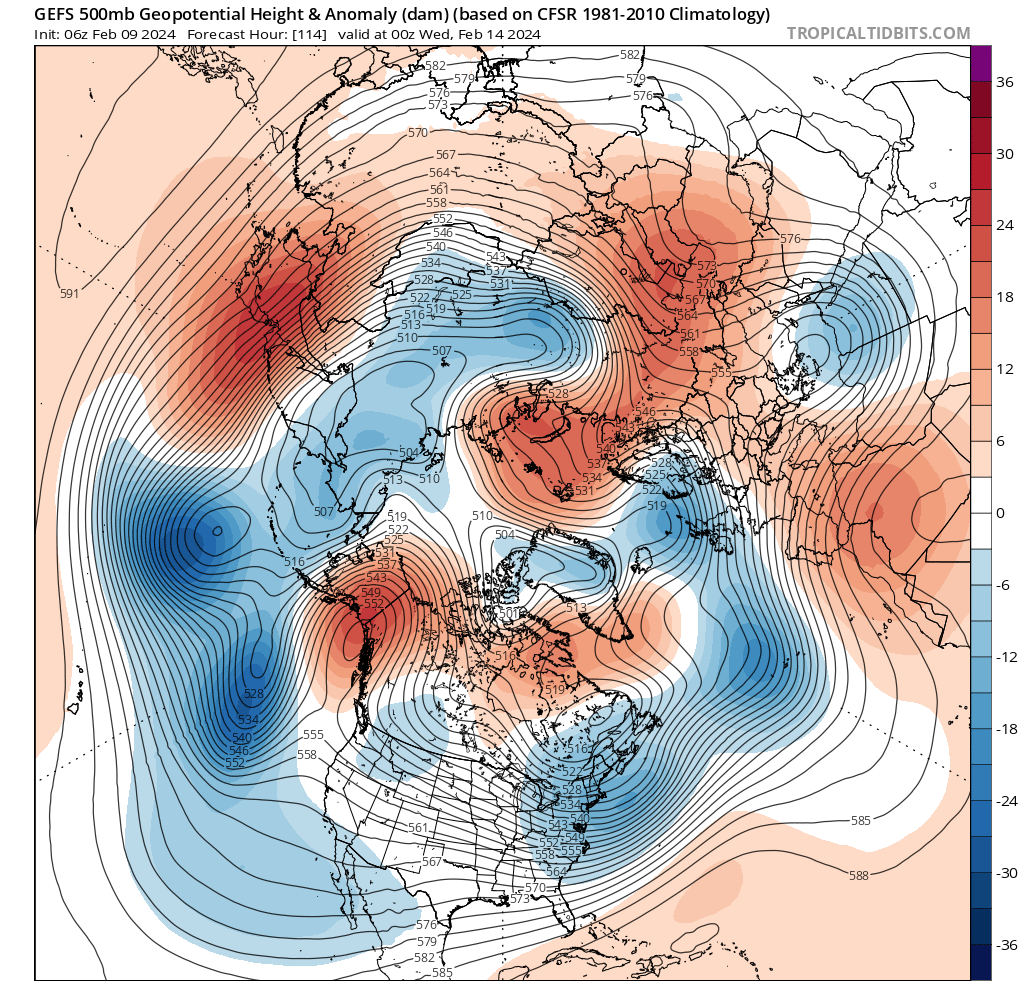
Daily for the 14. Still no can kick.


-
3
-
-
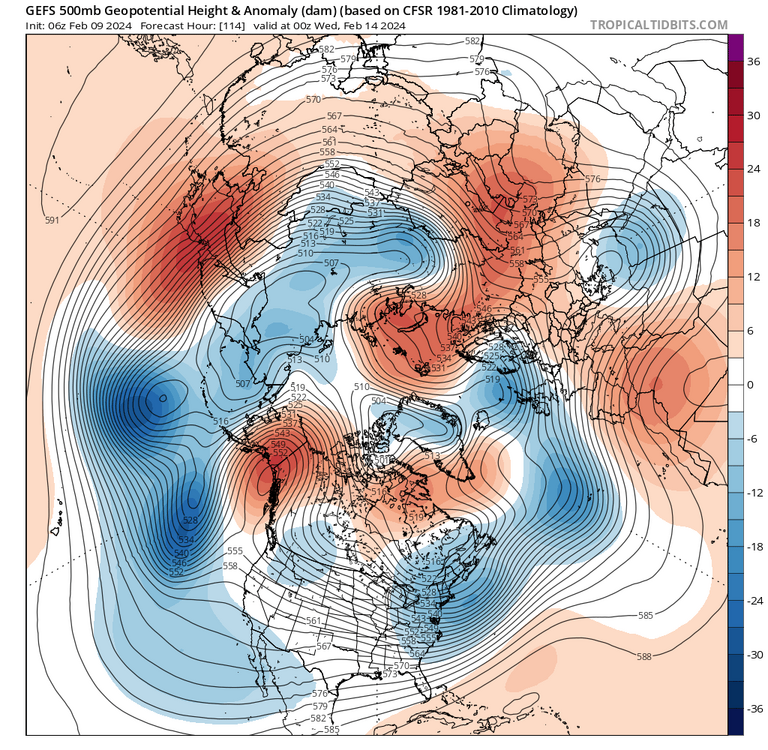
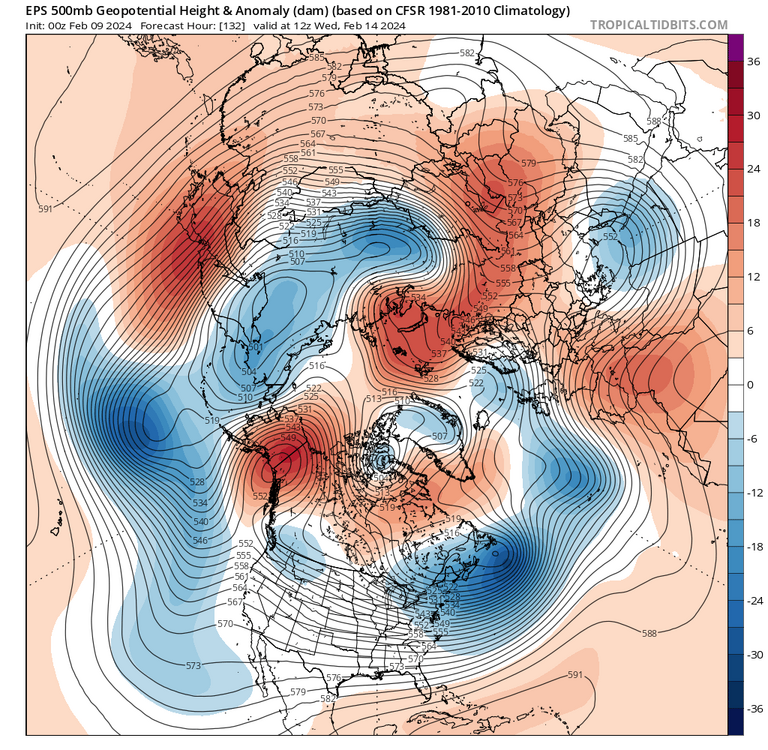
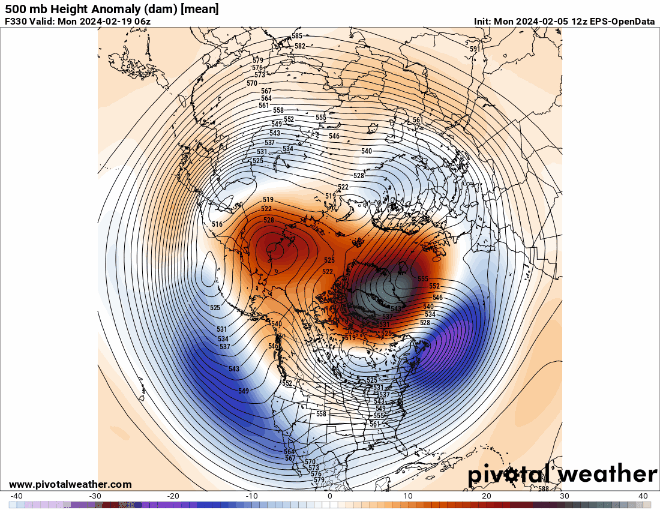
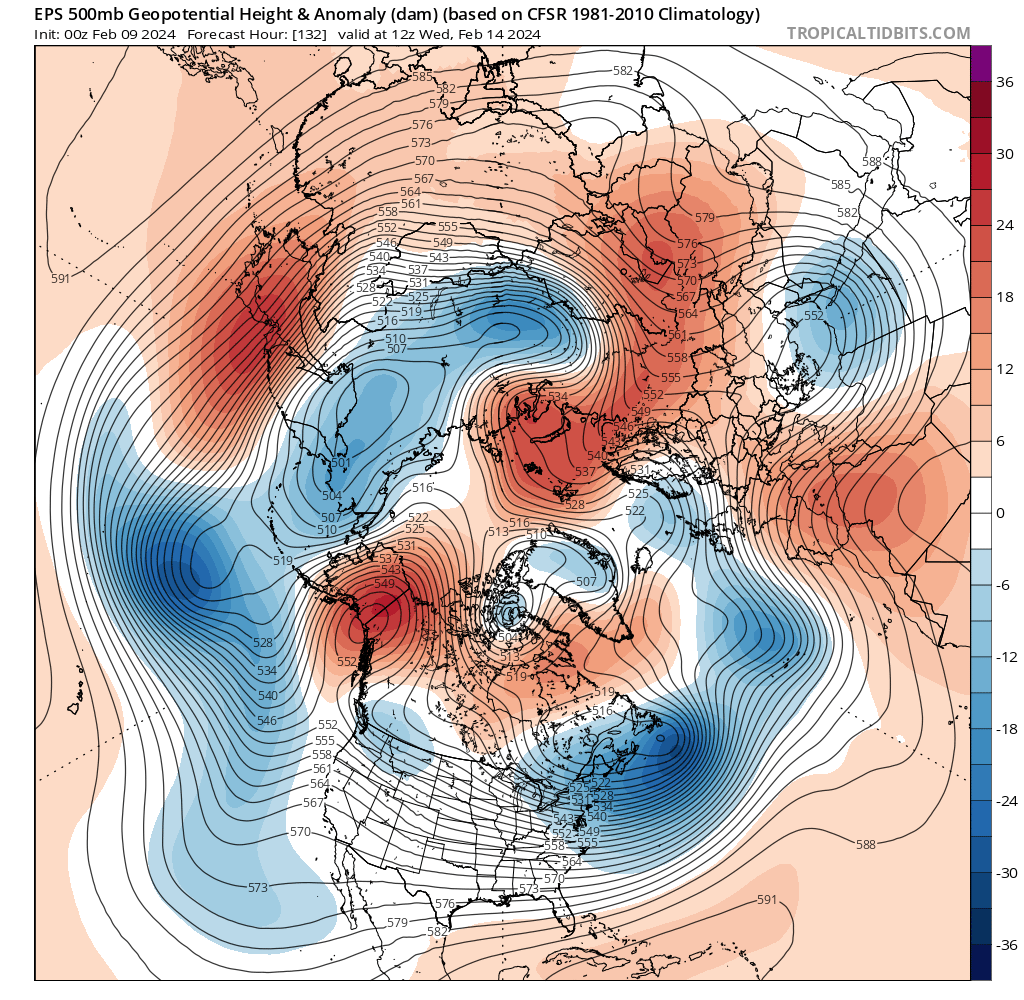
1 minute ago, donsutherland1 said:
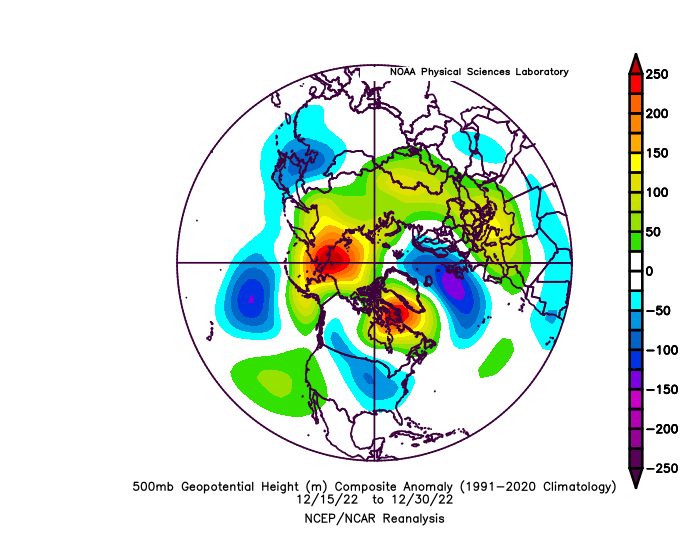
My concern this early on (and things should improve afterward) is that the above 500 mb chart is quite similar to a period that also was a "miss" as far as snowfall was concerned for the NYC and Philadelphia areas: February 17-March 3, 1958.
New York City: Precipitation: 1.95"; Snow: 0.5"
Philadelphia: Precipitation: 1.97"; Snow: Trace
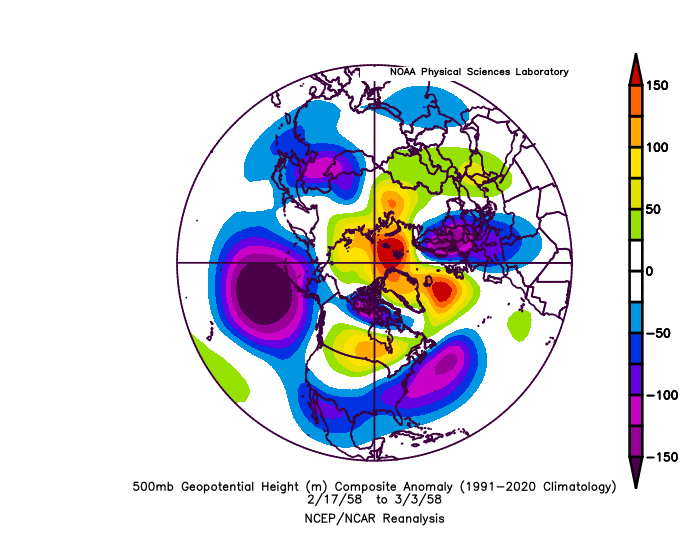
Yeah that looks similar.
-
38 minutes ago, brooklynwx99 said:
the patterns? that's easy. here you go! they actually all verified, look at that
unfortunately, great patterns do not guarantee snow. they only increase the odds. something can always go wrong, and we have had really bad luck. but you already know this and are being purposefully inflammatory
2000 through 2018 skewed expectations. 70 through 99 showed how these setups can fail/give us light to moderate snow.
-
-
1 minute ago, MJO812 said:
It redevlops but warm
Before the 14th so would be a bonus if worked out.
-
Just now, LibertyBell said:
I think your area received close to 2 feet lol
Only received 7 here. Unlike NEMO, the heaviest stayed east of the CT river.

-
1
-
-
On 1/26/2024 at 7:30 PM, Rjay said:
Joe Cioffi
.jpg.e7c07cdfe2b79c22bc6013a317914746.jpg)
At least our area received a 6 to 12 event. The Philly area was expecting that and received nothing.
-
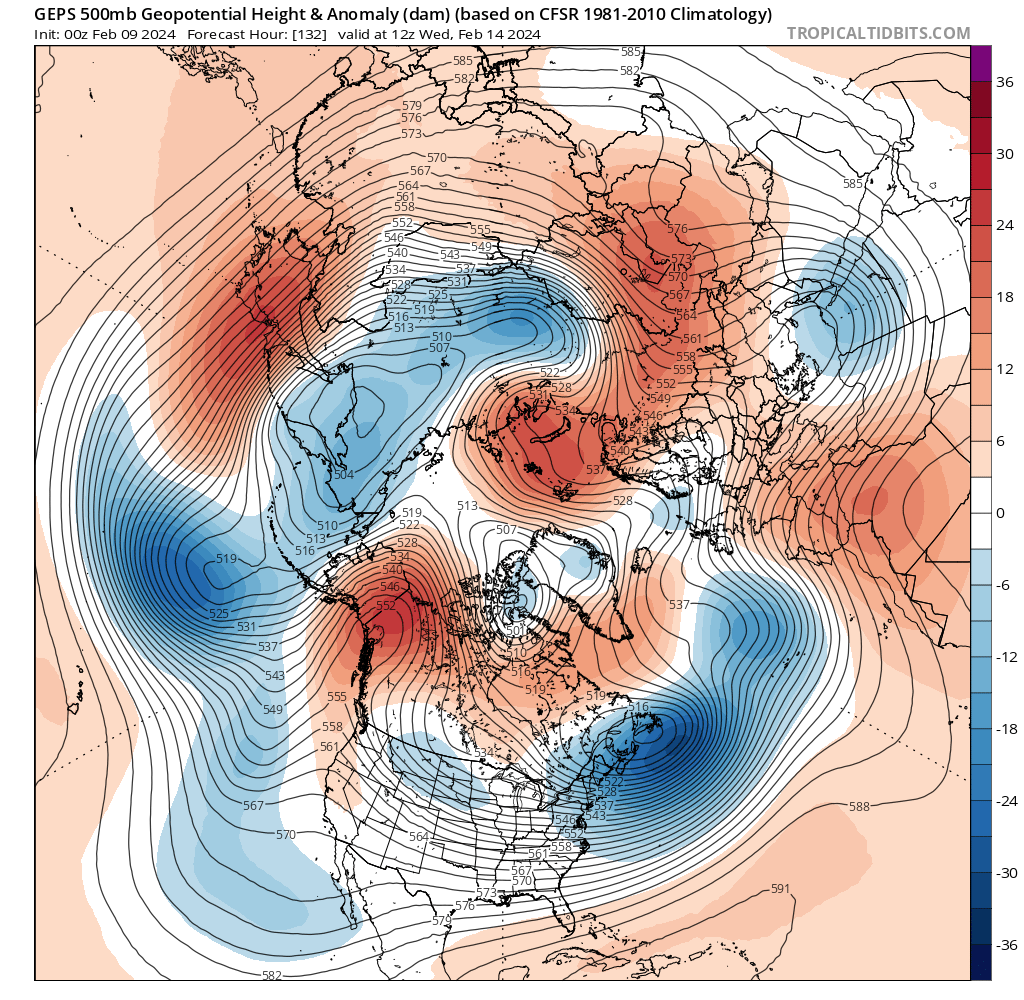
Daily 14th post. Safe to say it's not getting pushed back or can kicked.


-
2
-
-
25 minutes ago, forkyfork said:
less-nao
Isn't that what we want? Less suppression.
-
1
-
-
16 minutes ago, bluewave said:
If you want the heaviest possible snowfall with the chance to see 200”+pick the Tug Hill or Marquette areas.

You know we've had it rough when southeast NJ is beating CPK.


February 2024
in New York City Metro
Posted
Great sign, courtesy of the NE forum.