TSG
-
Posts
737 -
Joined
-
Last visited
Content Type
Profiles
Blogs
Forums
American Weather
Media Demo
Store
Gallery
Everything posted by TSG
-
Sidewalks starting to cave, a few slushy spots forming on pavement. Temp holding steady at 29/27. Heavier bands on the way in from the West. One thing to remember for those of you refreshing radar every 30s.. LWX has significant blindspots to the West, especially for low level stuff like this. The worst area is WSW pointing towards Harrisonburg and Staunton. In the summer it's not nearly as noticeable with higher cloud tops. You need to check the Roanoke and Charleston radars to get a better idea of what's headed over the mountains into NoVA.
-
I think that might've been Ji flavored sarcasm
-
This forum could be part of a case study about mass hysteria events
-
15z HRRR is improved for the northern crew
-
haha I'll get over there later once it's piled up a bit more. I can't remember, did you typically do night shots or day? or both?
-
Wet-bulbing has gotten us down to 29F in Albemarle after a high of 34F around 9am, 2 degrees colder than the 15z HRRR initialized at for this area. That seems like a good sign for us down here later, maybe not a great sign for those way north. 29/26, SN, ~2" otg, visibility fluctuating between 1-0.5 mile
-
The HRRR has been getting colder each run. Sleet line looks to stay south of CHO until at least midnight now. It came through around 9/10pm on some earlier runs this morning. 30/25, moderate snow, ~1" on the ground so far
-
wololo
-
And we do have a full moon in 2 days... uh oh. hope the models are taking this into account
-
This is pretty locked in. Not worth putting much weight on the SREFs or GEM output
-
every damn time. I mean I hope not but..
-
lol I do the same to some extent, never diagnosed but I've got plenty of the signs and signals
-
That's what I've got my eye on at this point. It could be nasty along and West of the BR. Idk exactly what storm track / system charcteristics combo we need to get this kind of setup, but it's reminding me of the mid-January storm in 2022. There was a big pocket of cold air that never really eroded in SW/Central VA. If yall don't remember that storm it was a quick front end followed by rain (for most). Down here we never really lost the surface, maybe got to 33-34 before crashing again, but areas 100+ miles north were getting blasted with 45 degree ocean air and lost anything that fell or was remaining. The end result was we had snow on the ground down here almost that entire month while the metros only had a week after the Jan 3rd storm
-
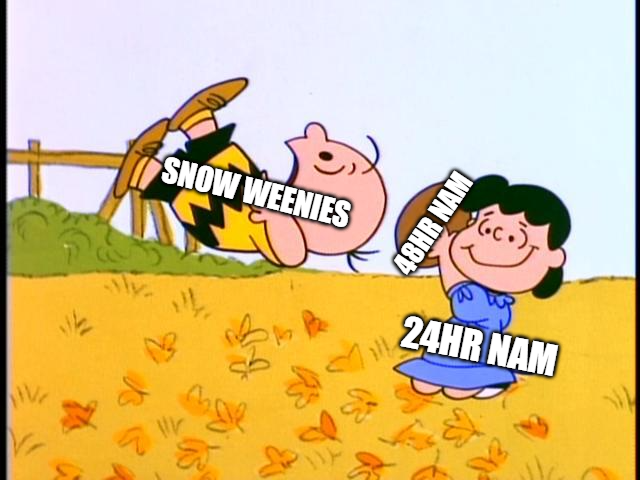
We are now entering the most dangerous territory for the snow weenie: extended HRRR and NAM at 48 hrs
-
When did I say you were wrong? Everyone here has emotions about snow chances. This is the most edge-case filled forum among the spectrum of people that care at all about the weather. How would we not? It's just that the vast majority of the people here choose to not muck up the storm discussion threads with it. It's obnoxious scrolling through the same 10-15 posts every model cycle that are nothing but "I just KNOW the north trend is coming" "It hasn't snowed 6" in Baltimore since friggin 'nam dude!" "THIS IS SO UNFAIR, WAAAAAAAAAAAH"... But that's okay! That's why the ignore list exists
-
This is the exact type of post I'm talking about
-
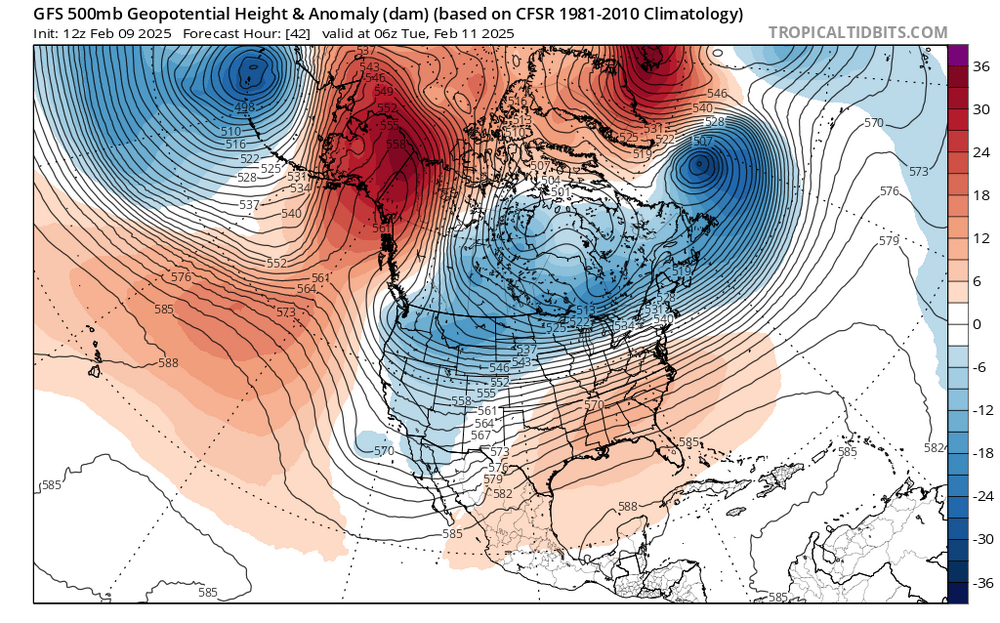
There will be blocking in place when the storm arrives Tuesday. The low that went North of us yesterday will become the 50/50
-
This current storm thread has added more people to my ignore list than the last 10 years combined lol CHILL YALL. We don't need to know your every waking thought
-
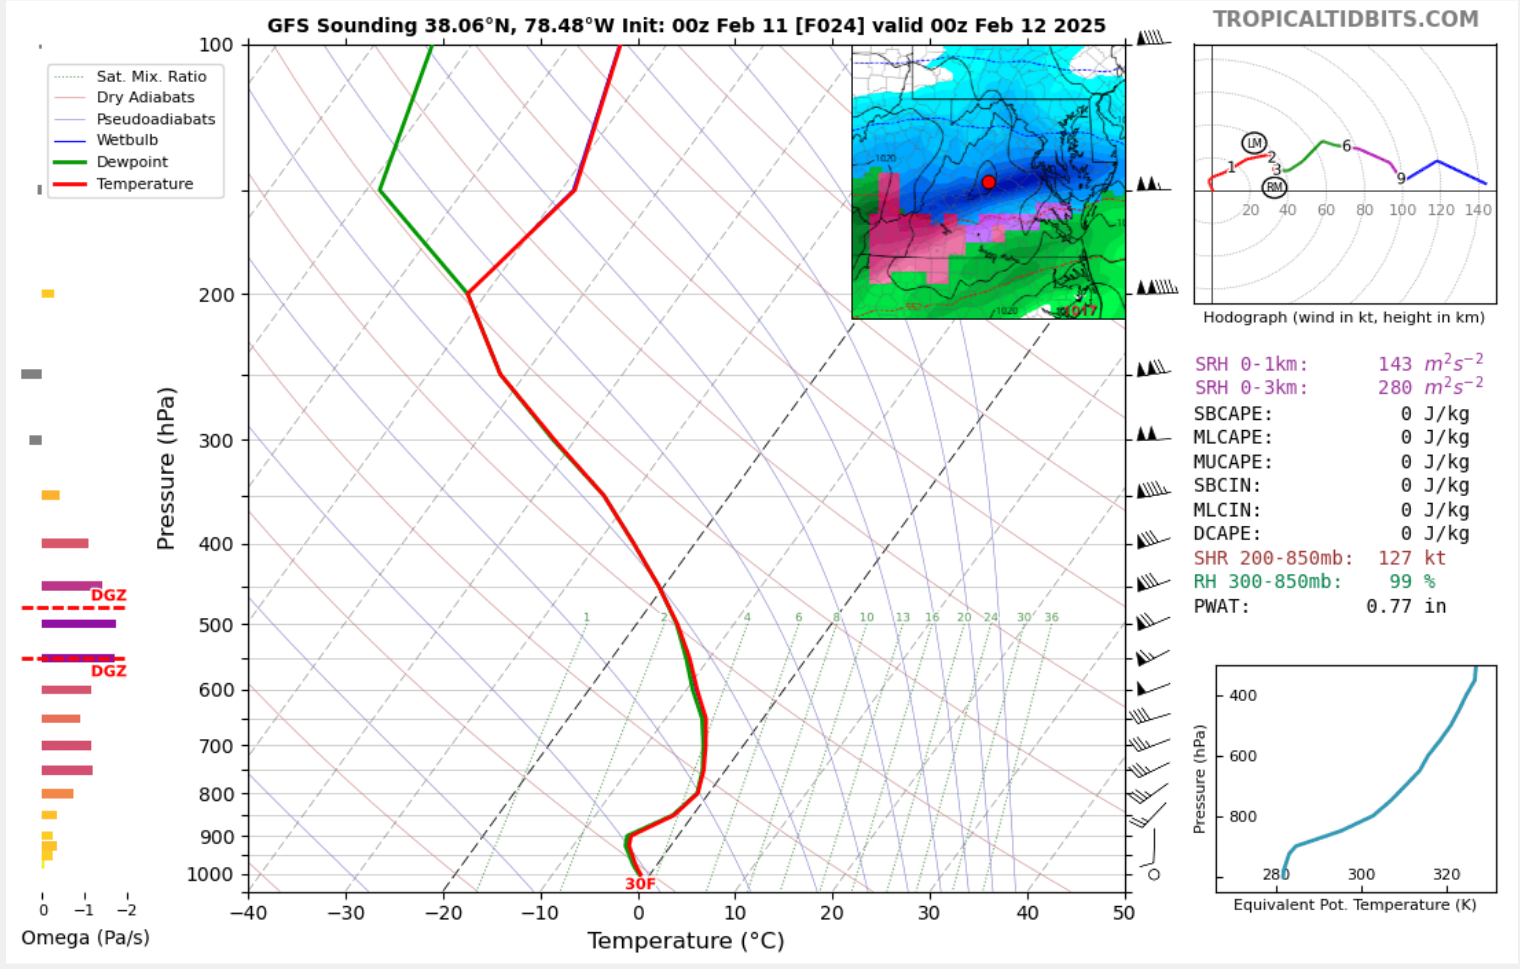
I don't have all the details but yes it does. Not sure how it determines melting rates, radiation effectiveness, or anything like that. Existing snowcover is a data input at simulation start
-
The big change I'm seeing is precip never really shuts off for much of the area Wednesday afternoon before the next batch makes it's way in from the "Thursday storm". The spacing there seems much tighter on the GFS compared to 24hrs ago. That'll help the CAD hang on longer and would def increase ice totals.
-
The ice threat Wednesday afternoon/evening is starting to look a little scary west of Rt15
-
I couldn't disagree more! GIMME 10" OF COLD SMOKE BABY
-
Does space weather count? The May 10th aurora was something I wasn't ever expecting to witness this far south. I only heard about it the morning of and ~12 hours later my mind was being blown parked at a mountainside lookout near Wintergreen.