chubbs
-
Posts
3,894 -
Joined
-
Last visited
Content Type
Profiles
Blogs
Forums
American Weather
Media Demo
Store
Gallery
Everything posted by chubbs
-
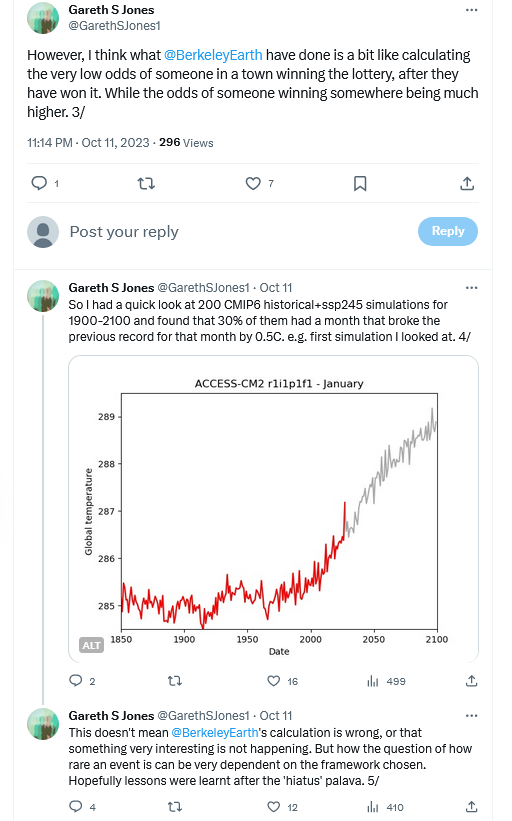
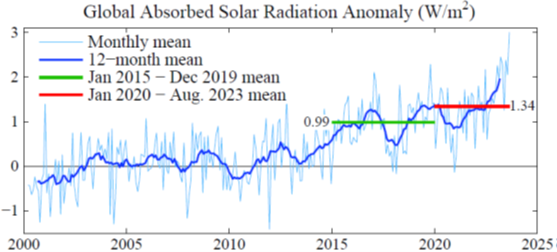
The money chart from the email below. The blue 12-month mean effectively turns the sun up by over 1% in one decade. Given the suns stability that has to be a rare event in the earth's history. Email argues that this is mainly clouds. Hard to tell how much natural variability contributed. We had a hiatus decade, perhaps we are in a surge decade and are near a reversal; or, maybe we flipped a climate switch and there is no turning back. Guessing we will find out quickly as clouds are a fast feedback and natural variability in one direction beyond a decade time scale becomes increasingly unlikely.
-
There are model differences, with GFS forecasting a higher peak relative to the September max vs the euro. For another viewpoint here is year-to-date in one re-analysis product. We'll see how high we get and for how long.
-
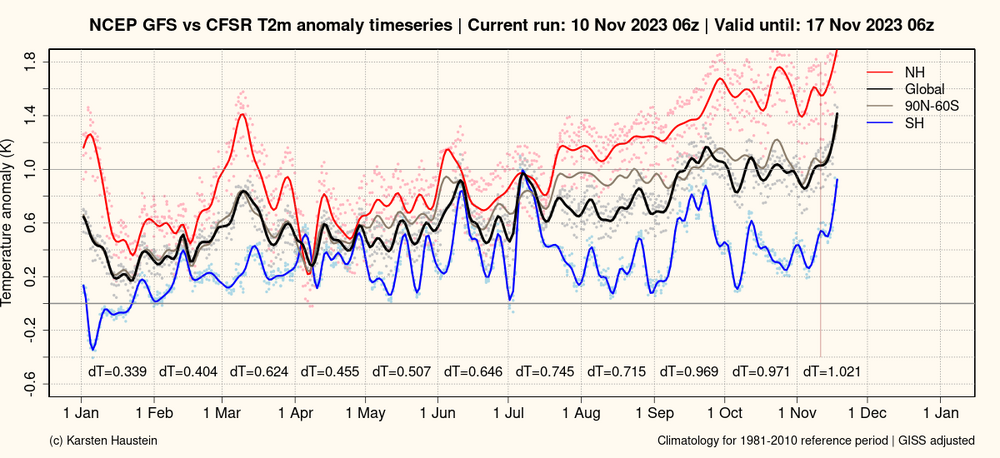
GFS (and euro) predicting another round of record-breaking global temp anomalies later this week. Current nino on track for early 2024 peak in global temperatures.
-
Big mechanism for warming global temps during an el nino is increased water vapor in atmosphere primarily from tropical oceans. Note that this added water swamps water from HT volcano as stratosphere is only 1% of atmospheric water. Any HT water in troposphere is long gone as lifetime is only a couple of weeks at best.

-
Report: Another Year of Record Heat for the Oceans
chubbs replied to donsutherland1's topic in Climate Change
Interesting, shows we need to consider aerosols as well as CO2 in understanding man-made climate change, particularly short-term trends which may not have much staying power, if aerosol driven. One quick thought: aerosols apparently contributed to WPac warming and increased frequency of Modoki ninos and perhaps helped our winter snow. -
Report: Another Year of Record Heat for the Oceans
chubbs replied to donsutherland1's topic in Climate Change
Will take a while to sort out the ramifications of this years temperature spike. A spike is unsettling when there is uncertainty about climate sensitivity. We are running a big science experiment._X.thumb.png.9c07868d3f96d0a196f1aeb9f60833cc.png)
-
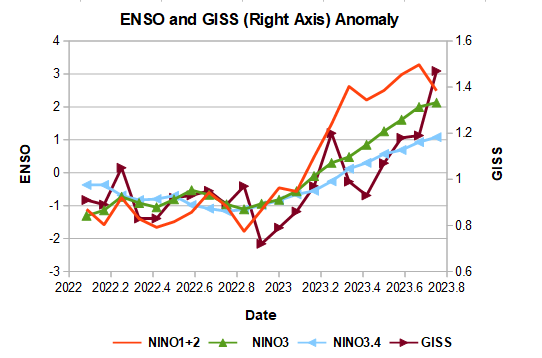
By far the biggest change between this year and last year is enso. Per chart below, the timing of the GISS warming also matches enso with a slight lag. As I posted upthread this nino packs an extra punch due to the strong far E Pac warming.
-
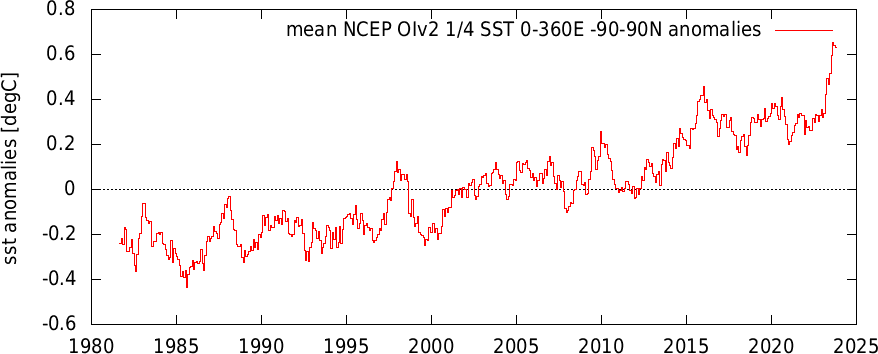
Updated Oisst through October. Topping out as ONI also nears a max.
-
The water from the volcano went into the stratosphere not the troposphere. Plus the lifetime of water vapor in the troposphere is much shorter than the stratosphere, on the order of a week or two. Any water from the volcano that went into the troposphere is long gone. Increased water in the troposphere this year vs last year is a feedback to increased ocean and atmospheric temperatures. In the long-term, increased water vapor in the atmosphere from global warming swamps the volcano. The cold stratosphere can't hold much water. 99% of atmospheric water vapor is in the troposphere which now holds roughly 10% more water due to global warming ( 1.3C x 7% more water per degree warming).
-
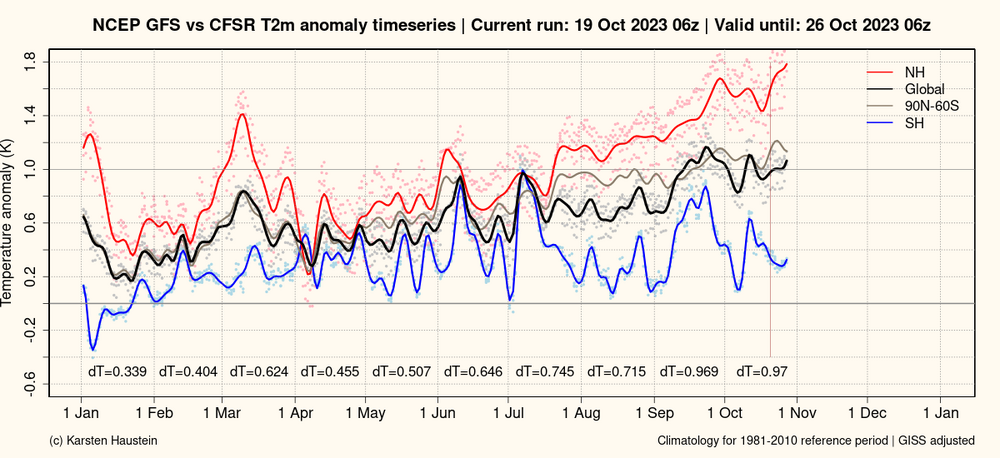
October is running close to September at Haustein's site. Northern Hemi in particular is toasty, while SHemi has cooled since September. October looks a little cooler vs September in the other re-analysis series. We'll see.
-
Yes a long way from frost free; but for winter temperature Boston has become New York and New York is well on the way to Richmond. 1951-1980 2014-2023 Boston 31.7 33.7 New York CTP 33.8 37.1 Richmond Apt 38.4 41.9
-
One factor that could help explain the recent rise in TOA flux and this years temperature spike is underestimation of aerosol cooling impacts. There is a wide uncertainty band for aerosol cooling. Could be that aerosols impacts are in the upper portion of the band and have been suppressing GHG warming to a greater extent than expected. Most of the recent TOA flux increase is increased solar radiation hitting the surface consistent with reduced aerosol impact. Now that aerosol emissions are decreasing, GHG warming is realized to a greater extent and TOA flux and temperature are responding. We will need to see an updated scientific assessment to be sure.
-
Here's a Youtube of a recent hour long seminar on Hunga Tonga. The climate part starts at the 40 minute mark. tl:dr - the net impact is a very small cooling as aerosol effects balance water vapor.
-
Wow. Way above recent mod+ nino Septembers: Sept 1997: -0.11 Sept. 2002: 0.04 Sept 2009: 0.10 Sept 2015: 0.09
-
Interesting to look at the differences between ninos in chart above. 2009/10 had a large drop in TOA flux while 15/16 had a small increase. Hopefully we get a good explanation for this years TOA Flux and temperature spikes. A couple of reasons why TOA flux wouldn't neccessarily track surface temperature: 1) Radiation leaves the earth from the upper troposphere. If the atmosphere is stable, surface warming may not increase outgoing radiation much. This enso is east-based and the east Pacific has cooler waters and a stable atmosphere; 2) Positive feedbacks kick-in with warming, increased water vapor and decreased low-level clouds. Again low-level cloud effects are maximized in E Pac.
-
-
-
September has a good shot at breaking the GISS anomaly record of 1.37 set in Feb 2016. Sept 2015 was "only" 0.85 on GISS. Most of the nino warming was still to come at this point of the 2015/16 cycle.
-
Report: Another Year of Record Heat for the Oceans
chubbs replied to donsutherland1's topic in Climate Change
A particularly large rise in OHC in 2022 per small chart in upper left. The global temp records we are seeing this year aren't surprising, given the nina-related warmth stored in the ocean the past couple of years. -
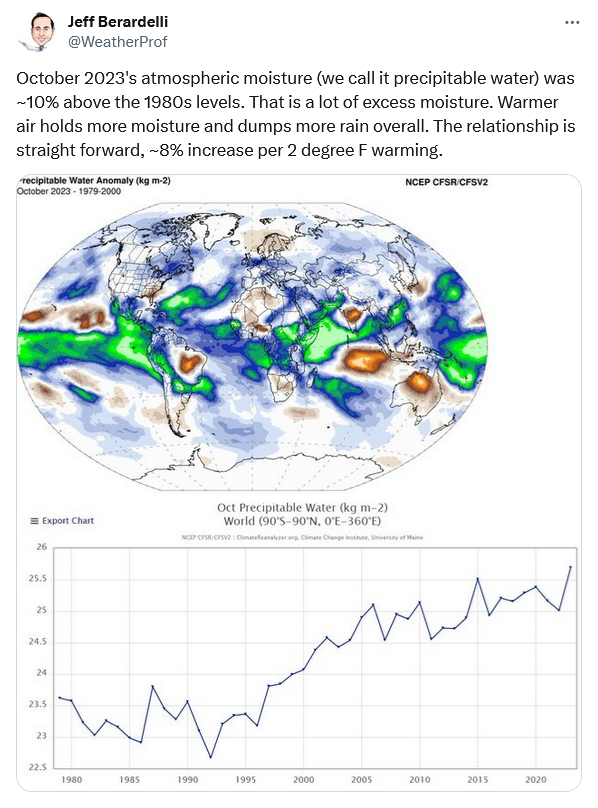
A simple explanation of role of water vapor in climate change from a climate expert: "So these changes mean that where it is not raining, drought and wildfire risk increase, but where it is raining, it pours." https://www.theclimatebrink.com/p/how-rising-water-vapour-in-the-atmosphere
-
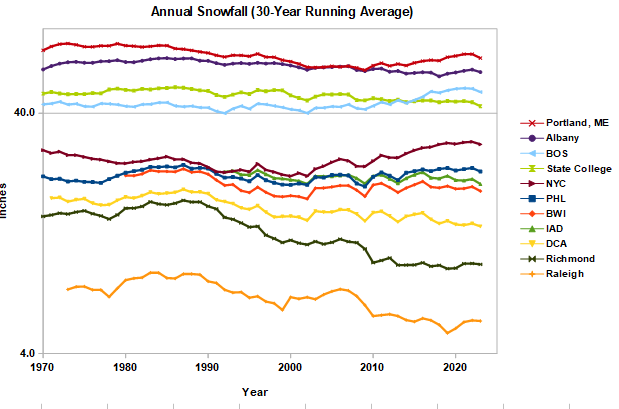
Good discussion about CC impacts on northeast snow above. Here is my two cents. A couple of general comments first: 1) As mentioned above you have to be careful evaluating recent trends. Snowfall is highly variable year-to-year and decade-to-decade in the northeast. 2) Climate change is ongoing. If we want a centered 30-year average to get 2023 snowfall climatology we are going to have to wait till 2038. This is problematic because snowfall is becoming even more variable. Per 2018 paper linked below we shouldn't expect big climate impacts on northeast US storm tracks. In addition we aren't going to see significant negative climate impacts on big snowstorms, they may even become heavier; but, we will steadily lose lighter snow events as conditions that allow snow become more infrequent. In general this agrees with recent experience. https://agupubs.onlinelibrary.wiley.com/doi/pdfdirect/10.1029/2018GL079820 Now for some data. Below are running 30-year average snow for I95 and a few inland sites. The chart is on a log scale so cities with heavier snow don't dominate and to highlight percentage changes. I would group the chart into two main baskets. There is a northern group with mixed trends, coastal generally doing better than inland in recent decades; and, there is a southern group that is in long-term decline. My interpretation is that the negative impact of loosing potential snow days overcomes other climate change impacts at the southern sites. If you are a snow lover, the data indicates that you don't want to get warmer than Richmond was 1960-1990. Unfortunately we will get to test this theory at additional sites this decade. We'll see if it holds up.
-
Yes, CFS anomalies holding near high for year past 5 days. Only brief periods in Feb 2016 and feb 2020 were higher than 2023 spikes. Late winter is typically when the highest anomalies occur. The late winter spikes this year are going to come off a much higher base.
-
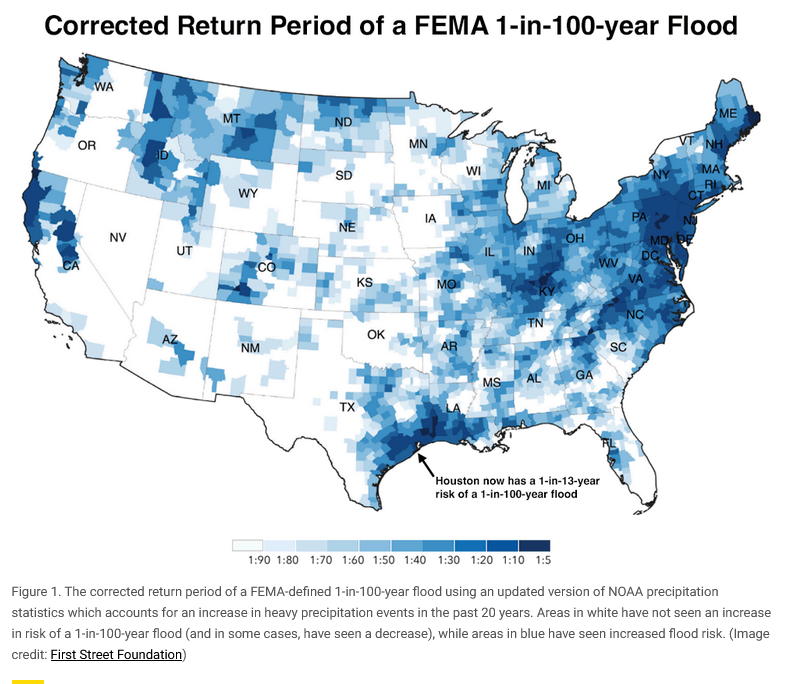
Below is good link for US flood risk info. FEMA risk # need an update https://yaleclimateconnections.org/2023/07/30-great-tools-to-determine-your-flood-risk-in-the-u-s/


_X.png.b10b24fb4368e28f27ec9357969dd5c0.png)