Random Chaos
-
Posts
876 -
Joined
-
Last visited
Content Type
Profiles
Blogs
Forums
American Weather
Media Demo
Store
Gallery
Everything posted by Random Chaos
-
I wonder, have there been any studies on the accuracy of a model at medium to long range when run at different resolutions? It seems to me that both the Euro and GFS were better at the 5+ day range (more consistent run-to-run) back before the resolution upgrades that started a number of years back. I’m bringing this up because the EPS and GEFS are run at lower resolution and both have eastern tracks vs the op. Wondering if errors are getting amplified at range with these higher resolution models.
-
I’ll take P15.
-
Clearly you need to drive more around the DC area after a storm
-
Sorry, yes, bwi: https://meteor.geol.iastate.edu/~ckarsten/cobb/cobb.php?model=namm&site=kbwi
-
I’ll take the COBB output! NAM 18z: 220107/0700Z 13 35007KT 30.5F SNOW 9:1| 0.1|| 0.00|| 0.00|| 0.009 9:1| 0.1|| 0.00|| 0.00|| 0.01 100| 0| 0 220107/0800Z 14 32009KT 30.5F SNOW 20:1| 2.4|| 0.00|| 0.00|| 0.120 19:1| 2.5|| 0.00|| 0.00|| 0.13 100| 0| 0 220107/0900Z 15 32008KT 30.5F SNOW 27:1| 1.8|| 0.00|| 0.00|| 0.066 22:1| 4.2|| 0.00|| 0.00|| 0.20 100| 0| 0 220107/1000Z 16 32009KT 30.3F SNOW 20:1| 0.8|| 0.00|| 0.00|| 0.041 21:1| 5.1|| 0.00|| 0.00|| 0.24 100| 0| 0 220107/1100Z 17 31010KT 30.1F SNOW 9:1| 0.1|| 0.00|| 0.00|| 0.006 21:1| 5.1|| 0.00|| 0.00|| 0.24 100| 0| 0 27:1 ratios, here we come!
-
I’m hanging my hope on insane ratios to turn that turd of a GFS run into a crushing blow!
-
RGEM keeps hope alive!
-
Saw this on WTOP: Eastbound U.S. 50 before I-97 is closed. One lane is open westbound. Tractor-trailers have jackknifed.
-
Wind driven wet snow has given me 2" on vertical surfaces on the windward side of posts, while the ground has maybe half an inch total.
-
US 50 in Annapolis down to one track through snow: https://chart.maryland.gov/video/video.php?feed=7e01ec5800f700d700437a45351f0214
-
34.4/33.1 Temperatures finally caving to the snow rate in last 30 minutes. White coating on everything now.
-
Looking at traffic cams, US 50 in Annapolis now snow covered.
-
36.3/34.7 - 100 feet offshore / 120 feet from house 33/?? - at house That’s an incredible 3F delta in 120 feet! Chesapeake Bay is still very warm, but rates overcoming temps and starting to see sticking.
-
36.3/34.5 25mph NNE wind SN+ big fat flakes going completely sideways. Nothing sticking yet.
-
43.8/37.4 Winds 18mph NNE Note that the dips in temperature earlier were wind direction changes between off-land and off-Chesapeake Bay.
-
Why are we not in storm mode? As funny as it is, this banter is getting distracting.
-
50.7/42.4 15mph N/NNW wind Temp still falling.
-
For all the people that are talking about "cant have snow after a 60 degree day" back in college I had a upper 70's day followed by 16" of snow. This was in NY state not MD, and April not January, but it definitely can happen.
-
Wind is really picking up. Temps not falling yet.
-
Dang, they have a coastal flood advisory up too. Guess no snow. Time to write off winter. Bust. I’ll be back in 2023. *end sarcasm*
-
6 hours ago we were saying: "It's the NAM, don't trust it." now we're saying "It's back on board, storm happening!" How I long for the days when all models were this bad I'll take my 14" and run! -- On another topic, COBB output from GFS was indicating 12:1 ratios on average, with some insanely high 22:1 ratios at times. Any chance that will occur? Typically we see 8:1 around here. Also gale warning on the bay. This is going to be fun!
-
Where is CRAS when you need something to make the NAM look good? At least NAM is on its own for now, but I do worry with these systems where we sit on the northwest side being a cutoff forecast challenge. SREFs look good
-
-
-
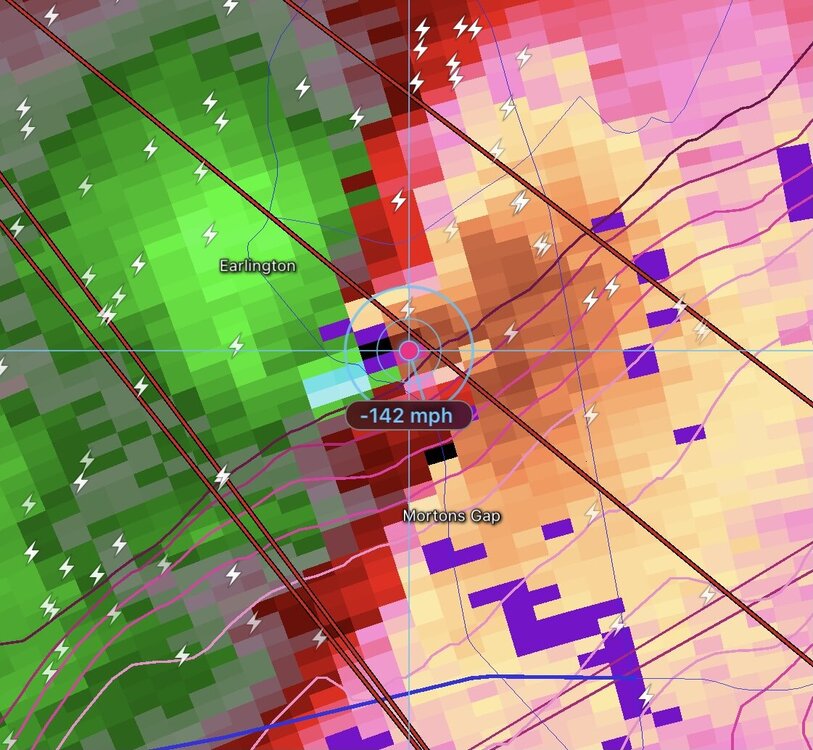
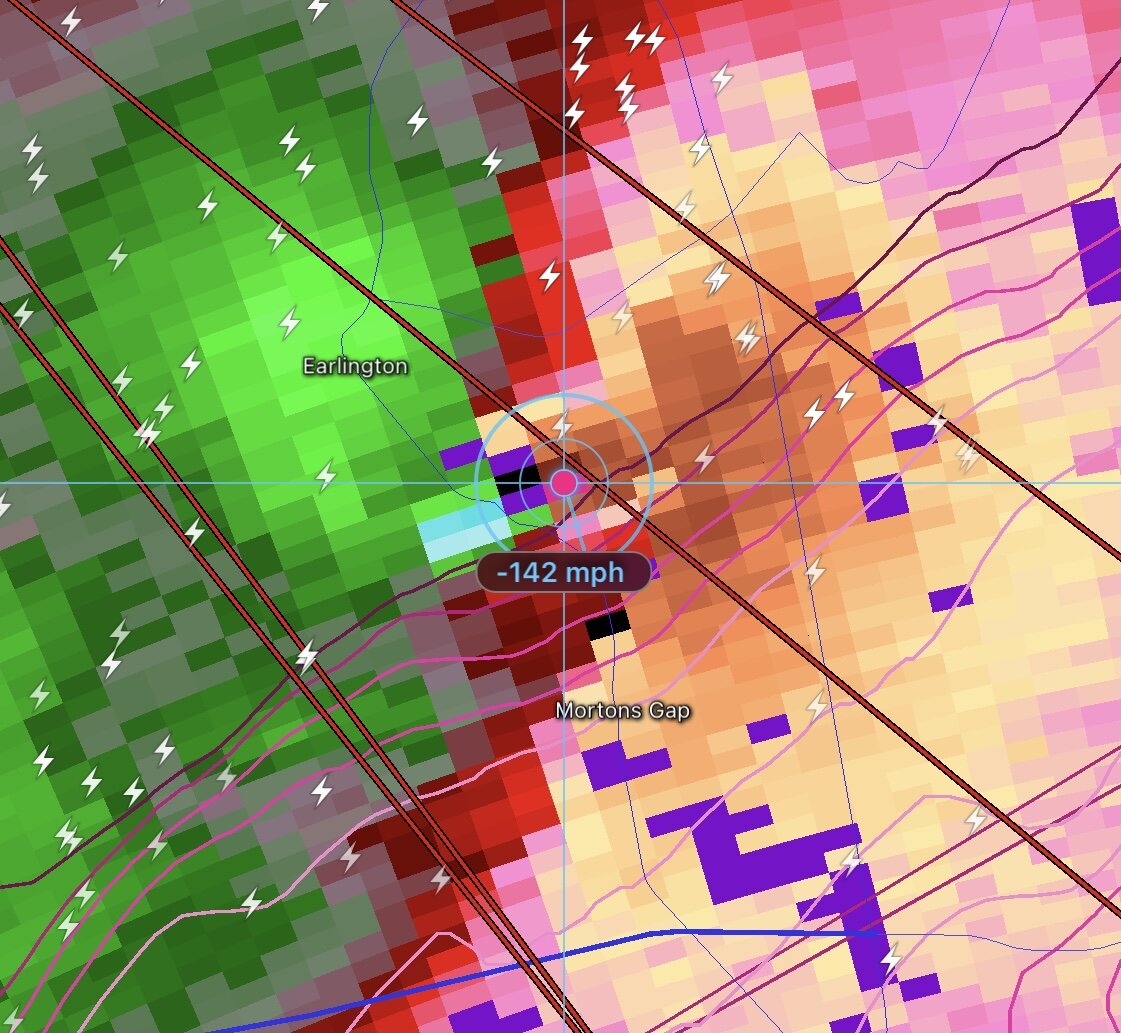
Incredible. This -142mph is right next to a +130mph on radar: