Chinook
-
Posts
11,191 -
Joined
-
Last visited
Content Type
Profiles
Blogs
Forums
American Weather
Media Demo
Store
Gallery
Everything posted by Chinook
-
PDS TORNADO ...A TORNADO WARNING REMAINS IN EFFECT UNTIL 200 PM EDT FOR NORTHEASTERN WAKE AND SOUTHWESTERN FRANKLIN COUNTIES... At 123 PM EDT, a confirmed large and extremely dangerous tornado was located near Wake Forest, or 11 miles northeast of Raleigh, moving northeast at 30 mph. This is a PARTICULARLY DANGEROUS SITUATION. TAKE COVER NOW! HAZARD...Damaging tornado. SOURCE...Radar confirmed tornado. IMPACT...You are in a life-threatening situation. Flying debris may be deadly to those caught without shelter. Mobile homes will be destroyed. Considerable damage to homes, businesses, and vehicles is likely and complete destruction is possible.
-
confirmed tornado ...TORNADO WARNING REMAINS IN EFFECT UNTIL 130 PM EDT FOR SOUTHEASTERN BLADEN AND NORTHWESTERN PENDER COUNTIES... At 103 PM EDT, a tornado producing storm was located over Kelly, or 21 miles northwest of Leland, moving northeast at 35 mph. HAZARD...Damaging tornado. SOURCE...Radar confirmed tornado. IMPACT...Flying debris will be dangerous to those caught without shelter. Mobile homes will be damaged or destroyed. Damage to roofs, windows and vehicles will occur. Tree damage is likely.
-
tornado warning south of Raleigh (Clayton, Smithfield)
-
47 minutes ago- tornado damage near Fayetteville Airport
-
Four tornado warnings in NC
-
There's snow in Montana today, but, I think, rain at Yellowstone National Park
-
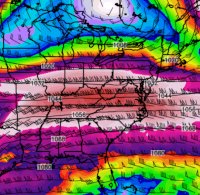
strange 850mb chart for the transition/landfall last night
-
Simple (Hurricane) Simon says: As I was going to St. Ives, I met a man with seven wives. Every wife had seven sacks, every sack had seven cats, every cat had seven kittens. Kittens, cats, sacks, and wives. How many were going to St. Ives? My phone number is 555 and the answer. Call me in 30 seconds or die. Hurricane Simon at 150mph winds at public advisory 12a on October 10th.
-
gust to 83mph at buoy PCBF1 near Panama City Beach FL
-
I'm seeing wind gusts to 61mph at Destin FL. The base velocity from radar has the winds at 104 kt (Northeast to southwest)
-
Pensacola Naval Air Station gust to 51mph
-
This buoy will get close to the eye
-
I think the GFS had a low pressure in a Gulf about a week ago, but there was nothing on the NHC outlook, and then.. nothing, and then.. this.
-
yes, current radars show 110 kt (126.5mph) wind in the clouds at the eyewall, above ground. That's some crazy stuff.
-
tornado warning Apalachicola FL, with larger tornadic supercell out over the open water, as I mentioned
-
tornado over the water, south of Crawfordsville FL
-
Now the NCEP systems have rolled out the RRFS ensemble members (I guess,) and the NAM, for now, has not disappeared.
-
surprise hailstorms in Iowa
-
Yes, I think most of the winds on the latest recon were just about 70kt, if a bit more, and then surface winds should be lower than flight level, by 10 kt. I think the continued pressure of about 978mb supports relatively the same as this morning's recon, which may have had a bit of 75-80kt flight level.
-
recent mountain web cams
-
strange Hurricane Nolo
-
2026-2027 Record-breaking El Nino
Chinook replied to Stormchaserchuck1's topic in Weather Forecasting and Discussion
This is a very good video on the El Nino-powered winter(ish) tornado forecast -
Fall heat wave with approximately 17 deg F above normal coming up for northern Colorado.
-
2026-2027 Record-breaking El Nino
Chinook replied to Stormchaserchuck1's topic in Weather Forecasting and Discussion
I have brought back my 500mb map/ 250mb map archives for general research purposes. I started off doing this a couple of years ago for tracking the jet stream during the El Nino winter a couple of years ago. https://great-lakes-salsite.web.app/Sep_2026_500mb_loop.html https://great-lakes-salsite.web.app/Sep_2026_250mb_loop.html -
over 6" of rain for Amarillo, Dodge City, Manhattan Kansas, and Omaha. 3.98" measured at Santa Fe, NM.