

stadiumwave
-
Posts
1,168 -
Joined
-
Last visited
Content Type
Profiles
Blogs
Forums
American Weather
Media Demo
Store
Gallery
Posts posted by stadiumwave
-
-
Latest CFS Weeklies AO & NAO forecast


As seen above changes begin middle of NOV. 500mb to end NOV through mid-DEC looks good on that update:


-
 4
4
-
-
Golden thread from Eric Webb. I highly encourage a click & read.
-
2
-
-
35 minutes ago, 40/70 Benchmark said:
There are also variations of that....the really good la nina events, like 2010-2011, which is a decent analog, remained favorable through most of January.
Yes, it was February before winter ended.
-
-
6 hours ago, 40/70 Benchmark said:
There are for temp and precip anomalies.
For the Northern Hemisphere or regional? Regional temp & precip may be misleading. I like to look for similar pieces in the entire northern hemisphere.
-
September 1 - October 21 500mb

Can't really find any La Nina years for the same period resembling a match.
-
 1
1
-
-
5 hours ago, 40/70 Benchmark said:
No.
What happened to him? He ok?
-
-
16 hours ago, CoastalWx said:
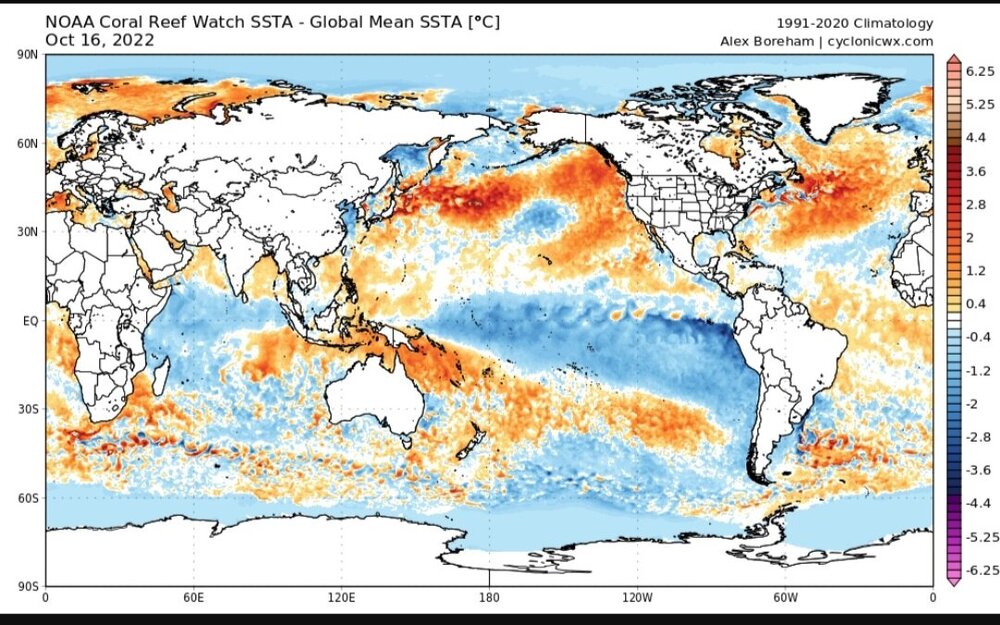
That pool means nothing. It’s a product of the 500mb pattern. That atmosphere is not changing hemispheric patterns because water temps are 53 instead of 49.
The NPAC SSTs are as overhyped as the SAI.
I dunno. The warm blob, -PDO of 2013-14 is thought to have played a role in repeated ridging.
However, like I previously posted...fall SST's in the N Pac fluctuate more drastically than any other time of year. This is usually due to Rosby wave trains. So, fall SST's are not usually a good indication of winter SST's.
Last of all, I generally agree that it's way to heavily weighed on how much of an impact the waters might have when other factors are certainly the greatest forcing mechanisms on the atmosphere.
-
31 minutes ago, Typhoon Tip said:
It also depends on how people read/take in the information. "Attribution studies" shouldn't be disrespected, either - if it's done right, and the chi test is > .05 side blah blah, but the calculatons don't mean 100% causality - in other words, it may not be entirely why, but is at least partial.
That is not well understood, and those that write the papers are careful to point that sort of statistical theory out, but it seems to fail to get across...
I've read posits ... nothing from them were very declarative. Meanwhile, I'm constantly hearing reprisals of other people's work that sounds like 'so and so said this because of that' - which isn't usually what that source stating. This happens a lot. We don't live in an "information responsible" society, not from private sector recounting, not from major media... not much in between, nor for the 'water coolers' either. We've become increasingly irresponsible 'liars' in a lot of ways. Particularly if we need to cherry pick to fit narratives ...and on and on...
Like Ian being a carbon footprint. #bologna
-
1
-
-
1 hour ago, snowman19 said:
If I’m not mistaken I think the official number for September was -2? But yea, it’s not AS negative as it’s been and I agree about it not trending up until the Niña is gone
The number is basically irrelevant at times & this is absolutely one of those. As the other poster said overa it is a -PDO by official measurements. But if you're looking at this & thinking typical -PDO at the moment ...then
 .
.
This is fall & fall SST's can change quickly. So it's not indicative necessarily for winter. However if the warm waters remain in N. PAC & off Cali coast during winter there's going to be a lot of ridging out west regardless if it's "official" -PDO or +PDO. That's the point.
-
2 hours ago, ORH_wxman said:
CC gets blamed for a lot of stuff, and then it gets memory-holed when that "blame" doesn't turn out correct. CC was causing more +NAO/AO in the late 1990s/early 2000s, and then it all of the sudden wasn't....it "changed" and we saw all these papers about low sea ice and -AO/NAO.....then that "changed" too in recent years when had trouble getting big -AO/NAOs. I've actually asked people about this who work in the field and the answer I get is typically something like "there's a lot of pressure to come up with CC attribution studies"....which is understandable, but I wonder if it starts degrading the quality of the research when we try and rush to attribute 5 and 10 year trends (such as with the AO/NAO) to CC. I think the law of large numbers isn't appreciated enough on some of this stuff....hard to get really confident answers when you are using sample sizes in the low 10s.
The only truly robust CC signal we have on winters is warmer temperatures overall (and especially low temperatures), though the temporal/spacial variation is still very large (see central Canada/N plains/N Rockies with a 30 year cooling trend in winter).
There's zero doubt! And sadly, there's plenty of grant money available "depending" on the nature of your study. This will bite us at some point.
The truth is, taking into consideration what you posted we really need to understand while we strive to understand we just simply do not know as much as we would like to think we do.
Makes you wonder what else we'll be wrong about? Very important not to make knee jerk reactions to every "new" study.
-
2
-
-
JMA updated...models kind of looking stellar for NOV & then DJF kind of looks like a blend of 2020-21 & 2021-22.
NOV
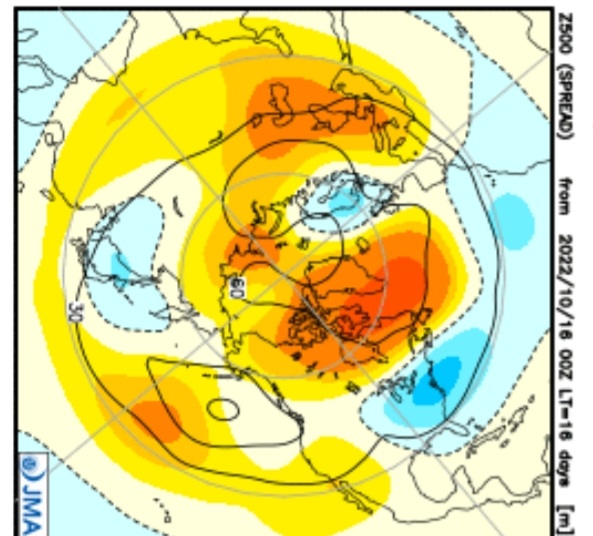
DEC

JAN

DJF

Kind of a blend of 2020-21, 2021-22 with mean trough a little further west.

Now the JMA mean pattern is similar to the upcoming pattern & it could be the monthly & seasonal model output is heavily influenced by that. It happens. Or it could be the upcoming pattern is very much indicative of the winter mean pattern.
Personally I still think it's too early to know. I lean towards some of NOV & maybe early DEC could be colder pattern & then who knows after that.
One of the key players is what will the PDO do. Right now it's positive but really means nothing as of yet, it can change in a hurry as Fall N. Pac SST's can fluctuate greatly. I think if we get the earlier peak of La Nina the transition towards +ENSO may be pretty quick & hold some +PDO. We'll see.
-
1
-
-
38 minutes ago, 40/70 Benchmark said:
Well, to be fair, we've had a warm ENSO that acted like a cold ENSO, a torch el nino and triple dip la nina. I think he is very good, but just acts like a complete jerk with some sort of personality disorder(s).
But he has not always been correct which I attribute a little to being subjectively biased. I like the data he shares but often disagree with his conclusion of the data.
Now i know very few are correct very often, but I'm referring not just with seasonal forecasting but in season developments.
-
7 hours ago, sebastiaan1973 said:
The Chinese and English seasonal models. Update.
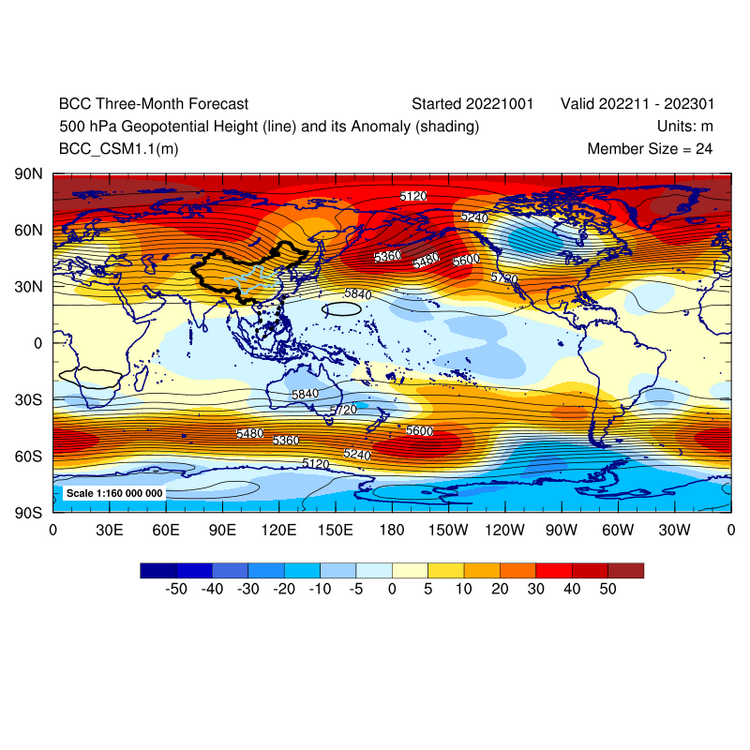
Could you share the link to this? Thanks
-
On 10/10/2022 at 1:29 AM, 40/70 Benchmark said:
Normally I'd drop in that thread to compliment his work and try to spark some discussion, but I'm just done. It's a lost cause.
I've followed his forecast for the last 4-5 years on another forum. I've yet to see him not predict a great winter for the SW & specifically Albuquerque, which is where he lives. Always has east warm...no matter the criteria it always = warm east & cold west.
-
1
-
-
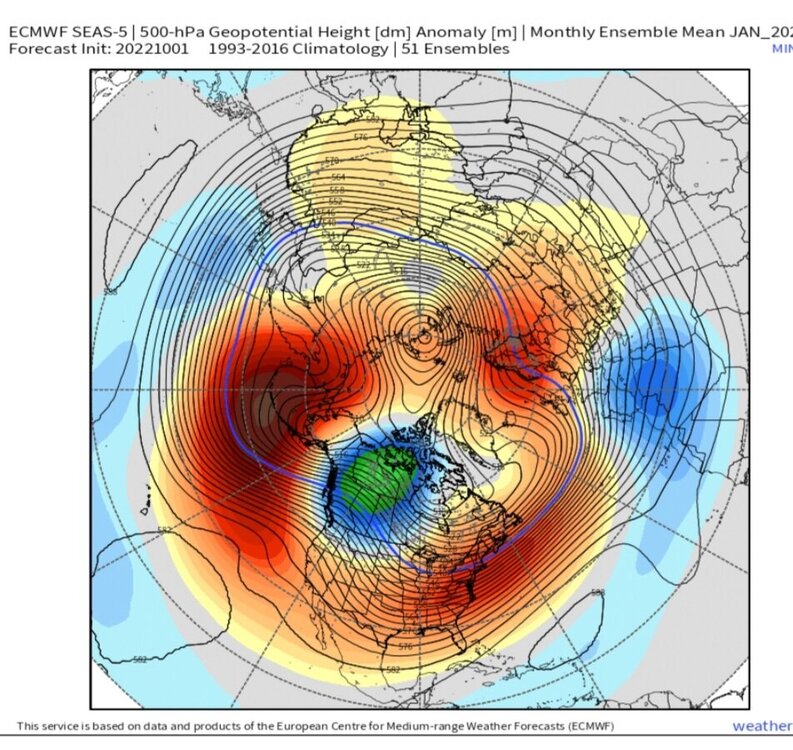
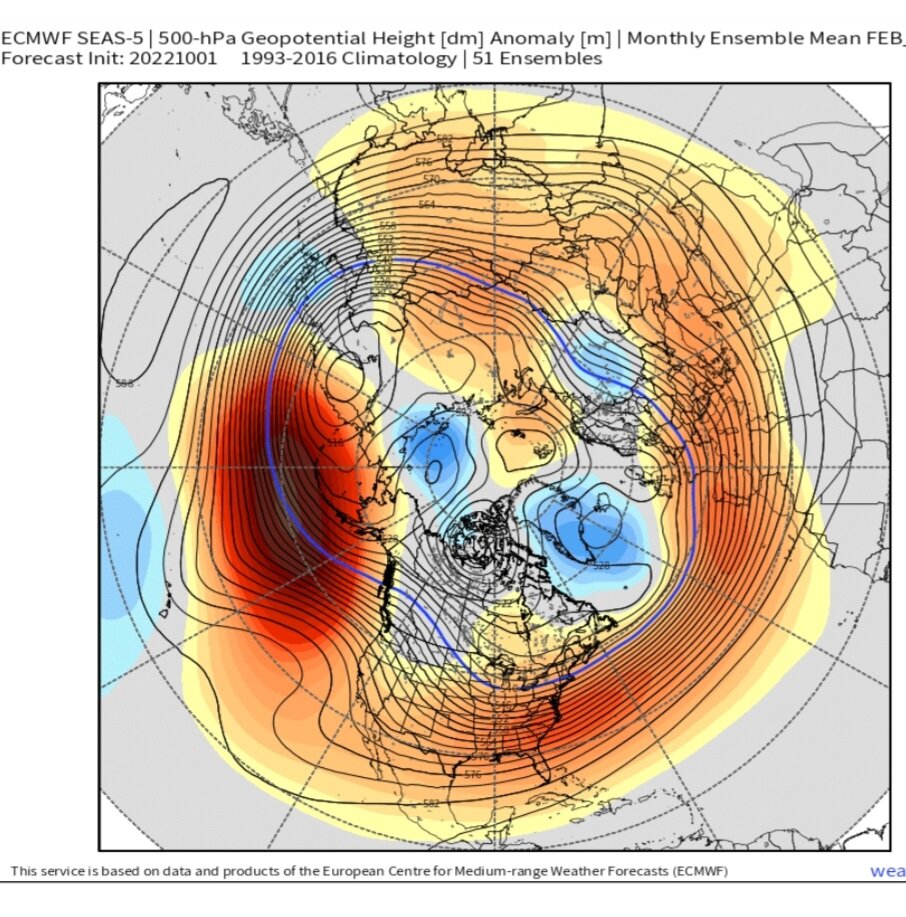
JAN...keep in mind it's a monthly mean. So, that particular run is probably the tail of 2 halves of JAN by looking at FEB. Probably 1st half of Jan similar to periods of DEC & 2nd half of JAN with periods FEB looking.
Keep in mind this is simply seasonal guidance & absolutely none of them have massively high skill except for OCT. Next month NOV & so on. However, we can spot strong signal features that may be hints of something to consider.
JAN
FEB

-
1
-
-
1 minute ago, WinterWolf said:
I think 10-11 was a Nina…that was a fabulous winter.
MJO is similar to that fall although that MJO wave was much stronger.
-
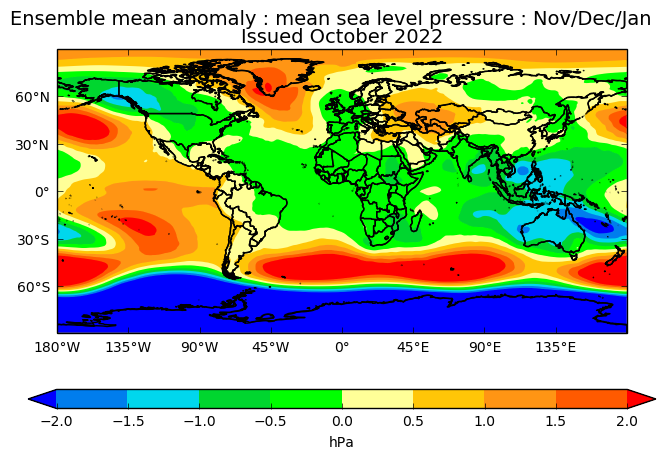
European model updated
Nov & Dec look good. Strong -NAO
NOV

DEC

We might have a fun Dec afterall if that verifies. Jan & Feb look like crap but plenty of time for that to change.
I'm as optimistic for an earlier start to winter as I've been in a long while. This kind of enhanced my thoughts over the last month.
-
2
-
-
I seem to recall several almost promising there's no way we would not have a total Arctic Sea summer melt by 2020. Go read the forum in 2012.
I'd say everyone is a little lousy at climate predictions. All that's ever remembered are the misses of the opponent.
Humility is good for all!
-
1
-
-
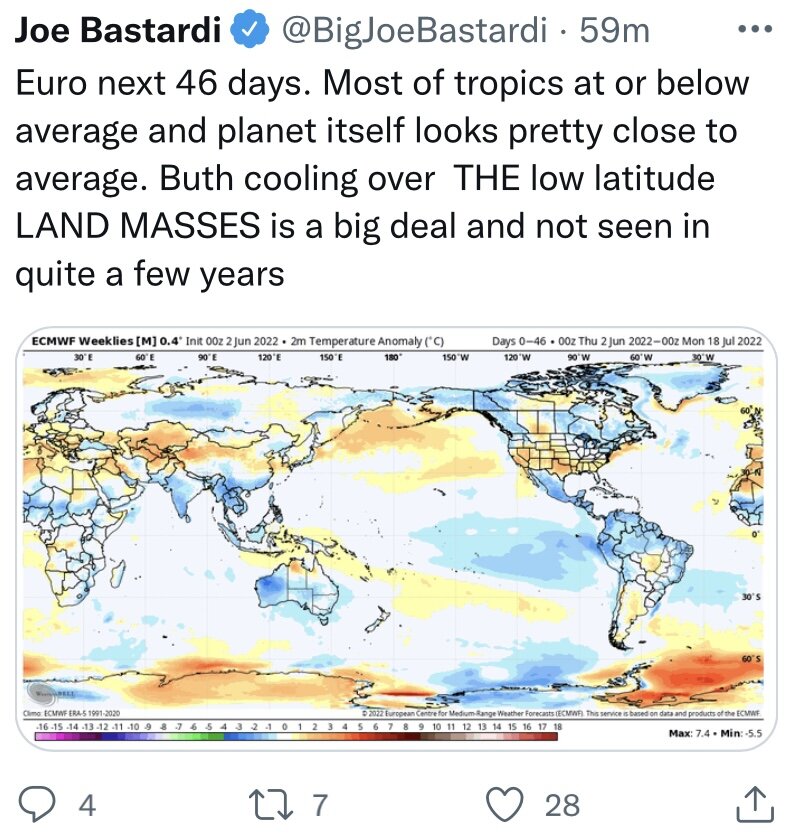
On 6/4/2022 at 11:34 AM, donsutherland1 said:
From Twitter: “Disappearing” the warming.
The trick: Use the model’s 1991-2020 baseline without disclosing that baseline is much warmer than those used by the major climate records (GISS, NCDC, Berkeley, HadCrut, etc.).
What appears as normal is actually well above normal in the climate record.

Everyone has a "trick" on both sides. Just being honest.
-
1
-
-
Cool ENSO is still what the LR models are predicting. Some moderate La Nina. CFS is the warmest ENSO & even it has trended somewhat cooler with July update. A lot of mixed signals apart from the LR models.
-
-
Shared this several days ago on another forum:
Saw something interesting. My #1 analog in my blend for DEC was 1984.
Here is Cansips DEC forecast on top with DEC 1984 underneath


MJO in DEC, 1984 was 3,4,5,6...blue line

Very similar to the MJO forecast for this DEC although we might get to phase 7 sooner.
Late DEC, 1984 had a SSW. JAN MJO went into COD, then 7,8,1,2. JAN, 1985 - 500mb:


Certainly I'm not saying we have a replica of JAN, 1985 coming but I am wondering if a late DEC SSW prediction & colder JAN is a distinct possibility??
The progression of DEC is eerily similar. Here is DEC 15-20, 1984:

Here is 0z GEFS for DEC 18:

The SSW in 1984 occurred on DEC 29. Progression of strat from DEC 20 on is below:

Graph is from this great paper on that particular SSW:
END OF POST
________________________________________________________
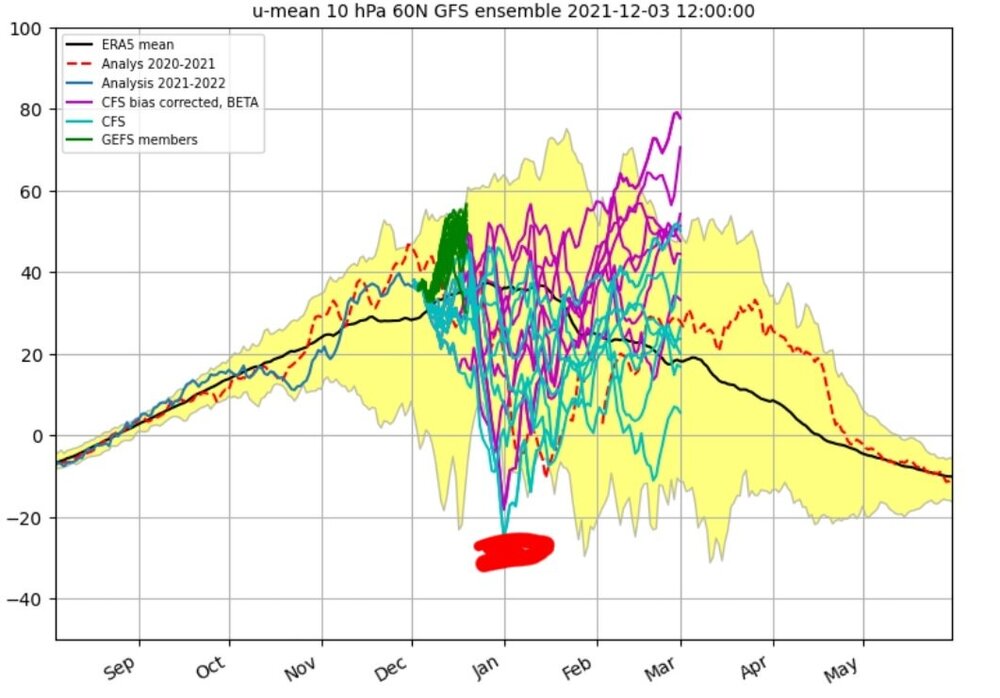
Now since that post CFS is predicting a SSW at the end of month & Simon Lee pointed out on twitter that the EPS is predicting a weakening of PV. just something watch right now.
-
1
-


Winter 2022-2023 Conjecture
in New England
Posted
Models are busting bad on the MJO. They liked to have never come around to the fact it would make it out of phase 7. But even when they came around they've had it barely in Phase 8 & headed to the COD. Well...its still chugging along.
I'd disregard LR modeling with models not getting MJO correct...and that will be reflected in models. Hopefully that get a better hunch of what's MJO is going to do.