All Activity
- Yesterday
-

July 2025 Obs/Disco ... possible historic month for heat
powderfreak replied to Typhoon Tip's topic in New England
I get it, it’s kind of a sickness. I’ll do the same in the mtns. Like shitty windy misery mist day, could just stay home… but end up going out for a couple hours and get back to the car raw, cold, wet like “well, that was dumb but I still sort of enjoyed it” in a twisted way. -

July 2025 Obs/Disco ... possible historic month for heat
Damage In Tolland replied to Typhoon Tip's topic in New England
My least favorite runs are when it’s anything below about 20 degrees with a lot of wind. I’ve run countless times in single digits or even lower with wind and it’s miserable . Typically will draw the line if it’s zero or dangerous wind chill. My second least favorite is cold rain. I ran the HFD marathon one October in 44 degree rains the entire time and it was pretty much the coldest I have ever been . I was shivering for hours after . Sweating running, but cold rains.. soaked to the bone . I had to sit in the truck for like 30 minutes before I was able to drive safely -
July 2025 Obs/Disco ... possible historic month for heat
powderfreak replied to Typhoon Tip's topic in New England
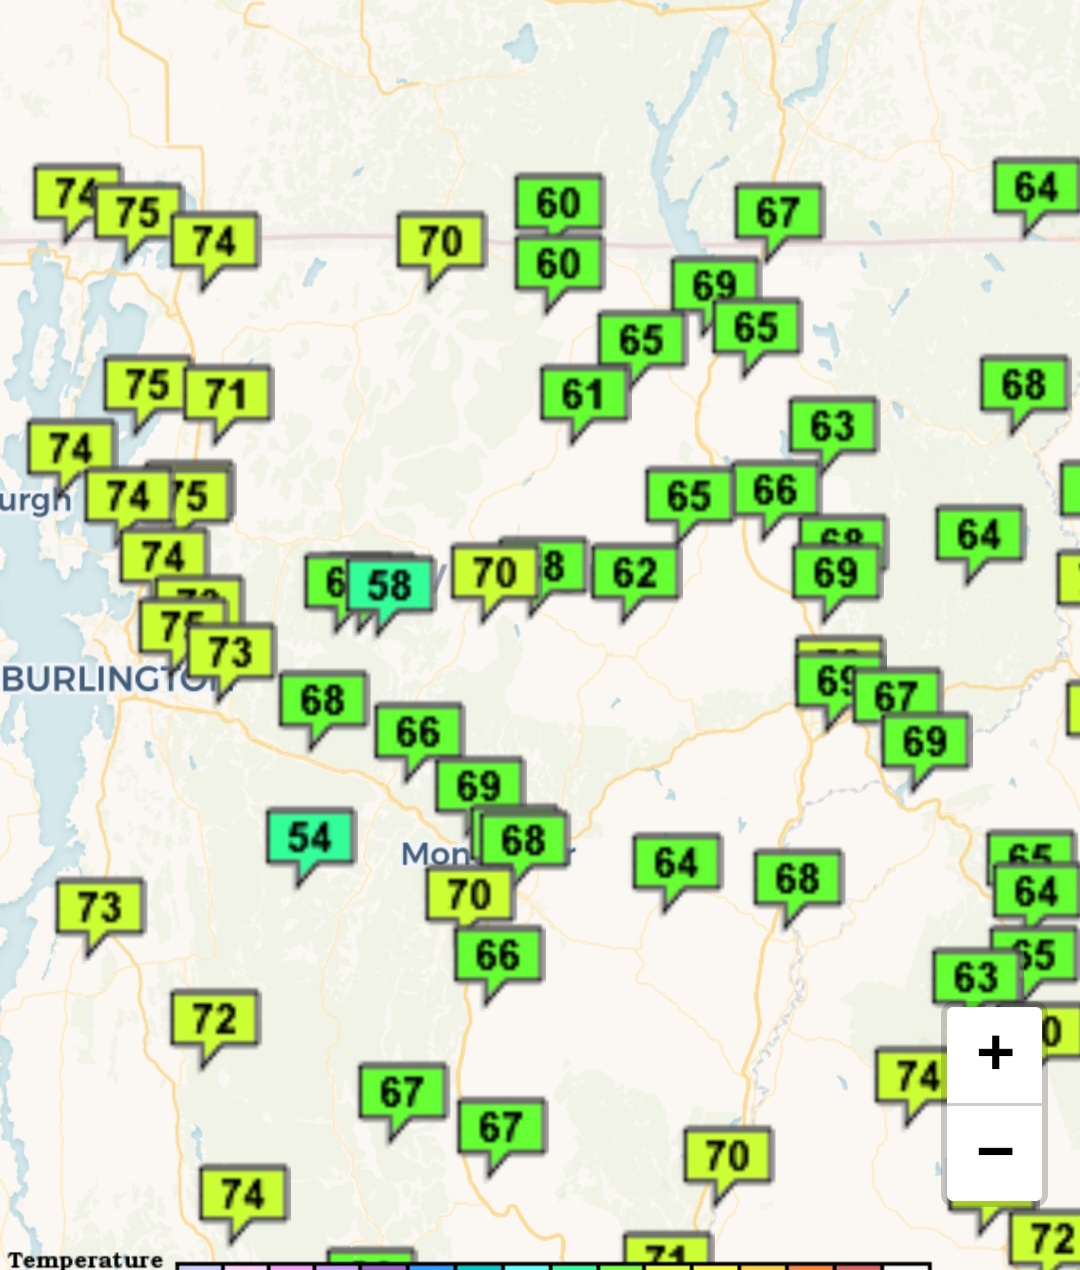
Ha that comment struck a nerve. BTV is the coldest site in the state relative to normal because it doesn’t radiate to begin with. I think I’m pretty consistent in posting both the interior sites and BTV. C’mon, you know BOS isn’t indicative of much except the first few miles of the coast. Even the BTV ASOS is 3-4 miles away from water. July… MVL +6.5 MPV +6.2 1V4 +6.0 BTV +4.4 -
July 2025 Obs/Disco ... possible historic month for heat
powderfreak replied to Typhoon Tip's topic in New England
Ha, I’m with on that. In the dews this summer I’ve had to have a sweat rag at times too and have noticed more and more people out there carrying something to wipe face and head. It does feel like a good 3-5 miles out there can lose a pound of water/sweat per mile when dews are over like 67F. -

July 2025 Obs/Disco ... possible historic month for heat
kdxken replied to Typhoon Tip's topic in New England
Especially the one on a 500 square mile lake. True representation of Vermont?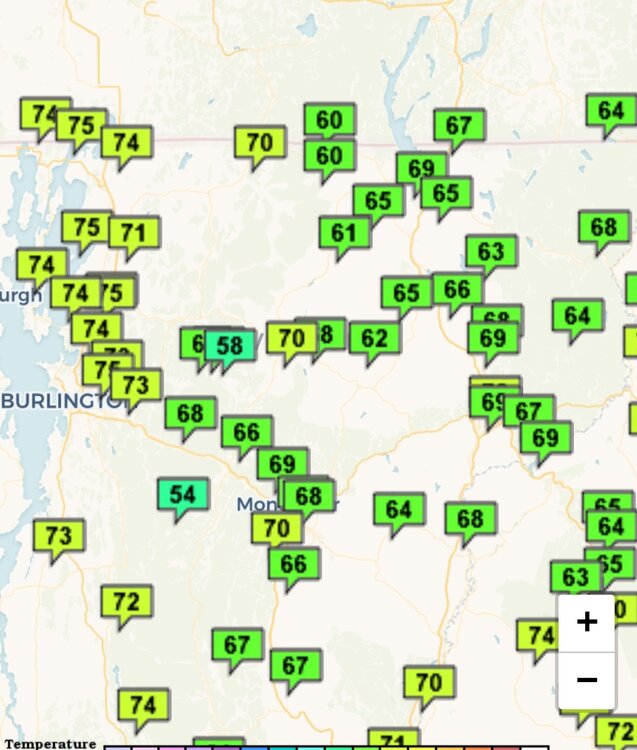
-
.23 today earlier and heavy thunder with big storms to my west
-
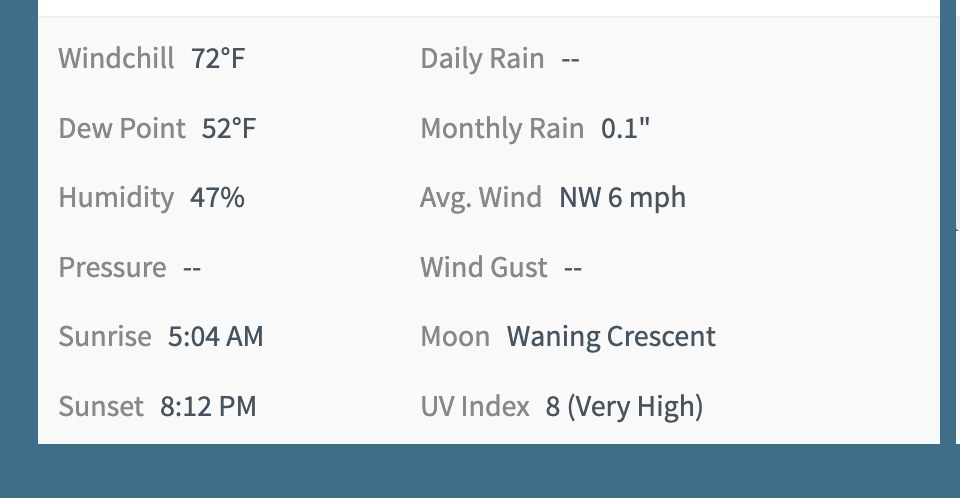
Seeing wind chill listed in the summer looks kinda funny, lol
-
July 2025 Obs/Disco ... possible historic month for heat
Damage In Tolland replied to Typhoon Tip's topic in New England
Well typically Fridays are off days for me on running so today not good example . I will say initially after the winter .. as we move into summer.. the first few runs are harder because the body isn’t acclimated yet. Same thing on the first few cold runs . The past few weeks have been fun because I love the dews. I sweat probably more than the average human and always have. I ran 4 miles yesterday morning lost 3 lbs in water weight, and carry a sweat rag to wipe sweat out of my eyes / face . I’ll run 5 tomorrow morning and will be thinking the whole time about the higher dews coming back in the afternoon -
everyone in the mid-atl forum should head to maine; now. 72/52; absolute bliss.

-

July 2025 Obs/Disco ... possible historic month for heat
ineedsnow replied to Typhoon Tip's topic in New England
yes I have you just don't notice it because you see hot and humid and don't think twice.. -
July 2025 Obs/Disco ... possible historic month for heat
kdxken replied to Typhoon Tip's topic in New England
Yep, it's par for the course these days. Doesn't get real hot and doesn't get real cold because of all the moisture in the air. -
July 2025 Obs/Disco ... possible historic month for heat
Damage In Tolland replied to Typhoon Tip's topic in New England
You’ve never once made a post like” damn the next couple days or weeks look hot and humid” Or “ there’s just no normal or BN in sight “ It’s always that an op run shows purple colors -
July 2025 Obs/Disco ... possible historic month for heat
ineedsnow replied to Typhoon Tip's topic in New England
I already did and I've said back in this thread it looks around average with some hot humid days and some cooler days.. -
.thumb.png.4150b06c63a21f61052e47a612bf1818.png)
July 2025 Obs/Disco ... possible historic month for heat
HIPPYVALLEY replied to Typhoon Tip's topic in New England
My area would’ve had several heat waves by now if it hadn’t been for the constant clouds. No rain of course, just clouds. -
July 2025 Obs/Disco ... possible historic month for heat
powderfreak replied to Typhoon Tip's topic in New England
Do you find you run better in drier air? I hike after work on days I don’t lift, and I find I can shave time off the route fairly significantly on days like today. Like a usual 46-48 minute up and 34 minute down in the heat and humidity (roughly 4-5pm)… turned into 41 minutes up and 30 minutes down today. I was wondering today if folks like you see an uptick in aerobic speed in this weather. Though you hit it early AM. -
July 2025 Obs/Disco ... possible historic month for heat
Damage In Tolland replied to Typhoon Tip's topic in New England
Why do you assume that is right? Why not look deeper? -
July 2025 Obs/Disco ... possible historic month for heat
ineedsnow replied to Typhoon Tip's topic in New England
once again wrong.. I've said plenty of times I look at everything.. I've never seen you post anything except Twitter maps and tweets -
July 2025 Obs/Disco ... possible historic month for heat
ineedsnow replied to Typhoon Tip's topic in New England
-
July 2025 Obs/Disco ... possible historic month for heat
Damage In Tolland replied to Typhoon Tip's topic in New England
Your problem all stems from looking at and basing your ideas on op runs . That’s why you missed the Wednesday and beyond furnace and high dews next week -
July 2025 Obs/Disco ... possible historic month for heat
Damage In Tolland replied to Typhoon Tip's topic in New England
What are you basing that on? Do you have stats? Where do ORH , BTV, BDL stand now ? -
July 2025 Obs/Disco ... possible historic month for heat
ineedsnow replied to Typhoon Tip's topic in New England
because it doesn't... Why cant you just admit your going to be wrong about the hottest Summer ever? I admit when I'm wrong.. you try to spin it -
July 2025 Obs/Disco ... possible historic month for heat
Damage In Tolland replied to Typhoon Tip's topic in New England
Serious question here. Why is it so difficult for you to admit the pattern the next month and a half looks mainly hit and humid? Or even the next 14-21 days? Everything points to and ensembles show a ton of high humidity and a warm to hot pattern. Why can’t you just say. “ damn it is going to be hot and humid overall the next month to month and a half” . Obviously it’s not what you want.. but why can’t you be realistic? I mean in the winter.. I want snow and cold , but I don’t look at a mild pattern modeled and say it’s going to be heavy snow and cold -
July 2025 Obs/Disco ... possible historic month for heat
ineedsnow replied to Typhoon Tip's topic in New England
Lol I did.. it's tough to get to get a top 10 July when you have below normal days.. and this summer won't be top 10 -
July 2025 Obs/Disco ... possible historic month for heat
powderfreak replied to Typhoon Tip's topic in New England
Yeah better… but BOS is as relevant to ineedsnow as ALB is. -
July 2025 Obs/Disco ... possible historic month for heat
kdxken replied to Typhoon Tip's topic in New England
What the hell went on in 1983 that they had 30 days of 90° or better? Maybe somebody can wake Will from this hibernation.