CoolHandMike
-
Posts
1,652 -
Joined
-
Last visited
Content Type
Profiles
Blogs
Forums
American Weather
Media Demo
Store
Gallery
Everything posted by CoolHandMike
-
Supposed TOR passed close to my parent's place down near Lincoln U. TOO close. That cell was trudging straight east out of Quarryville and then turned to the SE with a definite couplet visible on relative velocity. I actually called my mom to make sure they were ok. I would not be surprised if there's storm damage and possibly a track across Rt. 1 near the 896 exit. Guess we'll find out tomorrow, though I'm not seeing anything on CAD (https://www.chesco.org/3963/WebCad-Active-Incidents) so maybe it never touched down at all. Still, scary stuff. Oh, and I'm at .14" for the day. On the third day of previously forecasted, all-day rain and storms. What a joke. Something's wrong--predictability has absolutely gone down the toilet.
-
WTF is wrong with forecasting these days. As of 9pm last night our local forecast was wall-to-wall rain all day today, and before that, on Friday, it was forecasted to be rainy all weekend. We got a passing shower last night around midnight that dropped a whopping .01". Right now at 8am it's sunny with some clouds, and the nearest rain on radar is in western PA. Forecasting with any accuracy on a day-to-day basis with regular weather (barring large-scale events, like tropical storms) seems to be completely out to lunch. I don't think our current models are calibrated to deal with the current status of our climate. Maybe it's always been this way and I'm just now noticing it, but I don't think so. I've been an avid weather nerd for over a decade and this whole thing just seems off to me somehow. Yeah I may kvetch about individual storm cells missing my back yard on the regular, but it seems to me that day-to-day predictability has gone down the tubes in recent years. I'm genuinely curious if any of our local mets on here have any thoughts regarding this.
-
Bold statement, for sure. I'm still waiting to see if the climatological fallout from that Hunga Tonga eruption in December 2021 will cause a measurable effect in northern hemispheric weather over the course of the year.
-
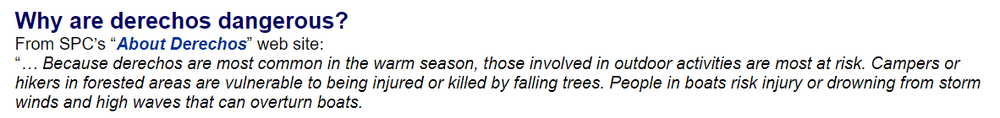
Hope you guys don't mind me lurking here all day from the Philly area forum, but I'm glad you guys made it through (mostly) unscathed. Around 2pm today I took a break from watching the smoke progression in southeastern PA to check the radar and went "holy smokes" because it looked very similar to the 2012 derecho in its initial stages. I mean, that thing was booking it. I then spent the afternoon geeking out over the 2012 event (during which I was actually camping in southern Delaware and had no clue at the time what was going on) while simultaneously absorbing the commentary in this thread. Today was a very interesting weather day to be sure, and it's always nice to have knowledgeable folks contributing to the conversation. The smoke's still pretty bad here, but hopefully it'll let up this weekend. I was kinda hoping for some relief tonight with that rapidly charging MCS but I guess it's one of those "be careful what you wish for" type deals. Cheers and goodnight~
-
Now THAT was a wild read, thanks Agnes!
-
This bit from the writeup got me: That was me. I was camping down in slower Delaware that night. It was really wild at the time, but I didn't know anything about it really until I got home the next day.
-
FWIW, the mets in the midwest forum are saying it'll most likely turn south. Still a very interesting thing to watch develop!
-
Nevermind. A custom search for "derecho" in June 2012 yielded no results.
-
3K NAM says it'll be pushed south. I wonder if we can find model runs (on here, perhaps) prior to the 2012 event...
-
Instantly reminded me of the 2012 derecho: I think it's worth keeping an eye on this one. I didn't realize that one crossed into Indiana ~2pm and hit the east coast only 10 hours later.
-
I've been so preoccupied with the smoke that I haven't checked the radar in quite a while. That sure is one heck of an MSC/bow echo sweeping east out of the midwest!
-
True. I just happen to know that Merck site is undergoing environmental remediation for all the toxic crap they produced there. https://www.epa.gov/hwcorrectiveactioncleanups/hazardous-waste-cleanup-merck-sharp-and-dohme-corporation-west-point Even more OT, the A/C guy found out some settings that were wrong from the initial installation in May, as well as a loose wire behind the thermostat, which he was super happy to show to me. I remain skeptical, but at least it's working again. For now. Back OT: our AQI appears to be getting worse:
-
We gotchu, JTA66: Just hope you don't live downwind from that Merck site. Either that sensor is permanently funky, or there's always some seriously nasty shiz in the air: Both of these sensors are in this snapshot of the AQI fire map:
-
Not here we're not. We're still in a deficit out here. Smoke is pretty bad this morning. Ugh, here we go again.
-
Good night for my brand-spanking new heat pump A/C to quit working. AQI is hovering around 100, so opening the windows is risky, but without A/C my house is at 78°F and will take considerable amount of time to cool down as the front of the house (mostly brick) just bakes in the afternoon sun. Called and left a message for them to come out first thing in the morning, but now I'm debating having an emergency service call. Currently 73 outside right now, and I know it's supposed to get down to ~60-ish, so I think we'll be fine; it could be much hotter/humid outside. Still. Not happy--this'll be the second service call in two months for the same issue. Mind you--I'M fine to wait for the morning, but I have people under my roof who are immunocompromised and suffer from asthma/allergies out the wazoo. It has not been a, shall we say, comfortable time for all of us these past few years. As soon as it cools down enough, I'll close all the windows and just run the system on "fan only" so at least we will gain the benefit of filtration.
-
It peaked here around 11-12 this morning at just over 100 but seems to be on the decline now.
-
.34" from today's rain, for a two-day total of 1.09". Not too bad. Still need more though to make up for May's deficit.
-
That's super cool to be able to toss up a drone for those pics. I wish I could do that, but I'm too close to an airport.
-
Got a whole .18" out of that. There's stuff still forming though, so I'm holding out hope. It looks like the radar's filled in pretty well over our region overall.
-
Whoa. It's actually raining right over my house for a change! Waiting to see if this line will merge or part around us as per usual.
-
Hearing some rolling thunder now at the tail end of this. .69" in the gauge for the day. Both rain barrels (50gal each) should be full by now.
-
OMG, we have actual precip here! The storms actually closed in and we're up another .2" for the day!
-
You know what though? This is a pretty neat even to track as that low stalls out over the Great Lakes. At least some weather in the region is better than no weather in the region. So while I may be personally offended that it all seems to keep missing me, at least it's entertaining.
-
And again, I find myself in the middle of a split system. Unbelievable. (I'm just west of the "S" in South Temple.) It's all parting around us. There has to be something about our local geography that causes this to happen so very, very often, I just can't figure out what.
-
No no, you were right. We got close to half an inch precip a couple of weeks ago, and that completely filled the barrel. I probably could have worded that better though. I live in an L-shaped split-level, so lots of roof area drains into my east corner, in the back of the house. The new one should get a lot of the runoff from the western side of the house, out in front.