
Bubbler86
-
Posts
25,310 -
Joined
-
Last visited
Content Type
Profiles
Blogs
Forums
American Weather
Media Demo
Store
Gallery
Posts posted by Bubbler86
-
-
T-Minus 10 min until Nut or Blizzard post the Euro snowfall totals.
-
1 hour ago, Jns2183 said:
Capital City Airport started taking temperature and precipitation daily observations again on 7/30/2000. The chart below highlights the yearly and month differences in Precipitation between Capital City Airport and KMDT, a mere 5 miles apart, if that. I excluded dates where any observations where missing. Highlighted are the cells where KCXY has a positive difference.
SUM of Difference Month Year 1 2 3 4 5 6 7 8 9 10 11 12 Grand Total 2000 0.09 -1.37 -2.06 0.37 -0.75 -0.93 -4.65 2001 -0.31 -0.22 -0.41 0.33 0.53 0.68 -0.36 -1.18 0.55 -0.13 -0.17 0.05 -0.64 2002 -0.21 0.03 -0.03 -0.62 -0.46 0.40 0.25 -0.70 0.30 -0.03 -0.37 -0.42 -1.86 2003 -0.24 0.13 -0.53 0.04 -0.06 -1.06 -0.82 -0.98 -0.05 -0.25 0.05 -0.16 -3.93 2004 -0.21 0.26 -0.30 0.49 -0.57 -0.23 0.58 -1.09 -0.20 -0.12 0.11 -0.05 -1.33 2005 -0.39 -0.24 -0.13 -0.41 -0.14 0.26 -1.99 -0.37 0.57 -0.88 -0.02 0.45 -3.29 2006 0.73 -0.11 0.01 0.05 0.45 -0.64 -0.45 -0.02 0.12 -0.61 -0.71 -0.06 -1.24 2007 -0.30 -0.70 -1.51 -0.98 -0.21 -1.46 -0.24 -0.42 -2.12 -1.65 -1.13 -1.61 -12.33 2008 -0.59 -2.02 -1.90 -1.17 -2.11 0.00 0.35 0.30 -3.90 0.54 -0.50 0.23 -10.77 2009 -0.21 -0.17 -0.17 0.68 -1.77 -1.44 0.62 0.55 -0.45 -0.48 -0.12 -0.36 -3.32 2010 0.21 -0.47 -0.13 0.25 0.16 0.12 -0.58 2.62 1.30 -0.01 0.37 -0.28 3.56 2011 -0.35 -0.43 0.03 1.09 -0.66 -2.41 0.66 -0.67 -9.63 0.79 -0.25 -0.20 -12.03 2012 -0.22 -0.10 -0.15 0.26 0.91 -0.91 0.18 0.02 -1.17 -0.28 -0.06 -0.19 -1.71 2013 -0.23 -0.01 -0.27 0.07 0.37 0.61 -2.25 -0.26 0.23 0.61 -0.08 -0.53 -1.74 2014 -0.68 -0.40 0.45 -0.53 -0.59 1.63 0.49 -1.01 0.22 -0.21 -0.32 -0.04 -0.99 2015 -1.00 -0.77 -0.94 1.11 -1.02 3.13 -0.04 0.57 -3.79 -0.31 0.13 -0.16 -3.09 2016 -2.83 -1.08 0.04 -0.43 0.01 -0.86 -1.05 -1.22 -1.28 0.12 -0.48 -0.28 -9.34 2017 -0.49 -1.10 -1.69 -0.23 -0.53 -0.94 -4.17 0.57 -0.36 0.09 -0.20 0.01 -9.04 2018 -1.31 -0.59 -0.54 -0.46 -1.63 0.20 -1.19 -0.53 1.59 0.06 -0.08 -0.50 -4.98 2019 -0.26 -0.26 Grand Total -8.89 -7.99 -8.17 -0.46 -7.32 -2.92 -9.92 -5.19 -20.13 -2.38 -4.58 -5.03 -82.98 Average -0.48 -0.44 -0.45 -0.03 -0.41 -0.16 -0.56 -0.21 -1.00 -0.15 -0.21 -0.23 -4.34 5 years of double digit (or close to it) differences seems like a lot but summer differences should probably be expected with the less stratiform nature of thunderstorms.
-
Sn+ squall here all of a sudden. Ground and roads are getting covered. Surprise.
-
5 minutes ago, 2001kx said:
Still waiting on my 12"+ the euro promised me over the weekend
")
And the 20" to 30" the Euro progged for us a bit earlier...same storm/time period.
-
10 hours ago, Jns2183 said:
Since 2/1//1942 I have 11 storms of >15"
Begin Date End Date Amt 1/15/1945 1/16/1945 21.00 1/19/1961 1/20/1961 18.70 1/12/1964 1/13/1964 18.10 2/18/1964 2/19/1964 20.50 2/11/1983 2/12/1983 25.00 3/13/1993 3/14/1993 20.40 1/8/1996 1/9/1996 22.20 2/5/2010 2/6/2010 18.00 2/9/2010 2/10/2010 15.70 1/22/2016 1/23/2016 30.20 3/13/2017 3/14/2017 17.00 Decade Storms >15" 1940 1 1950 0 1960 3 1970 0 1980 1 1990 2 2000 0 2010 4 Between my own issue of seeing the sheet wrong and the "did they use snowboards" question I won't put too much emphasis into my initial thought that the last decade or two has seen bigger storms all time but it still backs up the thought that those of us who grew up in the 70's and 80's simply did not get the "benefit" of the larger storms. Thanks very much for all this work. It makes a great reference.
-
4 minutes ago, MAG5035 said:
I only see 4 events total in that spreadsheet that would categorize as 15" or greater.
You are exactly right. I rushed through the chart and added the totals column to the 93-Current list and the split day issue you revealed is another problem in taking the trend too seriously.
-
5 minutes ago, pasnownut said:
It will. Plenty of time. Clippers don’t HAVE to be under but yeah best qpf is typically 50-75 north of LP
Euro has us getting a warning level event with a trailer it appears. Not going to bite on that at this point. Waiting for snows on the back of a front is pain staking and usually fruitless. Air temp is marginal which is why I want it under us...no south or southwest wind.
-
 2
2
-
-
58 minutes ago, pasnownut said:
Tuesday buddy.
It is going to need some more shovels to dig under us right now. :-)
-
4 hours ago, Jns2183 said:
I don’t believe there have been any big storms in memory where the difference between the two stations has been significant. Do you know when the current measuring procedures with the snowboard became standard operating procedure? I could see that making a difference possibly. Say they just measured once a day or something. Although not full proof by any means, I probably could compare precipitation totals to snow totals to get a ratio for larger events in the past, along with back to back events too see if anything stands out.
. ProWent back to this and found the answer. 1950's. This article discusses this topic but questions older measurements from the 70's and back at climate reporting sites and 50's and back at airports.
__
Official measurement of snowfall these days uses a flat, usually white, surface called a snowboard (which pre-dates the popular winter sport equipment of the same name). The snowboard depth measurement is done ideally every 6 hours, but not more frequently, and the snow is cleared after each measurement. At the end of the snowfall, all of the measurements are added up for the storm total. NOAA’s cooperative climate observers and thousands of volunteers with the Community Collaborative Rain, Hail and Snow (CoCoRaHS), a nationwide observer network, are trained in this method. This practice first became standard at airports starting in the 1950s, but later at other official climate reporting sites, such as Manhattan’s Central Park, where 6-hourly measurements did not become routine until the 1990s.
https://news.ucar.edu/14009/snowfall-measurement-flaky-history
-
20 minutes ago, canderson said:
Horst was barking about this upcoming polar vortex this morning on Twitter. It looks - cold!
Just need the harbinger of the cold to round the bend further south so this is not a green freeze. If we can get that shortwave under us it could be a decent snow.
-
1
-
-
Well this would put a dent into all these positive departures from the last 2 days

-
Just not digging enough.
-
26 minutes ago, Kmlwx said:
This looks closer to a severe t'storm threat than a winter storm for us

Looks almost exactly like the result from this past weekend though the LP is a bit lower in pressure.
-
30 minutes ago, Jns2183 said:
I don’t believe there have been any big storms in memory where the difference between the two stations has been significant. Do you know when the current measuring procedures with the snowboard became standard operating procedure? I could see that making a difference possibly. Say they just measured once a day or something. Although not full proof by any means, I probably could compare precipitation totals to snow totals to get a ratio for larger events in the past, along with back to back events too see if anything stands out.
. ProI am a little tied up today but did just do some searching for snowboard history but did not find much (the sport of snowboarding was invented in 1965 though)!. I thought I remembered people using snowboards in the 80's. I was too young to know stuff like that prior.
-
10 minutes ago, Jns2183 said:
The records start in 1941, I think I may go all the way back to start in the next few weeks. Also, as I mentioned before, up until 9/30/91 the observations were taken at Capital City Airport in New Cumberland. They are only about 5 miles apart, but has yearly precipitation totals consistently lower than KMDT at Harrisburg Airport. I think it was the last 18/20 or 19/20 years. Some years it was >10% lower, which I found amazing for such a short distance. I did notice most of the discrepancy occurred in the summer months I believe, but not all.
For a couple years after KMDT moved no observations were taken at KCXY. I’m going to try to compare observations for snow events where we have overlapping data.
. ProThanks. Although the spike in 15+" snows starts exactly when it went from CXY to MDT I feel confident the station change is not the sole reason for this as MDT is notoriously stingy with reporting totals.
-
1
-
-
52 here this AM. Got up to 49 yesterday then fell back to 42 before spiking 10 degrees the last few hours. Only snow left is in grocery store parking lot piles.
-
7 hours ago, Jns2183 said:
Alright, I took a couple of hours today and was able to download all the daily snowfall data for Harrisburg from 10/1/1957 till 4/30/2018. Broke the data into 5 year groupings and some bins and come up with the data below. Tomorrow I'll see if I can get things into a shared googlesheet and share the link. It should be noted that up until 9/30/1991 the observations at Harrisburg was taken at the Capital City Airport. Enjoy!
Wow, this is great, thank you. So the data does show we have had less of the moderate snows falls in the last 2-3 decades but it goes beyond that with less snow fall events all together. Also MDT only had 1 snowfall over 15" during the 45 year period of 1948-1992 and then a Bigly 7 over the 25 year period 93-18. Something has changed whether global warming or another natural climate phenomena.
I have another observation. Even if public internet had existed for all of that first 45 year period, boards like this would not be nearly as popular as they are now as many people here live for the MECS and HECs. Having 7 in the last 25 years has spurred on this hobby.
-
23 minutes ago, sauss06 said:
Harrisburg won't hit 50 today, tomorrow we will though.
Yea, I was speaking for my temp but York is already up to 46 so it was not far fetched for anyone in the LSV. Should go down a bit when the rain arrives but rise over night.
-
Already up to 42 here. 50's here we come.
-
38 degrees with a DP of 26 here now so what limited ice treat my area had has passed. Snow Pack is going to be down to piles by evening.
-
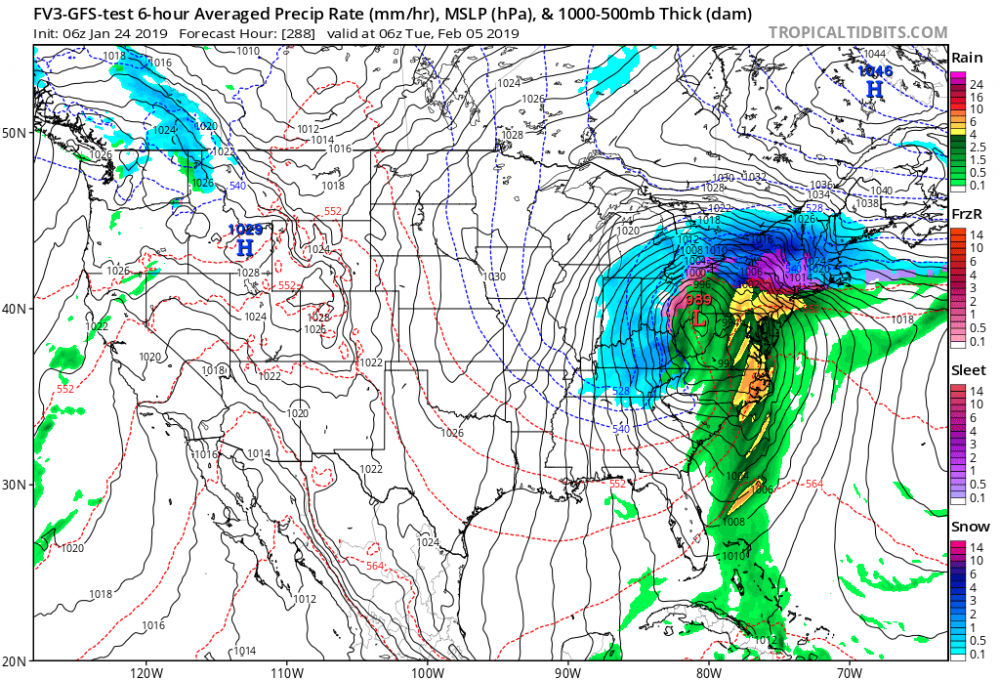
32 minutes ago, anotherman said:
The FV3 is so bad. I’m not sure why I keep getting sucked into what it shows.Because every model is woefully incorrect longer than a few days out so they are all just as good as the other. Even the Euro though it seems to jump a bit less vs slowly change to where it is no where near where it was a week before.
-
2 minutes ago, pawatch said:
That one didn't work out up here.

Someone could have slipped on that so close call for you guys!
-
1
-
 1
1
-
-
13 minutes ago, Wmsptwx said:
Dude we could be under gun for some icing tomorrow...models hinting at very stubborn surface cold.
And the FV3 hits you guys with 3 snows in the next 7 days. Dynamic pattern between trailing lows and clippers but something to track.
-
15 minutes ago, Superstorm said:
I think it’s why we have had so many big snowstorms in the past 25 years.
And why most of the big storms have been focused on the I-95
.I looked for snowfalls of 10" or over in that Millersville thread I posted and the last 9-10 years does come in first. Quick scan so could be off by one on any given decade
2010's-7
2000's-3
1990's-4
1980's-2
1970's-4


Central PA - Jan/Feb 2019 Obs and Discussion
in Upstate New York/Pennsylvania
Posted
Almost 2 feet at State College. Looks like 4-10" for much of the LSV. On its own right now with a solution that is bang/bang as to cold air and precip getting here.