weatherwiz
-
Posts
76,585 -
Joined
-
Last visited
Content Type
Profiles
Blogs
Forums
American Weather
Media Demo
Store
Gallery
Everything posted by weatherwiz
-

July 2025 Obs/Disco ... possible historic month for heat
weatherwiz replied to Typhoon Tip's topic in New England
Gotta kill them before they kill us. Ticks could become the next cockroach and they could join sides and we'd be in trouble. -
July 2025 Obs/Disco ... possible historic month for heat
weatherwiz replied to Typhoon Tip's topic in New England
We would probably need a summer like 2008 where we're dominated by cold pools. -
July 2025 Obs/Disco ... possible historic month for heat
weatherwiz replied to Typhoon Tip's topic in New England
Outside of any days with extensive cloud cover or precip it's an above-average pattern, which will be further fueled by what would be warm/humid overnights. But days with abundant sunshine is going to be lower-to-mid 80's for higher elevations and coast and mid-to-upper 80's inland with the warmest days getting into the lower 90's. -
July 2025 Obs/Disco ... possible historic month for heat
weatherwiz replied to Typhoon Tip's topic in New England
Actually a little surprised the models (I guess moreso CAMs) aren't a bit more bullish with potential for showers and thunderstorms tomorrow night. -
July 2025 Obs/Disco ... possible historic month for heat
weatherwiz replied to Typhoon Tip's topic in New England
Good catch...not sure how I didn't notice it was EPS -
July 2025 Obs/Disco ... possible historic month for heat
weatherwiz replied to Typhoon Tip's topic in New England
You know its a hot pattern when a "trough" for us is still defined by heights ~5850 m -
July 2025 Obs/Disco ... possible historic month for heat
weatherwiz replied to Typhoon Tip's topic in New England
by extended do you mean November? -
July 2025 Obs/Disco ... possible historic month for heat
weatherwiz replied to Typhoon Tip's topic in New England
Booo
-
July 2025 Obs/Disco ... possible historic month for heat
weatherwiz replied to Typhoon Tip's topic in New England
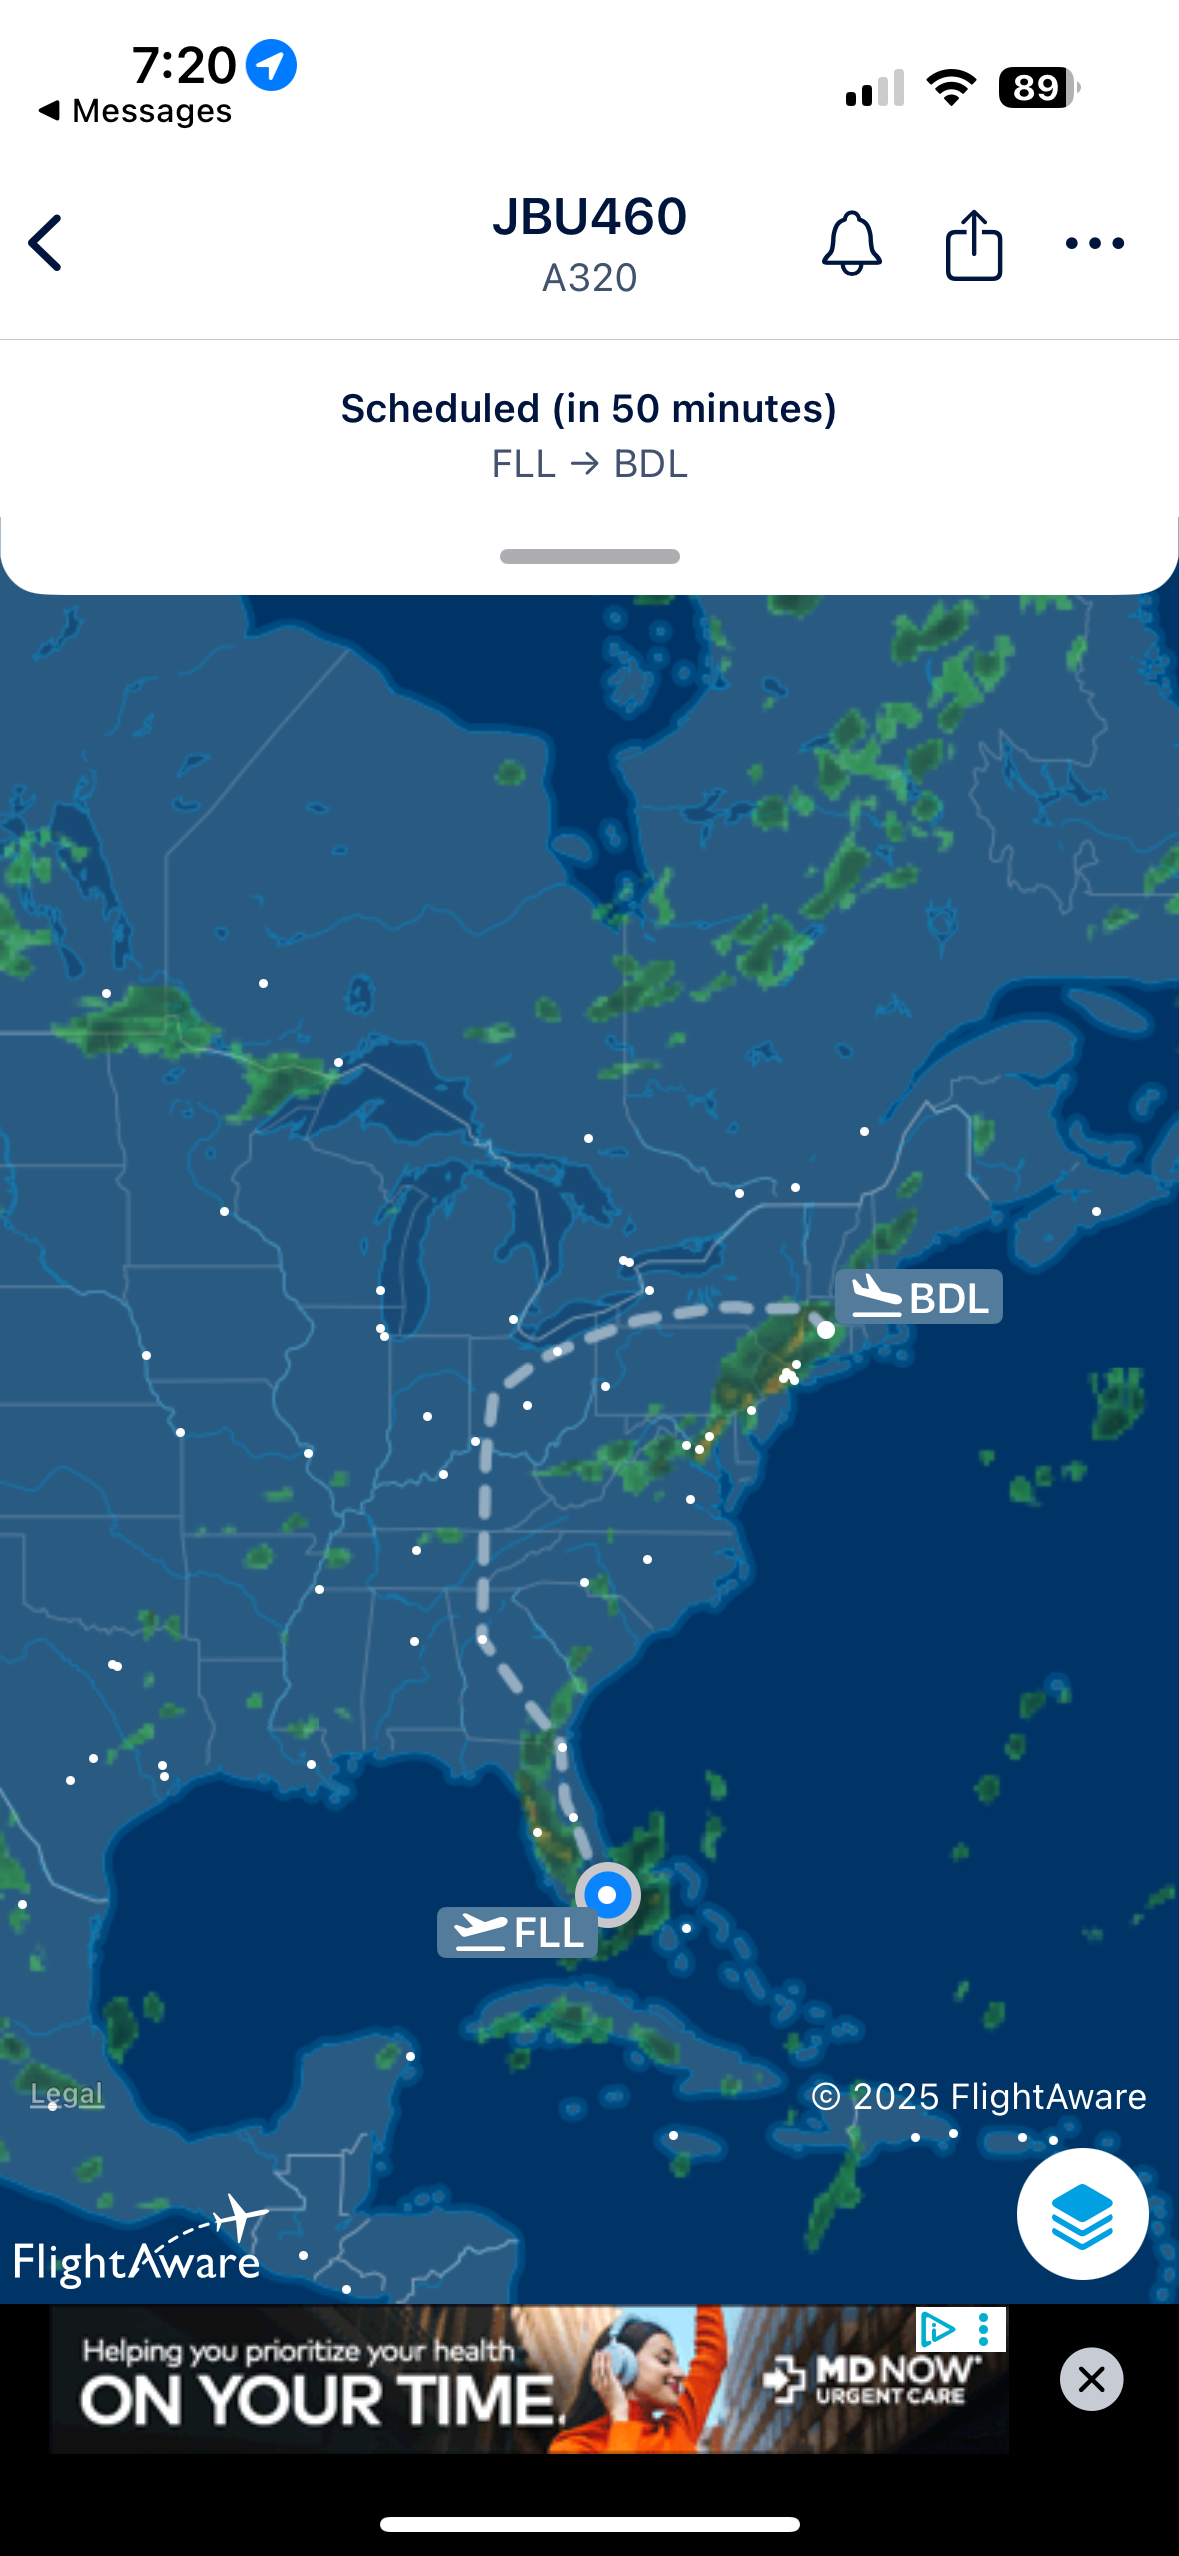
I have a feeling my flight back will be delayed tonight. That’s going to make tomorrow fun -
July 2025 Obs/Disco ... possible historic month for heat
weatherwiz replied to Typhoon Tip's topic in New England
Nearly lost power here!!! -
July 2025 Obs/Disco ... possible historic month for heat
weatherwiz replied to Typhoon Tip's topic in New England
Oh I Did. I am still shaking lol. Was standing outside under the overhang and just got my camcorder setup, saw the super bright flash and loudest crack I ever heard. Heard it before the flash was done lol. -
July 2025 Obs/Disco ... possible historic month for heat
weatherwiz replied to Typhoon Tip's topic in New England
Holy shit just had the closest lighting strike ever. Something just exploded -
July 2025 Obs/Disco ... possible historic month for heat
weatherwiz replied to Typhoon Tip's topic in New England
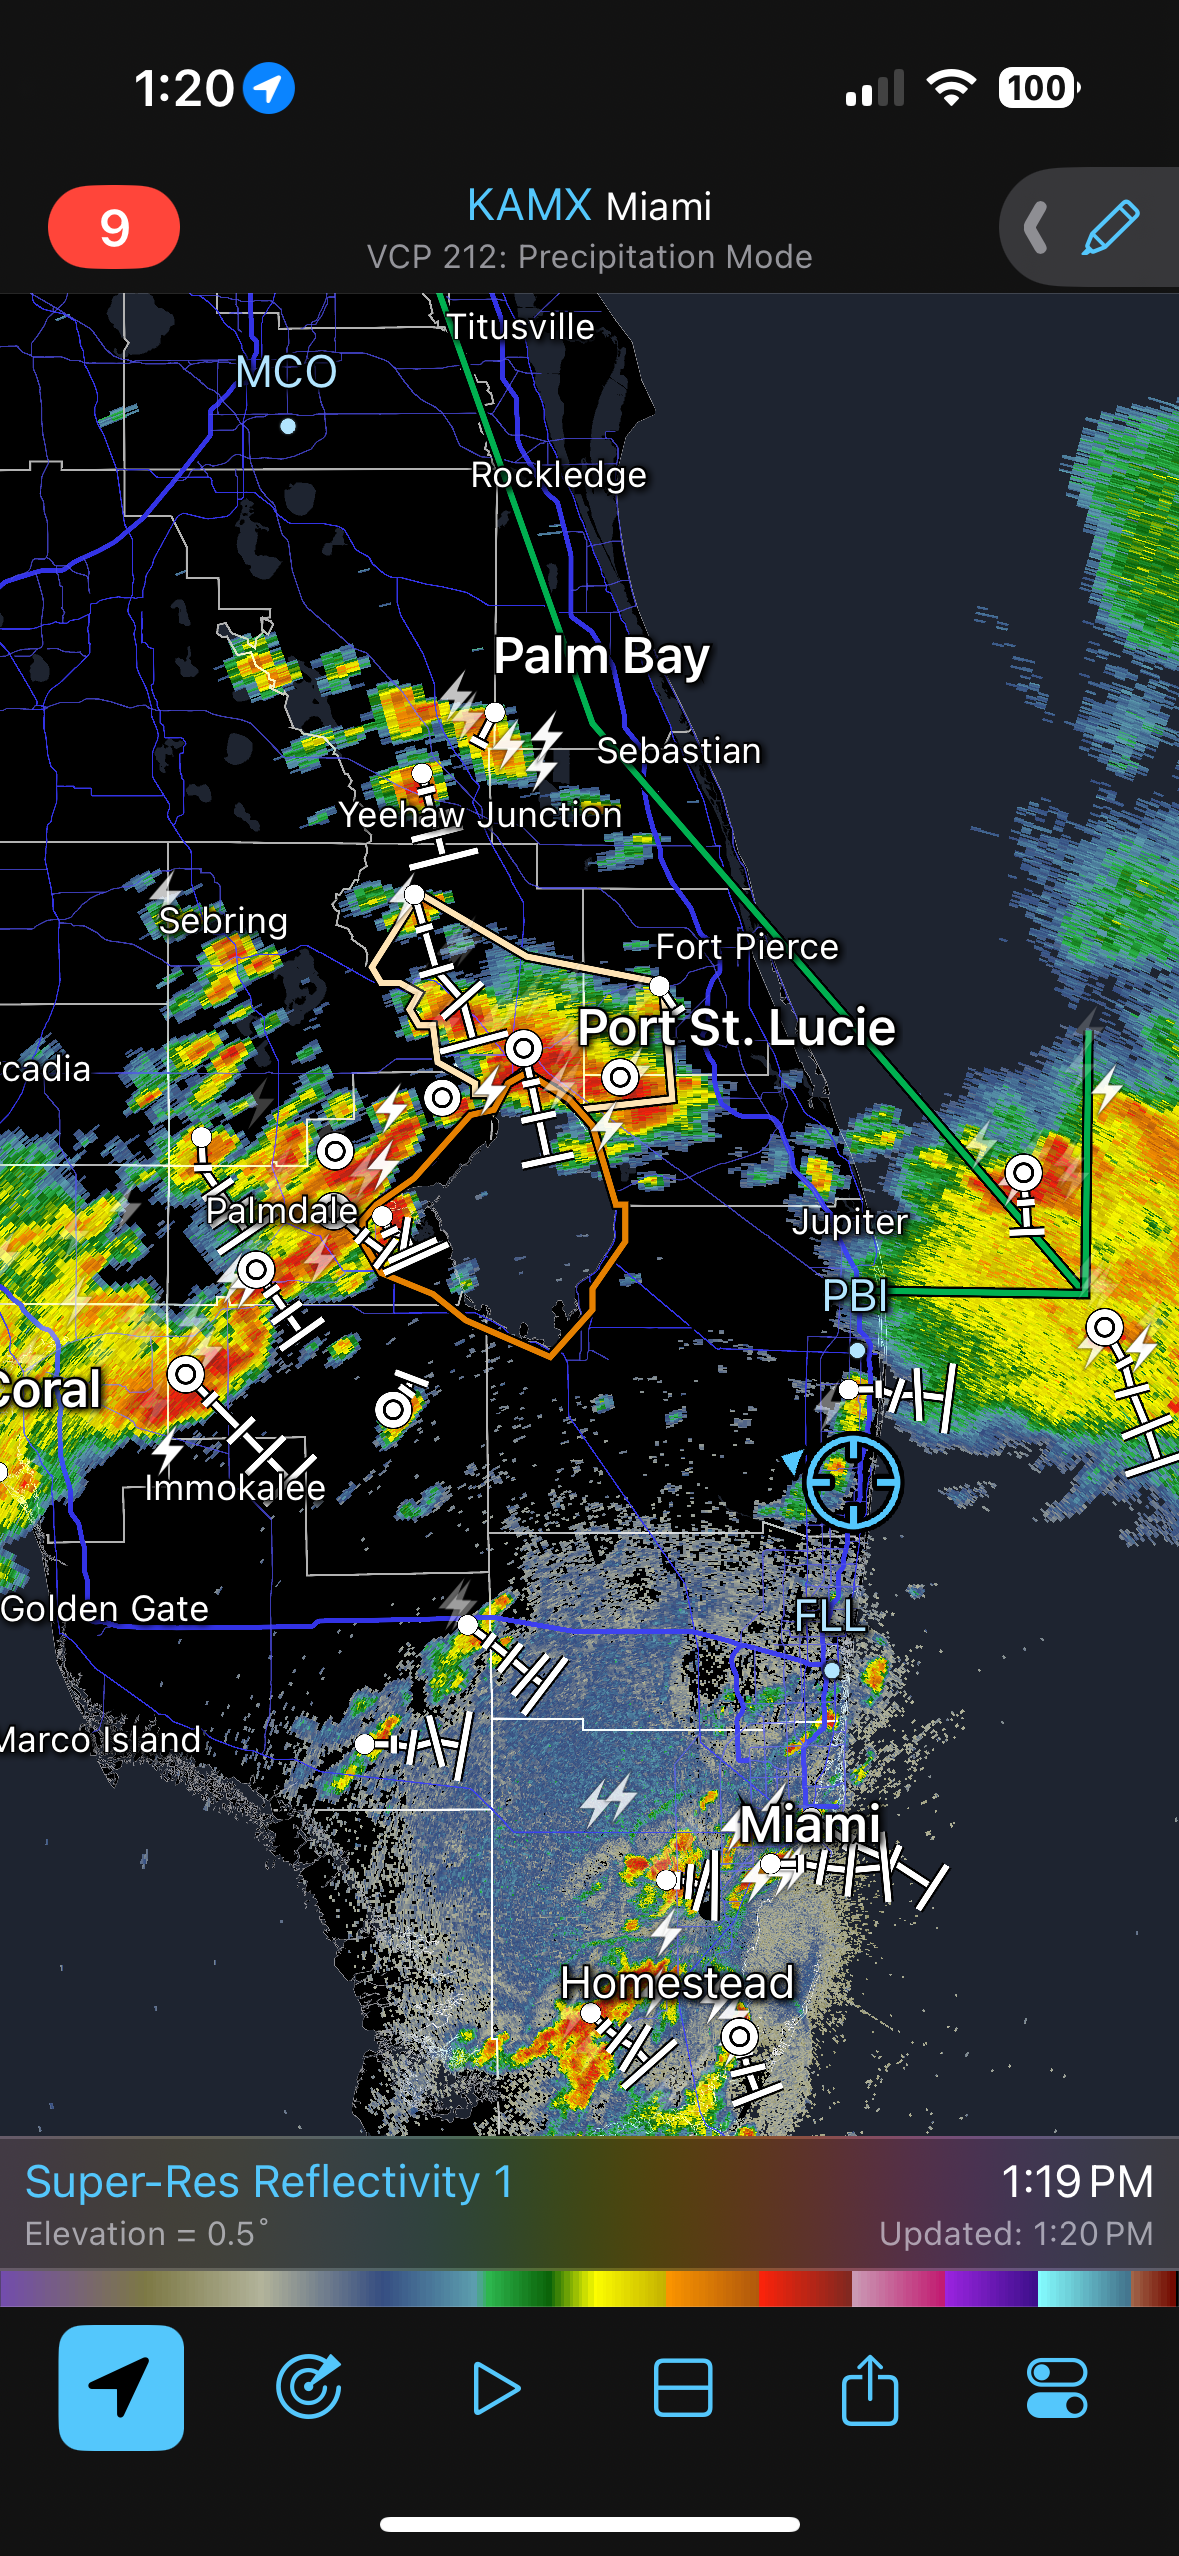
This is looking promising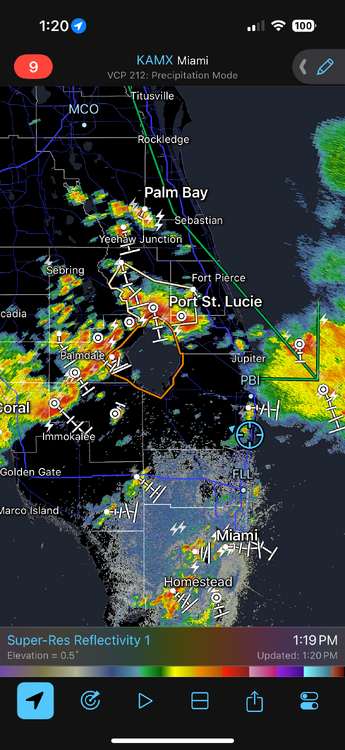
-
July 2025 Obs/Disco ... possible historic month for heat
weatherwiz replied to Typhoon Tip's topic in New England
Our cold fronts are essentially dewpoint fronts lol -
July 2025 Obs/Disco ... possible historic month for heat
weatherwiz replied to Typhoon Tip's topic in New England
Well that explains the difference! Elevation and coastline will 99.9% of the time be cooler. Think of lapse rates. If you have higher elevations (say above 1000’) like ORH pushing 90 or into the lower 90’s…then you’re talking about some extreme heat region wide. For the most part days/nights have been above average. If 925/850 temperatures are above average and well above the the entire region is above…maybe some locations are a bit less but that is more reflective of local climate versus large scale pattern and the large scale pattern holds more weight -
July 2025 Obs/Disco ... possible historic month for heat
weatherwiz replied to Typhoon Tip's topic in New England
What’s your elevation? -
July 2025 Obs/Disco ... possible historic month for heat
weatherwiz replied to Typhoon Tip's topic in New England
Climate change is definitely roaring its head. I mean the last few days down here have been equivalent to probably some of the hottest days we’ve had this summer. The only difference is the super high sun angle…that sun is strong and you can get burned within minutes. But outside right now…it doesn’t feel much different than the warm nights up there -
July 2025 Obs/Disco ... possible historic month for heat
weatherwiz replied to Typhoon Tip's topic in New England
Dews up pants down -
July 2025 Obs/Disco ... possible historic month for heat
weatherwiz replied to Typhoon Tip's topic in New England
2m temperature anomaly maps are in the fraud 5 of what should never be looked at. 1. snow maps - they are pure garbage 2. supercell composite parameter - stupid 3. significant tornado parameter - stupid 4. the hazard option on the SHARPPy soundings - stupid 5. 2M temperature anomaly maps - stupid -
July 2025 Obs/Disco ... possible historic month for heat
weatherwiz replied to Typhoon Tip's topic in New England
I will always root for Marchand -
July 2025 Obs/Disco ... possible historic month for heat
weatherwiz replied to Typhoon Tip's topic in New England
I would totally move to south Florida but I’d be screwed trying to watch Bruins and wouldn’t be able to go to Hartford wolf pack games -
July 2025 Obs/Disco ... possible historic month for heat
weatherwiz replied to Typhoon Tip's topic in New England
I wonder if that’s KBYX radar

-
July 2025 Obs/Disco ... possible historic month for heat
weatherwiz replied to Typhoon Tip's topic in New England
Temperature 88, dewpoint 80, and and heat index of 104! -
July 2025 Obs/Disco ... possible historic month for heat
weatherwiz replied to Typhoon Tip's topic in New England
Dewpoint is 81F in Key West…beautiful -
July 2025 Obs/Disco ... possible historic month for heat
weatherwiz replied to Typhoon Tip's topic in New England
I can see lightning from these storms!!! Can’t wait for it to be totally dark. I brought my camcorder and tripod