
Tatamy
-
Posts
2,583 -
Joined
-
Last visited
Content Type
Profiles
Blogs
Forums
American Weather
Media Demo
Store
Gallery
Everything posted by Tatamy
-
This is so true!
-
Where did you spend those winters?
-
Very strongly agree.
-
This reminds me of many of the winters in this region back in the 70s, 80s, and 90’s. Yes there were a few good ones however much of the time was like this with AN temps and rainers. With the pattern this year featuring the raging PAC jet you really can’t go wrong with warm in your outlook.
-
People out on eastern LI need to watch closely the model runs for Sunday. Big changes right now for Cape Cod / SE Massachusetts on the GFS/CMC with the following ULL.
-
Measured 0.01 from last night’s precip. Short range models all backed off on the event as we went through the day yesterday.
-
Just seeing light drizzle with some melting flakes.
-
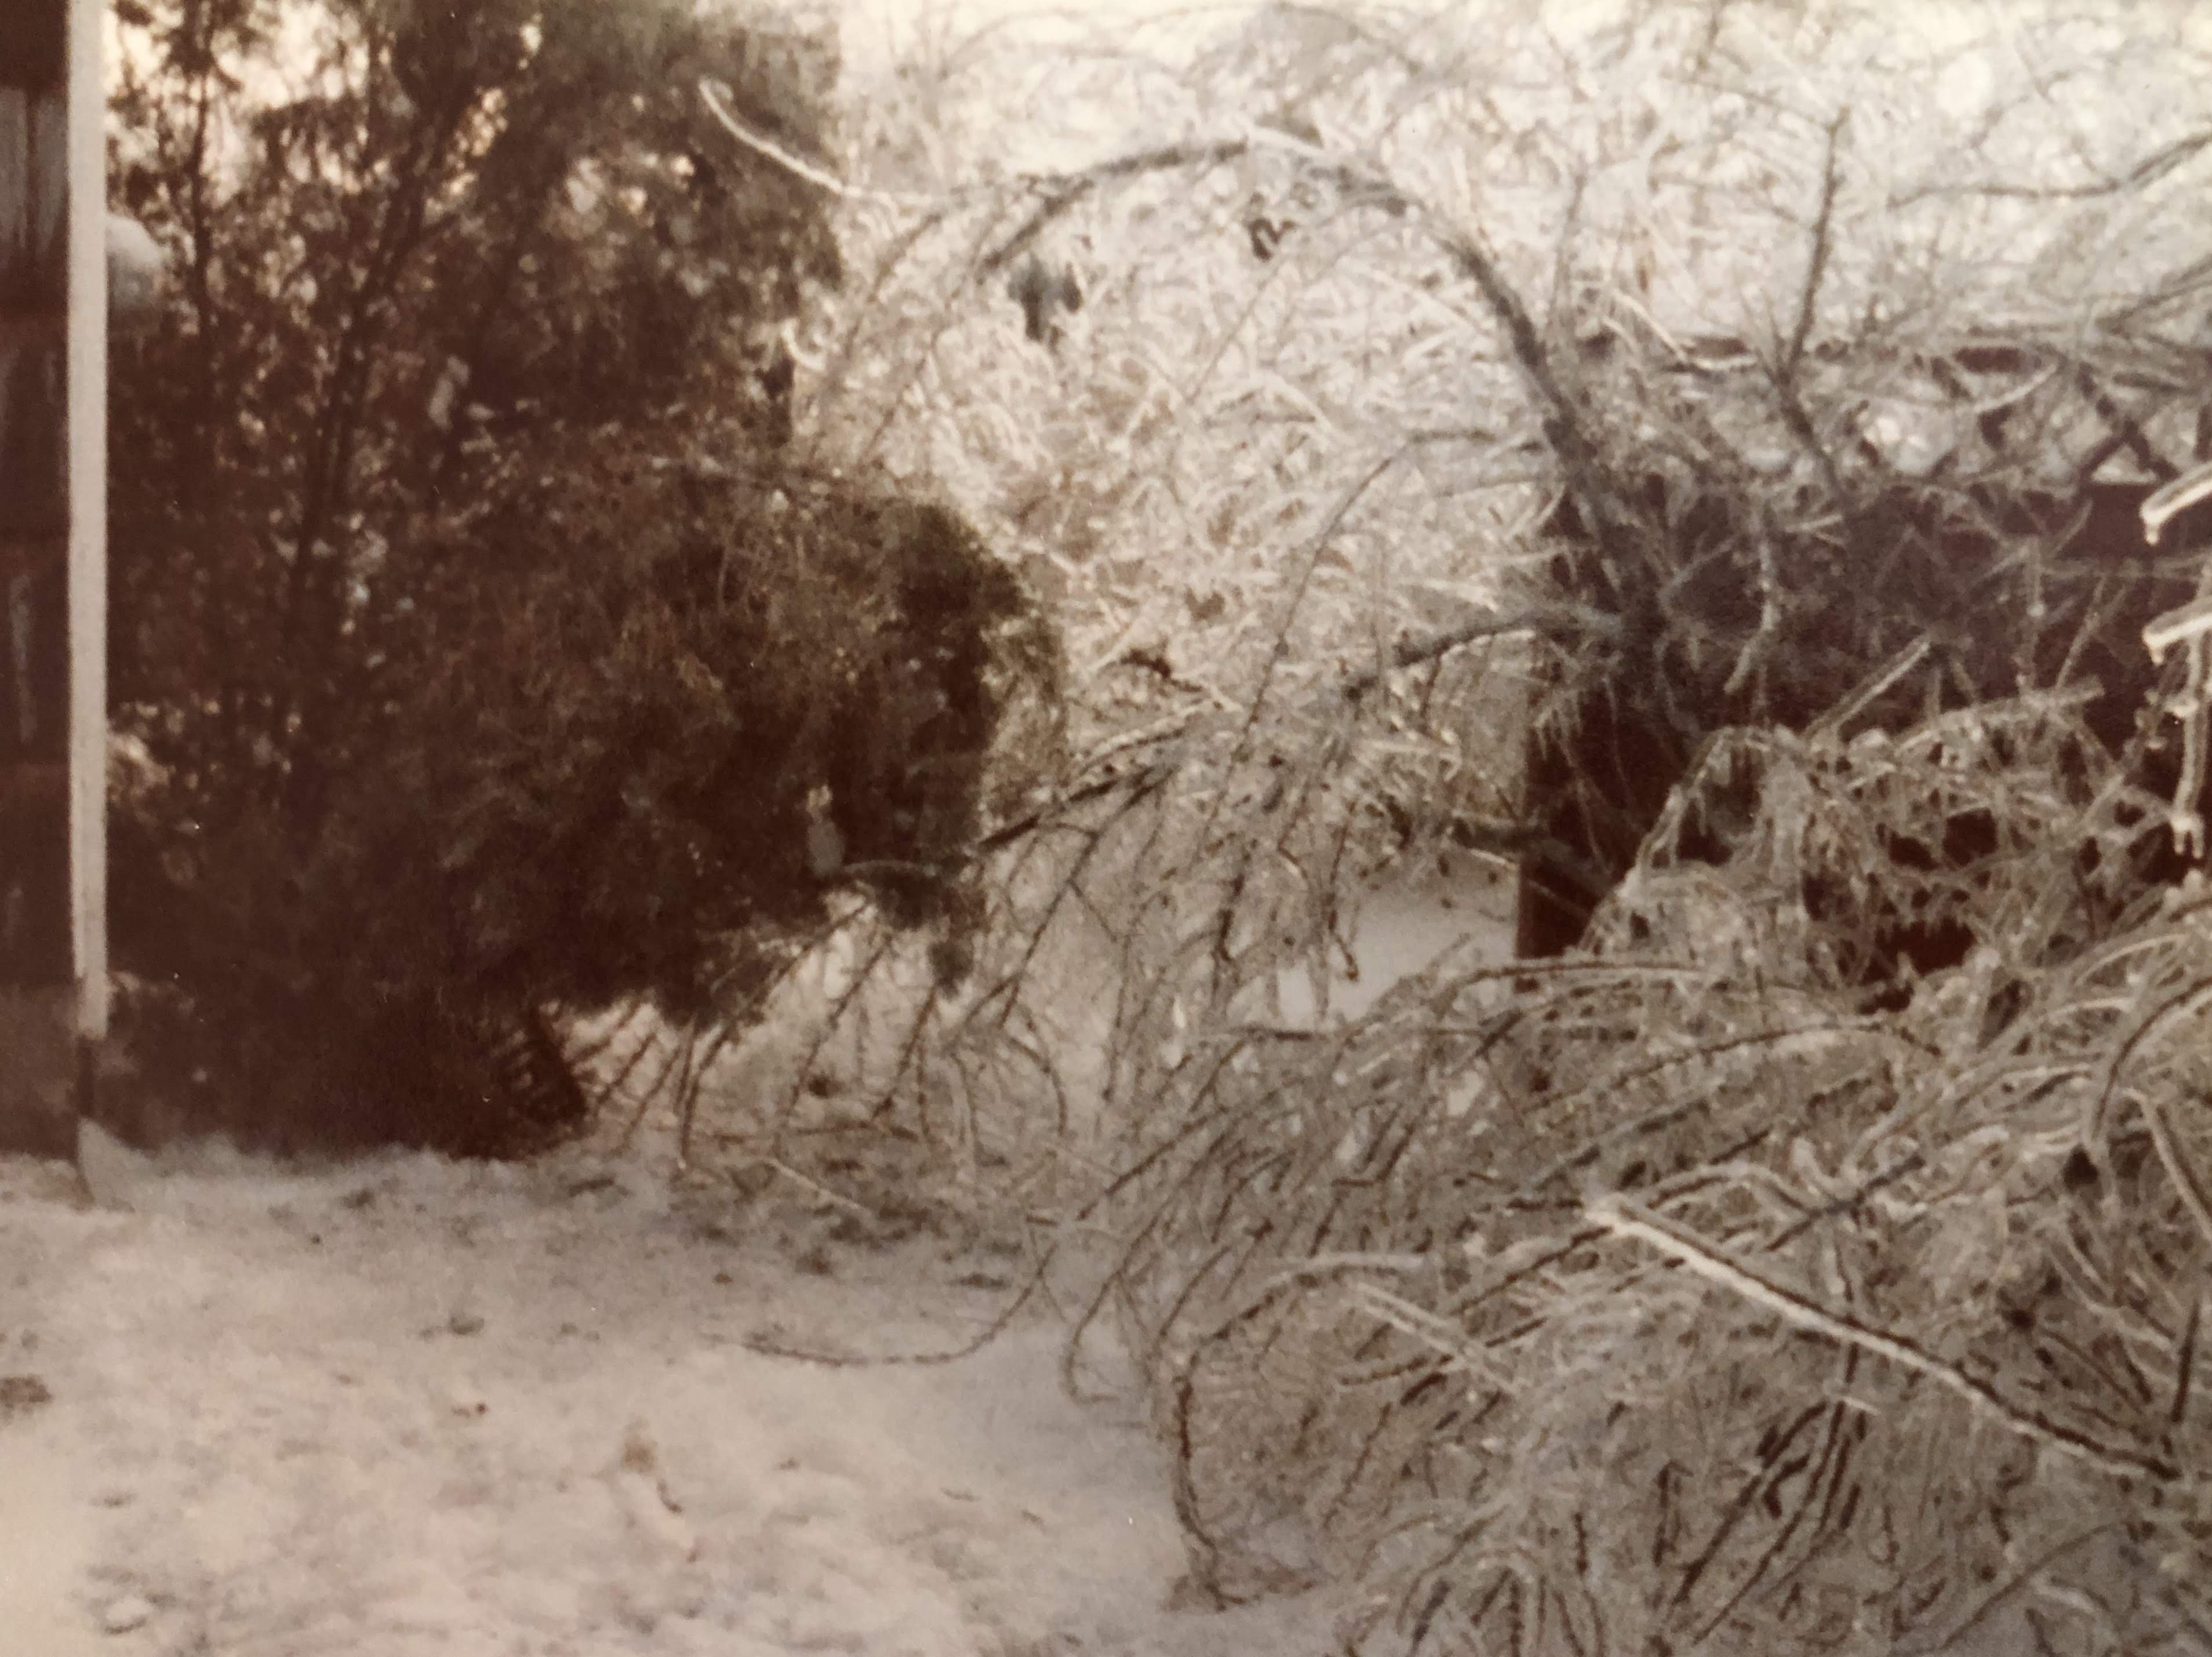
This was the first of three events that occurred that week. The third event was the January 20th snowstorm that dumped 12-18” unexpected inches across the area. This 1/15 event changed to freezing rain across much of LI away from the south shore and east end. The north shore was particularly hard hit.
-
You actually don’t have to travel to Canada to get pictures with 2” of ice. I took this on 1/16/78 at my then home in East Northport.

-
I did the same a long time ago.
-
I will clarify that I meant no ensemble support for the specific outcome shown on the day 9 OP run. Your synopsis clearly states the tall order that would be required in order for this outcome to actually occur.
-
Day 9 on an OP run without ensemble support.
-
This event had mixed snow/rain or white rain for much of its duration in many coastal areas.
-
 NWS has issued a Winter Storm Warning for Martha’s Vineyard through Sunday morning for 4-8”.
 -
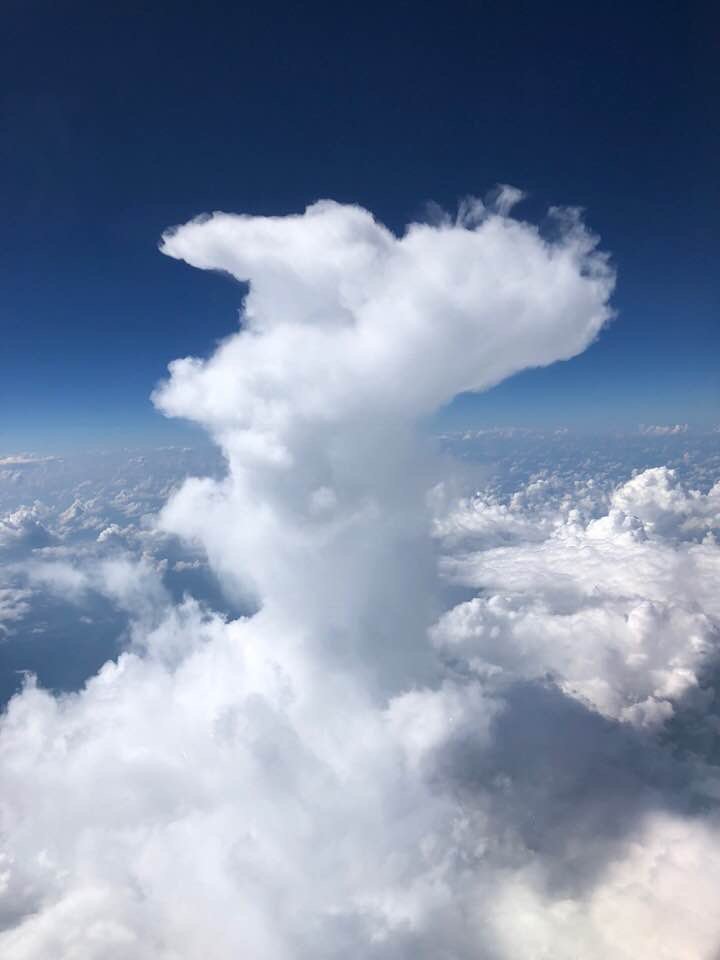
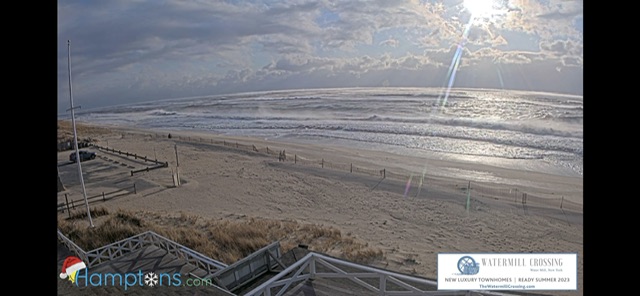
That’s from a band originating off of LI Sound and crossing over the north fork. This is a view from East Hampton on the south fork. Shows you the hit or miss nature of these features. You can see a band out over the ocean to the south.
-
Martha’s Vineyard- Five Corners
-
December 22nd - 23rd Cutter Discussion and Observations
Tatamy replied to NJwx85's topic in New York City Metro
Recent data output from my station on Fire Island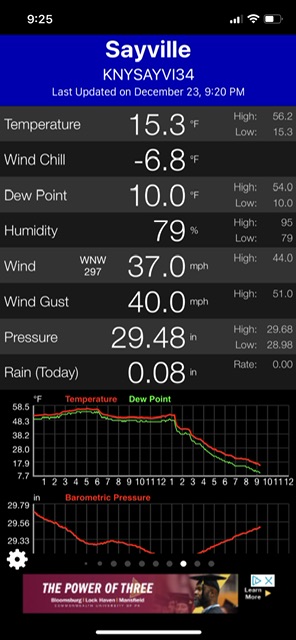
-
December 22nd - 23rd Cutter Discussion and Observations
Tatamy replied to NJwx85's topic in New York City Metro
Down to 6 with a WC of -10 -
December 22nd - 23rd Cutter Discussion and Observations
Tatamy replied to NJwx85's topic in New York City Metro
Current conditions at a station that I follow on Block Island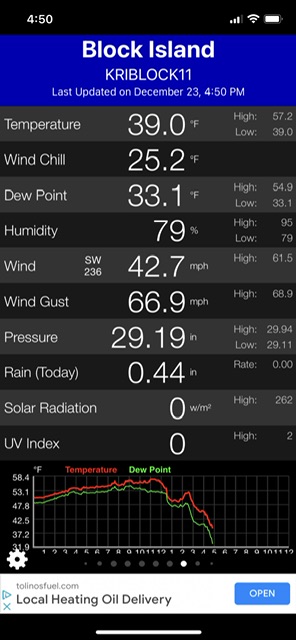
-
December 22nd - 23rd Cutter Discussion and Observations
Tatamy replied to NJwx85's topic in New York City Metro
Snow is tapering off. Coating on the ground. 24• -
December 22nd - 23rd Cutter Discussion and Observations
Tatamy replied to NJwx85's topic in New York City Metro
Moderate snow. 31•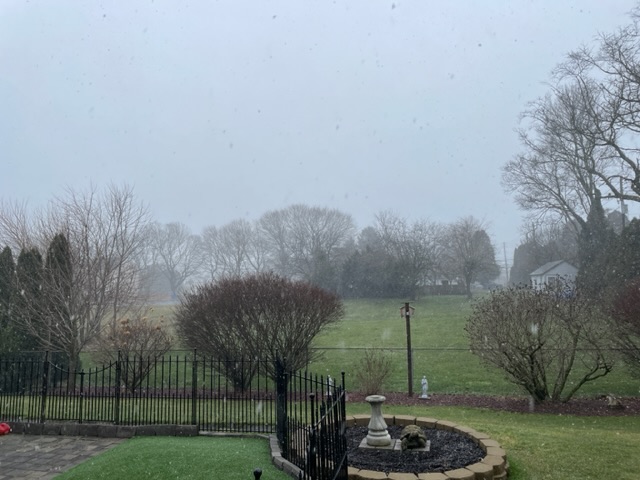
-
December 22nd - 23rd Cutter Discussion and Observations
Tatamy replied to NJwx85's topic in New York City Metro
I am continuing to see moderate snow with reduced visibility’s in a lot of places just to my west and southwest in the Allentown area. Accumulations in these areas are mainly on the order of a coating. 33• with light snow. -
December 22nd - 23rd Cutter Discussion and Observations
Tatamy replied to NJwx85's topic in New York City Metro
Arctic front has passed my location. Down to 34• with snow flurries. -
December 22nd - 23rd Cutter Discussion and Observations
Tatamy replied to NJwx85's topic in New York City Metro
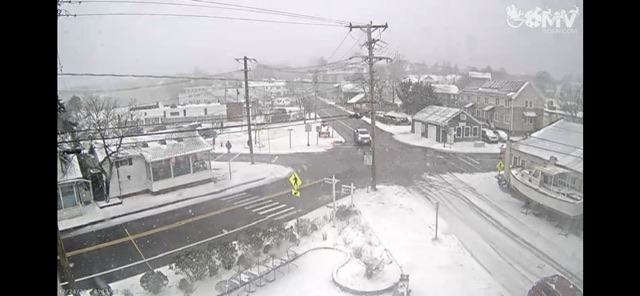
I am actually watching what looks like a wall of snow approaching my location.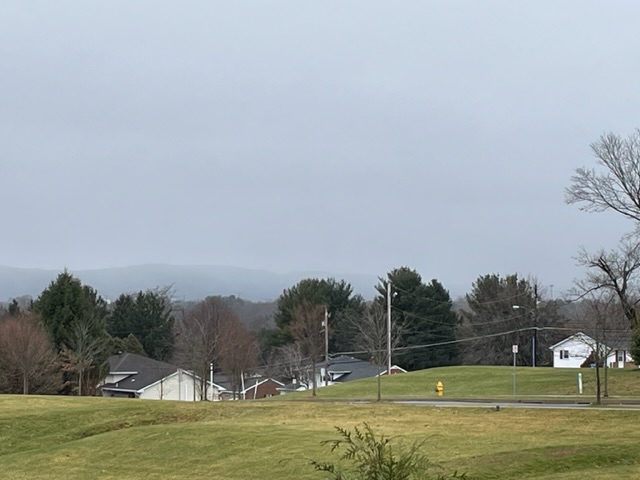
-
December 22nd - 23rd Cutter Discussion and Observations
Tatamy replied to NJwx85's topic in New York City Metro
Snow is now falling moderately to heavily from Allentown and south and west. I am seeing visibilities of 1/2 mile or less in places on webcams. Temperature starting to fall steadily here - down to 38•. You folks in northern NJ and SE NY need to pay attention to this.