
ChescoWx
-
Posts
9,651 -
Joined
-
Last visited
Content Type
Profiles
Blogs
Forums
American Weather
Media Demo
Store
Gallery
Everything posted by ChescoWx
-
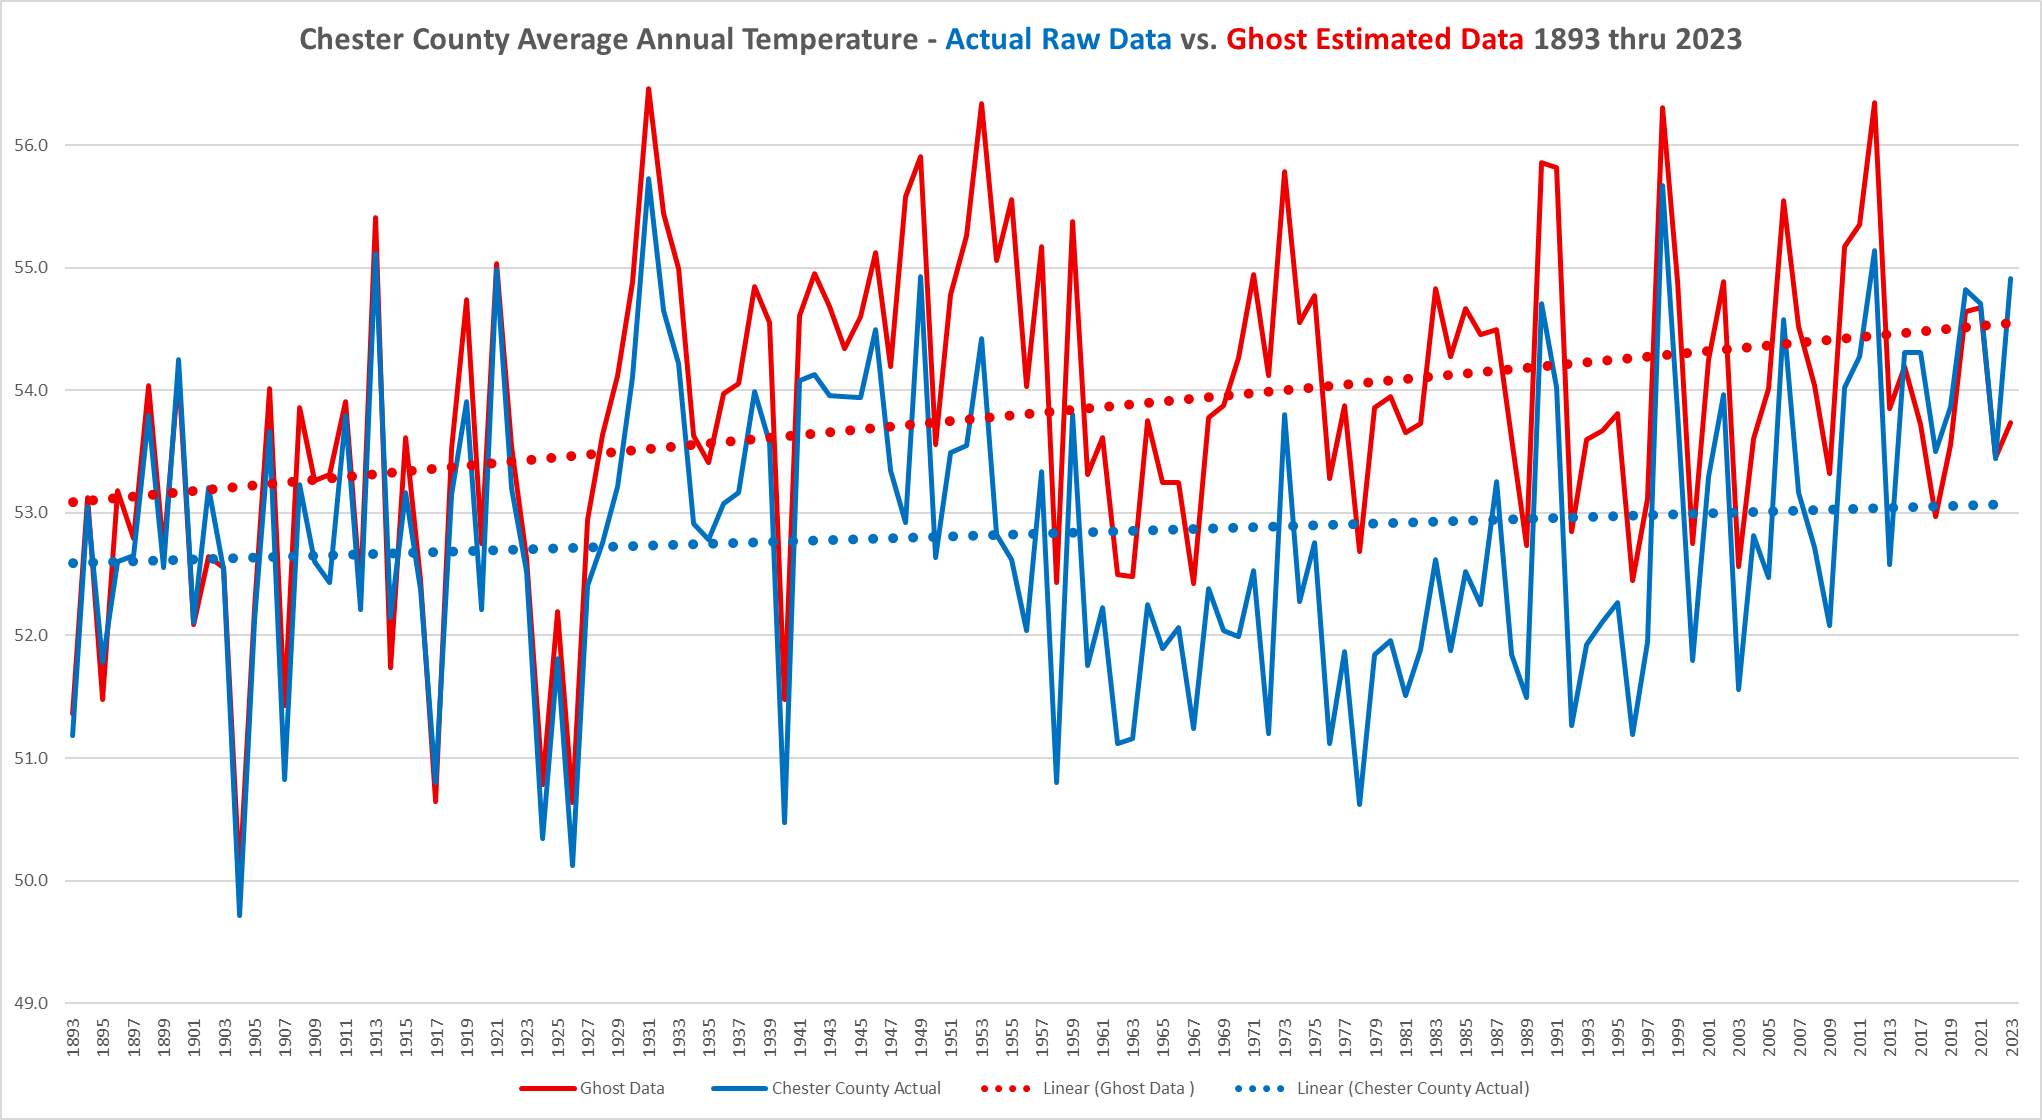
 We have found additional Ghost Stations and more years of ghosted estimated data. Now our updated list includes ten (10) Ghost Stations with data. All years between 1893 through 2023 feature some ghost data with the exception of 2014 / 2015. The updated stations and ghastly data years now include Phoenixville (1895-1914) / West Grove (1928-1962) / Chadds Ford (1946-2005) / Coatesville (1948-1955) / Glenmoore (1957-2005) / Honey Brook (1957-2013) / West Chester 2W (1979-1981) and Devault (1893-1950 + 1988-2004) / Coatesville 1E (2016-22) and Spring City (2020-2023). Overall there are 283 years of ghastly data used to "fill in data gaps" across Chester County PA. Below is the updated Ghost Station annual average temperature trends vs. the actual raw County data. Every year between 1918 and 2013 the Ghost Data runs warmer than the actual County Data. The largest differences start in the late 1940's through the early 80's with the largest differences between the data points being during our coldest actual period from the late 1950's through the mid 1980's. As is always the case with the estimated IEM or adjusted NCEI averages they show a clear warming trend while the actual raw non-estimated / adjusted temperatures show very minor warming. It is interesting that the estimated IEM data runs higher than even the actual stations during the warmest decades of the 1930's and into the 1940's....the estimated data clearly also lacks the NCEI alterations like the actual raw data.
-
Happy Friday! We continue our stretch of warm and humid weather with chances of at least some rain on most days. No total washouts but our best chances of rain look to be from Sunday night through Monday. We should continue to run a few degrees above normal with highs in the mid to upper 80's with maybe a couple lower valley spots touching 90 some days. Still no sign of any widespread sustained 90-degree heat in our future through much of the remainder of July!


-
E PA/NJ/DE Summer 2025 Obs/Discussion
ChescoWx replied to Hurricane Agnes's topic in Philadelphia Region
Happy Friday! We continue our stretch of warm and humid weather with chances of at least some rain on most days. No total washouts but our best chances of rain look to be from Sunday night through Monday. We should continue to run a few degrees above normal with highs in the mid to upper 80's with maybe a couple lower valley spots touching 90 some days. Still no sign of any widespread sustained 90-degree heat in our future through much of the remainder of July!
-
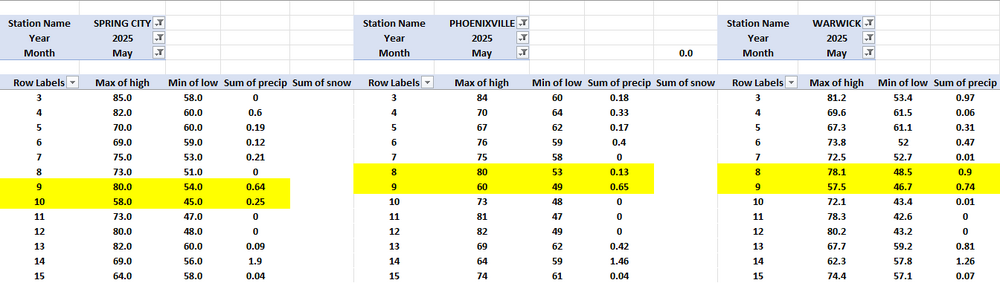
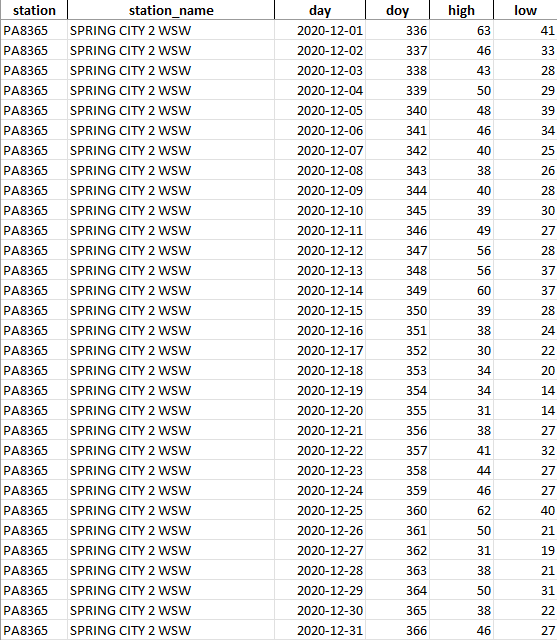
As I am always reviewing my data sources to ensure clean comparable data....I noticed something strange about the Spring City 2 WSW COOP report....unlike Phoenixville which records a 24 hour Min/Max....Spring City uses the old 24 hour prior to 7am observation. In addition to removing the ghost data from my Chester County data set - I will also make the adjustment to line up the days for Spring City. I have highlighted the impact below for May 2025.
-
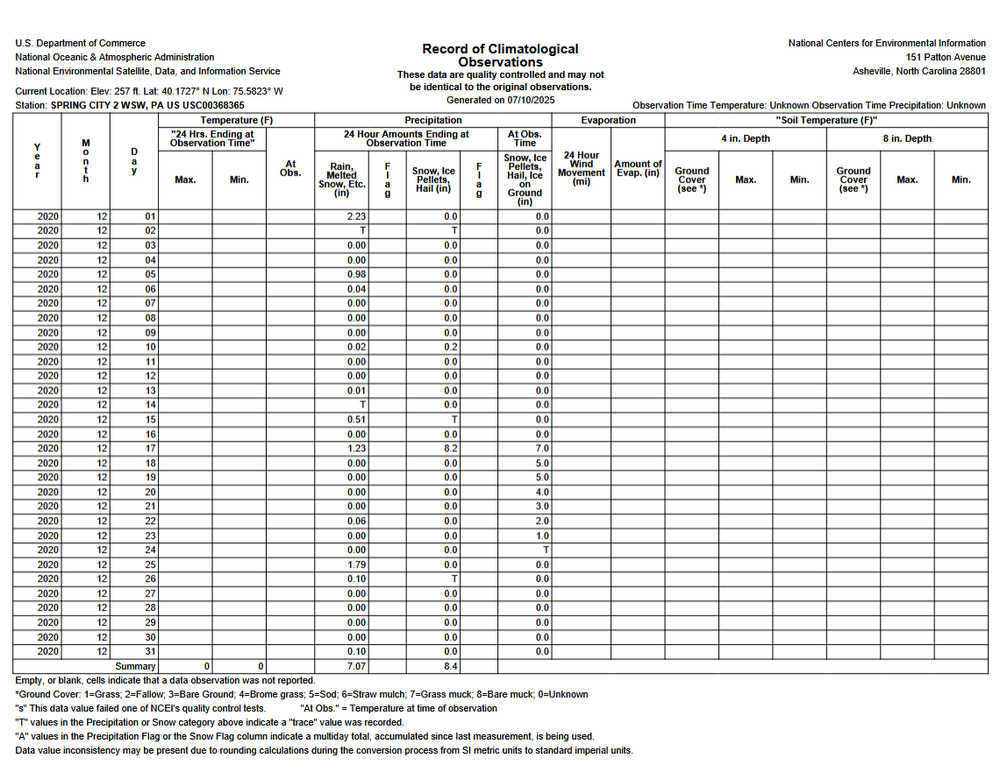
Looks like some more recent ghost station activity being captured....this time at the newest COOP Location in Chester County PA. Station SPRING CITY 2 WSW, PA which began it's first ghastly estimated data on January 1, 2020.....yet the first actual true temperature record was not made for almost 3 and 1/2 years later or 40 months later in late May of 2023! Below is the NOAA COOP report from December 2020 and then the ghost data now incorporated for estimations.
-
Climate Alarmists really are a tolerant bunch....fortunately we are starting to get more and more young meteorology professionals like Chris! Sadly, there are many older and younger professionals that Chris and I speak with in private....who share our concern about the damage being done by climate alarmists and zealots. Yet they feel forced to remain silent with their dissenting views that there is in fact no climate emergency at all. Fortunately the tide is turning and folks are coming back to common sense and calm around our always changing climate! https://freebeacon.com/policy/im-a-young-meteorologist-who-questioned-the-idea-of-man-made-climate-change-the-climate-zealots-wanted-me-punished-silenced-and-expelled/
-
Thanks Tim!!! Correct will update formula and going forward - also need to update the normal number - great catch - thanks again!!
-
Large differences as usual in these set ups regarding rain amounts yesterday - Kennett Square 3.88" / Longwood Gardens 2.05" / East Nantmeal 0.35" / Chester Springs 0.24" / Devault 0.41" / West Bradford 1.38" / Nottingham 0.33" / Warwick 0.28" / West Grove 2.71". We should see a reduction in heavy rain over the next week but still some rain chances most days. The warmest couple of days look to be both Friday and Saturday in the mid to upper 80's before we fall back to closer to normal next week with highs in the middle 80's.
-
E PA/NJ/DE Summer 2025 Obs/Discussion
ChescoWx replied to Hurricane Agnes's topic in Philadelphia Region
Truth!! -
E PA/NJ/DE Summer 2025 Obs/Discussion
ChescoWx replied to Hurricane Agnes's topic in Philadelphia Region
2 miles from my spot where I picked up 0.73" they received over 2" ....tropical showers and t-storms vary across short distances -
E PA/NJ/DE Summer 2025 Obs/Discussion
ChescoWx replied to Hurricane Agnes's topic in Philadelphia Region
The DEOS/NWS/AWOS Airport Network Stations across the County -
Correct! estimate of ghost averages vs actual averages for those years.
-
Nothing hidden it is what is says the red is ghost and blue is actual raw data...
-
Still finding more of these Ghost Stations and trying to see where they grabbed the data from - but so far Phoenixville (1895-1914) / West Grove (1928-1962) / Coatesville (1948-1955) / Glenmoore (1957-2005) / Honey Brook (1957-2013) / West Chester 2W (1979-1981) and Devault (1894-1950 and again from 1989 thru 2003)
-
At least you stick to the same playlist....
-
After our heavy rain across much of the area we got a brief break during the day before The NWS has placed us in another flash flood watch for later tonight starting around evening rush hour. Like the past few days any spots that get under one of these heavy storms could see some hefty rain amounts. The rest of the week continues unsettled with shower chances most days. With the clouds and showers we continue to look like no shot of any 90 degree plus weather for this week. Looking ahead at the long-range models... especially for the higher spots in the County we may not see another 90 plus day through the month of July.

-
E PA/NJ/DE Summer 2025 Obs/Discussion
ChescoWx replied to Hurricane Agnes's topic in Philadelphia Region
After our heavy rain across much of the area we got a brief break during the day before The NWS has placed us in another flash flood watch for later tonight starting around evening rush hour. Like the past few days any spots that get under one of these heavy storms could see some hefty rain amounts. The rest of the week continues unsettled with shower chances most days. With the clouds and showers we continue to look like no shot of any 90 degree plus weather for this week. Looking ahead at the long-range models... especially for the higher spots in the County we may not see another 90 plus day through the month of July.
-
Some other County rain totals so far today. KMQS 1.33" / Chester Springs 1.55" / Glenmoore 0.58" / Atglen 2.12" / Nottingham 1.81" / Warwick Twp. 1.01" / KOQN 1.16" / Devault 0.50" / Kennett Square 1.01" / West Bradford 0.88" and West Grove 0.69"
-
E PA/NJ/DE Summer 2025 Obs/Discussion
ChescoWx replied to Hurricane Agnes's topic in Philadelphia Region
Some other County rain totals so far today. KMQS 1.33" / Chester Springs 1.55" / Glenmoore 0.58" / Atglen 2.12" / Nottingham 1.81" / Warwick Twp. 1.01" / KOQN 1.16" / Devault 0.50" / Kennett Square 1.01" / West Bradford 0.88" and West Grove 0.69" -
Another 0.67" of rain in East Nantmeal with tonights storms and now 1.40" since yesterday and 3.63" during the 1st 8 days of July!
-
E PA/NJ/DE Summer 2025 Obs/Discussion
ChescoWx replied to Hurricane Agnes's topic in Philadelphia Region
Another 0.67" of rain in East Nantmeal with tonights storms and now 1.40" since yesterday and 3.63" during the 1st 8 days of July! -
Still giggling over the 15f to 20f....hardest I have laughed in a long time!!
-
Holy cow!!! LOL!! 15-20F over the next century huh?? NCEI better get their act together and let's increase those post hoc altered numbers and ramp up those raw numbers even more than they have in the past!! Let's hope they do that and quick before we all boil!!!
-
Nope! It simply says that statistically Avondale and East Nantmeal are the same during the years in question....they are if anything tightening the statistical differences as we move through the last 18 now going on 19 years! Maybe the other stations could be as advanced and precise as the 2 what you call "highest quality stations"