

Nomz
-
Posts
705 -
Joined
-
Last visited
Content Type
Profiles
Blogs
Forums
American Weather
Media Demo
Store
Gallery
Everything posted by Nomz
-
The Jan 31 Potential: Stormtracker Failure or 'Tracker Trouncing
Nomz replied to stormtracker's topic in Mid Atlantic
Their crashout would have been worse than ours last week -
The Jan 31 Potential: Stormtracker Failure or 'Tracker Trouncing
Nomz replied to stormtracker's topic in Mid Atlantic
After looking at f30 and consulting my ouija board: I have no idea -
The Jan 31 Potential: Stormtracker Failure or 'Tracker Trouncing
Nomz replied to stormtracker's topic in Mid Atlantic
hey I'll take .5 qpf -
The Jan 31 Potential: Stormtracker Failure or 'Tracker Trouncing
Nomz replied to stormtracker's topic in Mid Atlantic
RGEM west of the GFS but not as negative at end of run. More area to work with, but more work to do. Call it about even. -
The Jan 31 Potential: Stormtracker Failure or 'Tracker Trouncing
Nomz replied to stormtracker's topic in Mid Atlantic
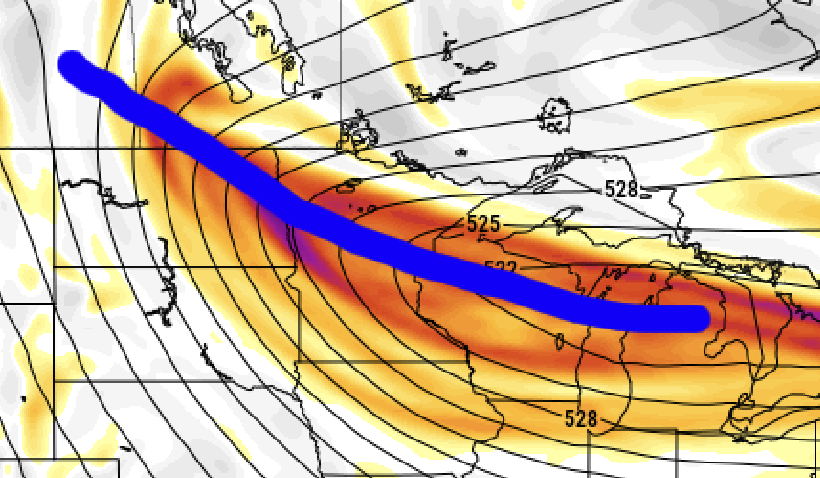
I was more looking at the western extent of the northern vort. Looked a little bit closer to negative too imo. (Icon left gfs right)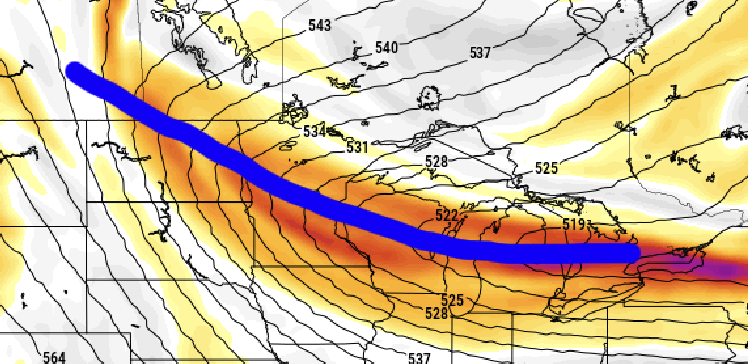
-
The Jan 31 Potential: Stormtracker Failure or 'Tracker Trouncing
Nomz replied to stormtracker's topic in Mid Atlantic
Bleh I lied. Struggling to get negative at h78 -
The Jan 31 Potential: Stormtracker Failure or 'Tracker Trouncing
Nomz replied to stormtracker's topic in Mid Atlantic
At h60 ICON might be a nuke -
The Jan 31 Potential: Stormtracker Failure or 'Tracker Trouncing
Nomz replied to stormtracker's topic in Mid Atlantic
https://efisher828.github.io/weathernext/ 12 hours delayed with limited maps but this is the best i know of -
The Jan 31 Potential: Stormtracker Failure or 'Tracker Trouncing
Nomz replied to stormtracker's topic in Mid Atlantic
NAM @ h78 looks better, but remember its still the NAM at range. Although I will say most of the improvements were made at initialization, which makes me think that the drops are probably positive data. -
The Jan 31 Potential: Stormtracker Failure or 'Tracker Trouncing
Nomz replied to stormtracker's topic in Mid Atlantic
Feels like its favoring the AIFS solution. edit: take that back it looks more GFS-like -
The Jan 31 Potential: Stormtracker Failure or 'Tracker Trouncing
Nomz replied to stormtracker's topic in Mid Atlantic
The bit of vort near Winnipeg. Further west and more amped/slower have ended up with good solutions so far. -
The Jan 31 Potential: Stormtracker Failure or 'Tracker Trouncing
Nomz replied to stormtracker's topic in Mid Atlantic
"Everything I don't like is an outlier" not great analysis imo -
The Jan 31 Potential: Stormtracker Failure or 'Tracker Trouncing
Nomz replied to stormtracker's topic in Mid Atlantic
NAM at h30 looks better than the AIFS (i don't have pivotal+) and UK, and worse than GFS and ICON. -
The Jan 31 Potential: Stormtracker Failure or 'Tracker Trouncing
Nomz replied to stormtracker's topic in Mid Atlantic
00z NAM is off and running -
Also fwiw, some subjective model reanalysis from 48 hours: https://forecastwatch.com/2026/01/27/major-u-s-snowstorm-forecast-accuracy-analysis-january-23-26/ Good to know everyone blew it for us
-
The Jan 31 Potential: Stormtracker Failure or 'Tracker Trouncing
Nomz replied to stormtracker's topic in Mid Atlantic
I believe thats what Euro AIFS and AIGFS do, no? Use AI to adjust raw model outputs? -
Was the weekend storm a miller c? From albright and cobb 2004. Checks out pretty well just from a brief look at mesoanalysis archive.
-
The Jan 31 Potential: Stormtracker Failure or 'Tracker Trouncing
Nomz replied to stormtracker's topic in Mid Atlantic
Meanwhile, I will glaze euro aifs till I die edit: can we also get a storm banter thread? -
I was not expecting it at all. Tbh very unimpressed by DC snow removal ops.
-
The Jan 31 Potential: Stormtracker Failure or 'Tracker Trouncing
Nomz replied to stormtracker's topic in Mid Atlantic
https://efisher828.github.io/weathernext/ Here's the only public source of weathernext 2 maps I believe. Like 12 hours behind and only ptype, rate, and 500mb heights. -
Preschool
-
Got another day off and my chem exam postponed so I will be staying up for this 00z suite
-
Why he say fuck me for
-
Yeah still looks just about the same as 12z and better than the other 12z models
-
Early returns (h30) say a hold


