

Stormchaserchuck1
-
Posts
4,625 -
Joined
-
Last visited
Content Type
Profiles
Blogs
Forums
American Weather
Media Demo
Store
Gallery
Everything posted by Stormchaserchuck1
-
80dbz on that cell SW of York, PA.
-
81F in Fallston. Hearing loud rumbles, was thinking it was some military testing or something, but it turns out there are strong thunderstorms to my north.
-

April Medium/ Long Range Discussion
Stormchaserchuck1 replied to Weather Will's topic in Mid Atlantic
Signs of a +EPO pattern around Apr 23-24. Above average temperature pattern if that verifies. It could occur +days -
2024-2025 La Nina
Stormchaserchuck1 replied to George001's topic in Weather Forecasting and Discussion
ENSO subusurface had backed away from the deep cold for a few days, now it's going back. -6c pool on the most recent TAO/Triton maps. Here is the progression over time. SSTs will likely catch up with the subsurface cold in the coming months. -
I don't know that they are the ones that developed the NAO originally, but it wasn't the CPC. NAO was defined in the 1950s/60s, I think, as sea-level pressure differences between ~the Azores islands and Iceland regions.
-
2024 Atlantic Hurricane Season
Stormchaserchuck1 replied to Stormchaserchuck1's topic in Tropical Headquarters
Another thing to note is, since October, the Hadley Cell has been expanded north, all around the globe. In the Summer, those mid-latitude cells lift north. The past doesn't necessarily predict the future, but lack of deep troughs digging, coupled with normal La Nina pattern could potentially create a more favorable pattern for US hits. All this while SLP has been below normal: https://ibb.co/KhfXCNz Earth's precipitable water has been record highest, a whole 120% #2 analog 2015-16, for the Sept-Apr period (records go back to 1948). https://ibb.co/cbLGHQV.gif.beafddba360b88108a80cad70155603b.gif)
-
That is interesting. We had a 4-contour Greenland block, but nothing rivaling the strength of even what we have seen the past few Winters. There seems be a major disconnect between CPC's NAO numbers and what is occurring in the NAO area, measured by sea-level pressure between Iceland and the Azore islands. This Winter came up with something like a +0.7 NAO for DJFM, but if you look at sea-level pressure and 500mb, it should have been measured negative. Either way, hopefully this is some sign that we will see more persistent -NAO's in coming cold seasons, as we had seen 41/46 +NAO Winter months, going back to 2013. and 16/16 of the NAO's >1.11 in the monthly's during that time were all positive. 16-0 since 2013. I think the larger reasoning is issues with CPC's measurements, but maybe the overall signal is turning around..
-
April Medium/ Long Range Discussion
Stormchaserchuck1 replied to Weather Will's topic in Mid Atlantic
This storm/rain for the last 3 days is actually from a Stratosphere warming that occurred in March. It "downwelled" to a -NAO, and as that -NAO block lifted out, we got this storm underneath of it. -
It's actually not very far away from snow, 48F here.
-
A tree fell here. https://ibb.co/j5wb1Cs
-
Wow what a wind storm!
-
2024-2025 La Nina
Stormchaserchuck1 replied to George001's topic in Weather Forecasting and Discussion
-PNA pattern starting to set in. https://ibb.co/DVGmNdf https://ibb.co/c1ws74X I've researched this, the PNA is more sensitive to ENSO central-subsurface than any other ENSO measurement, including surface SSTs and the MEI, at 0-time. -
2024-2025 La Nina
Stormchaserchuck1 replied to George001's topic in Weather Forecasting and Discussion
Really cold in the subsurface now. For comparison, this may rival the strongest subsurface anomalies we saw in this past El Nino..png.7cb2446f96216449c7b327a0d4a2c454.png)
-
2024 Atlantic Hurricane Season
Stormchaserchuck1 replied to Stormchaserchuck1's topic in Tropical Headquarters
All time Hurricane tracks East coast, US has been lowest relative to long term average, and vs Atlantic activity lately (since 2000).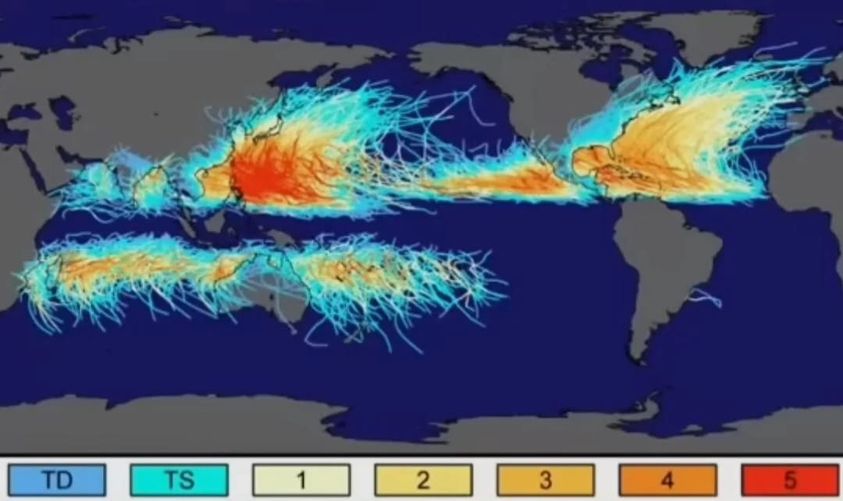
-
2024-2025 La Nina
Stormchaserchuck1 replied to George001's topic in Weather Forecasting and Discussion
The central-subsurface is cooling rapidly. https://ibb.co/SfXksss -
2024-2025 La Nina
Stormchaserchuck1 replied to George001's topic in Weather Forecasting and Discussion
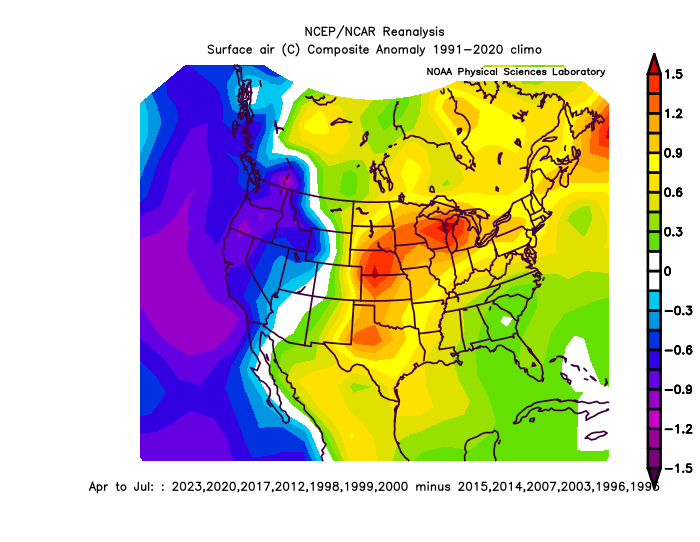
We had an expanded Hadley Cell/N. America SE ridge since late January: I've theorized that ENSO subsurface conditions have a stronger correlation to the N. Hemisphere pattern than the surface does at 0-time (not perfect, but more often than not, historically.. ). We had cold water move below the central-ENSO region during mid to late January... I made list of analogs matching this US Temp pattern, since the AMO went positive and PDO went negative ~1995. These transitioned from an east-based El Nino look in April, to a stronger La Nina by the following December.. (13 analogs):.gif.d717ac698f2c4a10884aaf50a88bae50.gif)
.png.f2b9851f2ed5ac441f82de5da35bda79.png)
-
2024 Atlantic Hurricane Season
Stormchaserchuck1 replied to Stormchaserchuck1's topic in Tropical Headquarters
Big US SE ridge pattern, extending up into Canada Jan 23 - March 14: Hadley Cell extends north in the Pacific and Atlantic Oceans in April (analogs rolled forward).. A correlation to following Atlantic Hurricane season has been strong since 2012: Positive analogs: 2023, 2020, 2017, 2012, Average Storms for Positive analog seasons: 21.8 NS, 9.8 Hurricanes, 4.5 Major Hurricanes Negative analogs: 2015, 2014, Average Storms for Negative analog seasons: 9.5 NS, 5.0 Hurricanes, 2.0 Major Hurricanes.gif.b61cb13a19bce3b451784df9e63a5dec.gif)
-
Late Feb/March Medium/Long Range Discussion
Stormchaserchuck1 replied to WinterWxLuvr's topic in Mid Atlantic
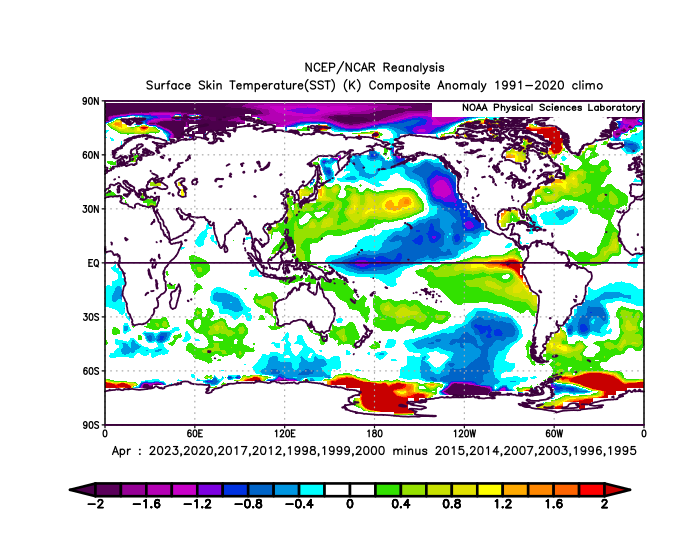
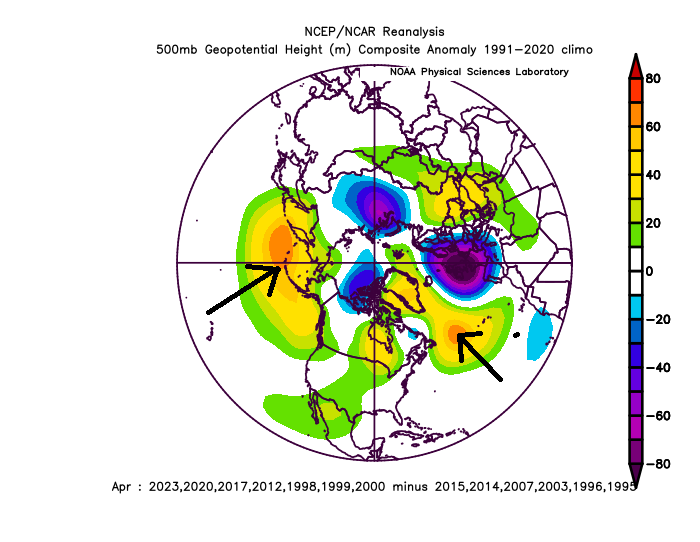
We may be headed for an above average Spring.. I know that's not saying much, but.. since the AMO went positive/PDO went negative ~1995 here are our top analogs to this composite since Jan 23rd: Positive analogs: 2023, 2020, 2017, 2012, 2000, 1999, 1998 Negative analogs: 2015, 2014, 2007, 2003, 1996, 1995 ^13 years since 1995... Roll-forward to April: April through July:.gif.7d71dee02bf8c54442db05f0a41d3c57.gif)
.png.c97359afe5cc34086ff2acc2ec224086.png)
-
2024 Atlantic Hurricane Season
Stormchaserchuck1 replied to Stormchaserchuck1's topic in Tropical Headquarters
CPC is now giving >80% chance of La Nina for peak Hurricane season Climate models are keying in on possibly a transition to Strong La Nina later this year The SE Atlantic Ocean is still very warm, as several countries in Africa have recently broken temperature records..png.51769e7a48fd48fc580c068456fef8f0.png)
.thumb.gif.615c5b49c917d9211804cc5eb39f95c1.gif)
-
Late Feb/March Medium/Long Range Discussion
Stormchaserchuck1 replied to WinterWxLuvr's topic in Mid Atlantic
Yup, two warm days, and the LR look for significantly below average/-NAO is gone.. Models initialize current conditions out. For example, if they are saying the LR is going to be severely cold, and first you have two 70+ degrees, you should figure that during those two days the LR models are going to completely lose the cold signal. -
Easily coasting up to 76 here in northern MD
-
Denver area continues to do well with snowfall. They are in a sweet spot with the warming, like NYC was 2010-2015. Meanwhile, we are almost 80 in Baltimore. https://ibb.co/3rGsDRd
-
The sun is pretty hot today. Like, hot. This thing is taking over pretty quickly.
-
Late Feb/March Medium/Long Range Discussion
Stormchaserchuck1 replied to WinterWxLuvr's topic in Mid Atlantic
Pretty awesome pattern for below average here: https://ibb.co/bsDzrQg Too bad this didn't occur in the Winter time.. The Pacific pattern actually changes this weekend, and sometimes when we have cold the day of (warm the day of too), models go more aggressive on the same pattern initialized out down the road. I think we can hold out some hope for some snow flakes in northern MD by the end of March.. With that being said, it is 70 degrees out the next 2 days, and the PDO still has not changed, so the same model trend that has occurred all Winter has a chance to repeat in the next few days, going not as aggressive with the cold in the LR.. If it holds though, that's a really nice look at least for some below average conditions in the NE for the last few days of March and into early April.. We do have a strong 10mb warming going on now, so that at least supports what the model shows (average time lag at this time of the year is +10-15 days)...gif.25e72d9d918da2214119185c7b186f42.gif)
-
Late Feb/March Medium/Long Range Discussion
Stormchaserchuck1 replied to WinterWxLuvr's topic in Mid Atlantic
Upon further review, there is something wrong with the CPC's NAO calculation. This is not a strongly positive NAO: Looking back over past Winter's, there were a few -NAO's in there too, that were deemed to be positive. The NAO is calculated by sea-level pressure differences between Iceland and the Azores. High up top, Low at the bottom, is -NAO. Low at the top, High pressure bottom is +NAO.


.gif.21bd0f0c018d85603835453c01933f32.gif)