

TheClimateChanger
-
Posts
4,397 -
Joined
-
Last visited
Content Type
Profiles
Blogs
Forums
American Weather
Media Demo
Store
Gallery
Everything posted by TheClimateChanger
-
Central PA Winter 23/24
TheClimateChanger replied to Voyager's topic in Upstate New York/Pennsylvania
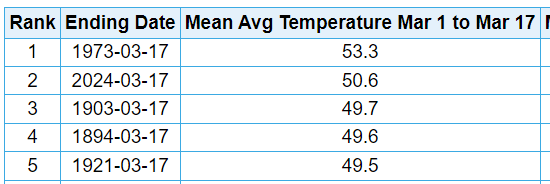
In what has become a common refrain, yet another scorching start to the month in the Commonwealth. Harrisburg Williamsport Erie Philadelphia Pittsburgh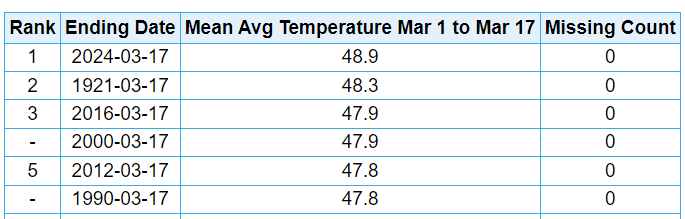
-
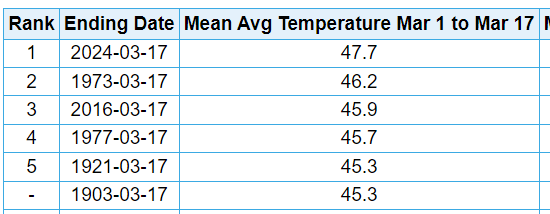
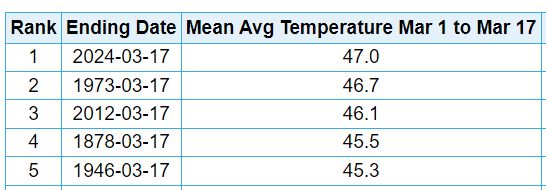
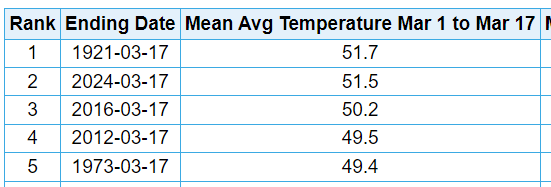
Pittsburgh/Western PA Spring 2024
TheClimateChanger replied to Ahoff's topic in Upstate New York/Pennsylvania
Second warmest start to the month, through yesterday.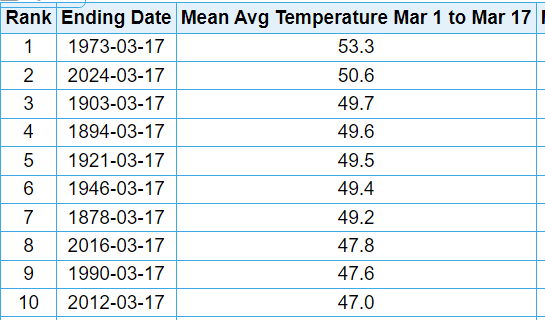
-
Spring/Summer '24 Banter and Complaint Thread
TheClimateChanger replied to IWXwx's topic in Lakes/Ohio Valley
This is a good discussion for the banter thread. Much more topical than most posts that are made in the banter threads. -
March 2024 General Discussion
TheClimateChanger replied to HillsdaleMIWeather's topic in Lakes/Ohio Valley
-
Spring/Summer '24 Banter and Complaint Thread
TheClimateChanger replied to IWXwx's topic in Lakes/Ohio Valley
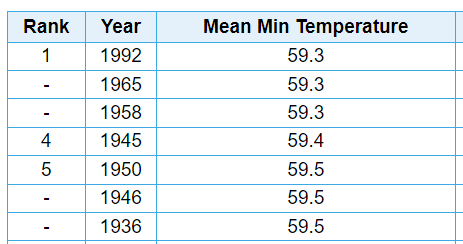
The so-called hottest summer on record was downright pleasant in Detroit outside of a single week. Even including the 7-day heat wave, it was a moderate summer and fairly mild by modern standards. The mean temperature of 71.2F places 57th in the threaded record. In the past 9 years, only 2015 & 2023 have been cooler (and both by very small margins). By contrast, 2016 was nearly 4F warmer than 1936! And to be honest, it makes much more sense to compare this to records observed at City Airport (DET) since that it was where the official temperatures were observed in 1936. On that metric, it was the 27th COLDEST summer out of 90 years of records. Incredibly, removing one 7-day stretch would drop the summertime mean to 69.9F. I know you can't do this, but it gives a much better reading of the overall character of the summer. And that was one of low humidity and generally mild weather, with cool overnight lows, punctuated by a few episodes of extreme heat, including one colossal 7-day stretch in early to mid-July. At these levels, you'd be looking at the 12th coolest of 90 years at DET and 44th coolest of 150 years in the threaded Detroit area records. The 59.5F mean summer minimum is 5th lowest on record, out of 90 years' worth of observations at Detroit City Airport. That value has not been exceeded in recent decades since the volcanically cooled summer of 1992, and even then only by a negligible amount [59.3F]. In the threaded record, it's only 26th coldest of 150 years, as the coldest minima are dominated by the 1960s-1980s records from DTW when it radiated like a freezer at night [developed in low density suburb]. Still pretty cold either way. Ignoring the 7-day inferno [July 8-July 14], the mean minima the rest of the summer was just 58.4F, which would easily be the coldest on record at DET and would tie 1875 for 10th coldest in the threaded record. Regarding the heat wave, you can pull up the old records and see the humidity and dry bulb temperatures at 3 periods each day. The mean dewpoint was probably around 55-55.5F, based on those observations. This is less than even the "frigid" July of 2009 when the average dewpoint at Detroit was a comfortable 56.3F. During the worst of the heat wave, humidity was generally very low. Under these conditions, the heat index would not greatly vary from the dry bulb temperature. Despite the extreme temperatures, there have been more dangerous conditions in recent summers when factoring in the cumulative effect of high dewpoints and temperatures. The most extreme heat indices in Detroit were experienced not in 1936, but in 1995, when triple digit temperatures were combined with dewpoints nearing 80F - rather than in the 50s. The combination of generally moderate temperatures and very low humidity would have made the summer of 1936 more comfortable than the majority of recent summers in Detroit. If those same conditions repeated this year, and I tried to point out the upper 90s/100s as the result of climate change, you would no doubt change tune and attempt to rebut my assertion by going on about how cool and dry it was for the majority of the summer.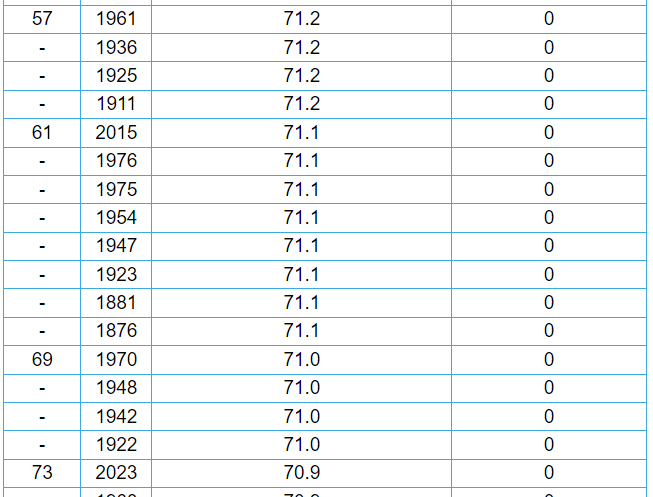

-
Spring/Summer '24 Banter and Complaint Thread
TheClimateChanger replied to IWXwx's topic in Lakes/Ohio Valley
Looks like you guys are doing alright. 4 of the top 16 years in the past 13 summers [with a 150 year period of record]. At least it's not the 19th century. I don't see a single year before 1916. -
Spring/Summer '24 Banter and Complaint Thread
TheClimateChanger replied to IWXwx's topic in Lakes/Ohio Valley
Some of the co-op data has also, unfortunately, been manipulated. If we compare the raw data from Saginaw to the "official" records, we see numerous instances of mistakes and/or temperatures just completely made up and not borne out by the actual observation. It looks like there's potential issues on the 14th, 23rd and 29th from July 1936. The high on the 14th on the record was observed as 92F, curiously below the set max of 98F on the previous day. I've seen this in the past and the temperature is often bumped up the high temperature, assuming the observer somehow reset the temperature device afterwards. Of course, I would surmise that the set max was simply incorrectly reported and it is showing the max set on the prior day, but bumping it up one day to the day it impacts. In this case, they simply made up a 104F high on that date! Unbelievable - that's the sixth hottest temperature observed at Saginaw, and it wasn't even observed. The high was clearly reported as 92F! I mean maybe you could make a case for adjusting to the set max, but simply making up a value - what?!? And not only making up a value, but generating one of the hottest readings in the entire threaded record from thin air. Same thing on the 23rd. High reported as 79F, but goes in the "official" books as 85F. Not only 6F above the actual observation, but 5F above the reported set max from the prior day. Again, it's one thing to bump it up to the set max. But why make up a reading?!? On the 29th, they bumped the observed high of 70F up to the 77F set max from the prior day. Reasonable, but again relies on the assumption that the observer was reporting the set max from that day - and not the prior day's set maximum. That's how it was supposed to be reported, but you can see how that could be screwed up. Easier to mess that up than somehow reseting the max thermometer a second time without reporting it, IMO. Also, while not a big error, the high on the 10th is clearly reported as 106F, not 107F as shown in the "official" records. Admittedly, the 104F on the 14th is more in line with surrounding observations, but it's worth noting that a sharp cold front passed through that day, and would have made it to Saginaw earlier. It could have generated a wind shift off of the bay into the city. Either way, there shouldn't be record temperatures made up from thin air without justification. The effect of all these errors, irregularities and/or adjustments is to bump up the monthly mean high by 0.8F and the monthly mean average by 0.4F. The "adjustment" to the 29th also has the effect of deleting what would be the third coolest maximum temperature on record for July 29th in Saginaw. So we're going to delete the 70F high because it was maybe (possibly) 77F the previous day when the observer reset the thermometer? Not even certain about that, but maybe. I mean I can see making those adjustments to the climate record [USHCN, GHCN] since there's an explicit adjustment for TOBs, so you want to make sure it's being applied properly. But these are unadjusted values presented for informational purposes only - not for any sort of climate research. What in the world is the justification for adjusting the ThreadEx values?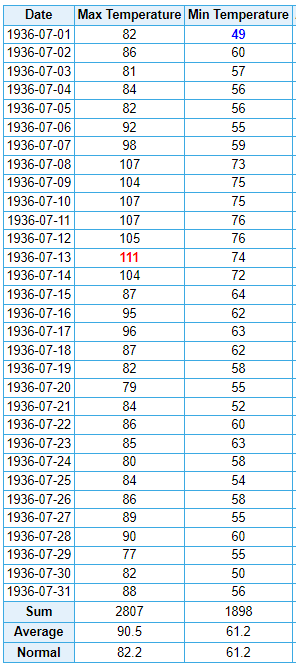

-
Spring/Summer '24 Banter and Complaint Thread
TheClimateChanger replied to IWXwx's topic in Lakes/Ohio Valley
Just for the record, when you compare the raw data from Flint and Saginaw to Detroit, a good chunk of the difference (admittedly, not all - but a good chunk) is completely explainable by the fact that the old Co-op data was not gathered on a midnight-to-midnight time frame, but rather late afternoon. A 5 pm observation time adds about 1F to the mean temperature relative to a day ending at midnight. Obviously, this is not a problem in the Detroit threaded record since it's always been a manned weather bureau station [with a midnight to midnight day]. Understanding Time of Observation Bias | Climate Etc. (judithcurry.com) -
Spring/Summer '24 Banter and Complaint Thread
TheClimateChanger replied to IWXwx's topic in Lakes/Ohio Valley
Here are Detroit's hottest summers on record. Just look how unbelievably hot it was in 1933! I guess I was wrong! Cue rant about Urban Heat Island Effect in 5, 4, 3, 2, 1!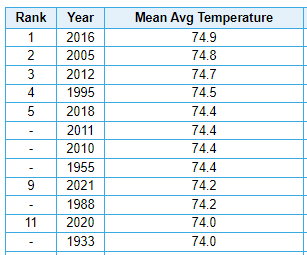
-
Occasional Thoughts on Climate Change
TheClimateChanger replied to donsutherland1's topic in Climate Change
It's important to note when people complain about adjustments to the temperature record, what they are really saying is that they want to use flawed data because it gives them a more favored result. Time of observation makes a HUGE difference, especially in the summertime when weather variance tends to be at an annual minimum. We know this, and we correct for it. -
Occasional Thoughts on Climate Change
TheClimateChanger replied to donsutherland1's topic in Climate Change
I don’t understand this obsession with using flawed data. Why would you use the unadjusted numbers when they have known biases? How does that make more sense than adjusting for the biases? -
Spring/Summer '24 Banter and Complaint Thread
TheClimateChanger replied to IWXwx's topic in Lakes/Ohio Valley
Summer is almost certain to be a scorcher. Just looking over the numbers for some recent summers, and it's insane. At Toledo, 3 of the top 5 hottest summers have occurred this decade [and it's only 4 years old]. At Mansfield, Ohio, the top 2 hottest summers have occurred in the past 4 years. At Akron-Canton, ALL of the top 5 hottest summers have occurred in the past 8 years. Cleveland has lucked out a bit on the summer heat front, but still 4 of the top 8 have occurred in the past 14 years, and 5 of the top 8 have occurred in the past 19 years. These are all long period of record sites. Despite all this, we'll still hear about how much hotter it was in the 1930s! -
March 2024 General Discussion
TheClimateChanger replied to HillsdaleMIWeather's topic in Lakes/Ohio Valley
I wonder if the enhanced atmospheric carbon dioxide helps green things up too. Was 394 ppm in 2012, and today it’s 425. -
March 2024 General Discussion
TheClimateChanger replied to HillsdaleMIWeather's topic in Lakes/Ohio Valley
Wow, can you imagine this today?!? -20F in north central Ohio on March 12. -
Occasional Thoughts on Climate Change
TheClimateChanger replied to donsutherland1's topic in Climate Change
-
Central PA Winter 23/24
TheClimateChanger replied to Voyager's topic in Upstate New York/Pennsylvania
Wasn't a good year in western Pennsylvania either. I know Soergel's had to cancel their strawberry festival last year, although they did get some strawberries later in the season after it started raining again. Looking like fruit growers are going to have a tough time navigating this new climate. Spring just doesn't seem delayed enough anymore to retard plant growth sufficiently to counter the threat of spring frosts and freezes. -
Pittsburgh/Western PA Spring 2024
TheClimateChanger replied to Ahoff's topic in Upstate New York/Pennsylvania
-
Pittsburgh/Western PA Spring 2024
TheClimateChanger replied to Ahoff's topic in Upstate New York/Pennsylvania
A little stat padding spring snow that will melt in between each snowy interval. -
Occasional Thoughts on Climate Change
TheClimateChanger replied to donsutherland1's topic in Climate Change
-
Pittsburgh/Western PA Spring 2024
TheClimateChanger replied to Ahoff's topic in Upstate New York/Pennsylvania
Don't worry. I am sure there will be plenty more record warmth to come. Even I've grown tired of the constant record warmth and taken a bit of a break despite that fact that various records continue to be approached or broken all over the place. -
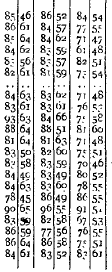
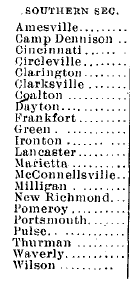
Just a bunch of nonsense. It was actually allegedly 96F in Portsmouth, Ohio, in March 1907. Apparently Chris tossed that value. Shown below are March 22-24, 1907. Look at this nonsense. Green was 3 degrees warmer than Portsmouth, and 5-15F warmer than every other site on the 22nd. Portsmouth was 8-19F warmer than the rest of southern Ohio on the 23rd, and 7-24F warmer on the 24th. Funny how we don't see this extreme random site variation with modern equipment - almost like those values aren't very reliable, and should be tossed! Which makes it all the crazier when we do beat statewide record maxima, as in the case of Michigan in February. Not just an isolated station or two, but fully half or more of the state! So the tl;dr, this is probably the worst possible metric to gauge climate change. As you pointed out, monthly means are a much better way to evaluate that since these questionable extremes are filtered out through averaging.
-
Damn, Forky just predicted a record number of EWR is running too high this summer the other day. And it’s already started. Best prediction yet.
-
Philadelphia Historical Snowfall Data:
TheClimateChanger replied to ncforecaster89's topic in Philadelphia Region
Agreed. Also, 1949-1950 was officially observed as 1.9", even though it's now given as 2.0". There was a trace of snow reported on March 2nd, but it's been changed after the fact to 0.1". Obviously, today, that would be a measurable snow on an official measuring board [0.01" of precipitation with temperatures at or below 31F all day], but at the time it was reported as a trace. I'm sure there are plenty of days like this in the official records, suggesting an undercount in earlier years. -
Central PA Winter 23/24
TheClimateChanger replied to Voyager's topic in Upstate New York/Pennsylvania


