

Ed, snow and hurricane fan
-
Posts
1,618 -
Joined
-
Last visited
Content Type
Profiles
Blogs
Forums
American Weather
Media Demo
Store
Gallery
Posts posted by Ed, snow and hurricane fan
-
-
1 hour ago, Torch Tiger said:
wow

There is someone on the tropics threads who posts 16 day op GFS to prove the Atlantic is dead. @GaWxknows his or her name.
-
Is there any real way of knowing where in the Northern Hemisphere the cold following a SSW happens?
-
 2
2
-
-
It appears WPC isn't really buying it, but 0Z and 6Z Euro have a 2 to 4 inch rain bullseye general vicinity of Houston Christmas Eve. GFS has the heaviest rain toward NC Texas.
-
10 minutes ago, Cuteirishgirl25 said:
Yes, it’s true. We are in a warm cycle when it comes to the weather especially the oceans and have been for quite some time. but the crap they’re trying to sell you on mainstream media that it’s the human race causing it’ are a bunch of liars. Still waiting for Al Gore to apologize to everyone when his predictions did not come true he said back in 1998 in his book earth in the balance that our kids would only be able to see Snow in textbooks. The conveniently always forget about the medieval warm period.
On the one hand, the Earth has been warming for several hundred years. OTOH, all time temperature records in polar regions of North America and Asia is a little concerning. Record Atlantic ocean temps as well last Summer. It looks like there is anthropogenic influence superimposed on the normal climate change. I'm no liberal, I haven't voted Dem since 1992, and have been solid R except for 2016, I voted 3rd party. But not Dem.
-
2 hours ago, Typhoon Tip said:
"those forecast" in deference to the above are a mean of all the ensemble members. They literally take the average of all the ensemble members.
Each member has slightly differing physical equations, but they are not 'guess work'? I'm not sure precisely what you mean by "empirically derived equations" but ... the physical equations built into each do not produce impossible solutions. They wouldn't be of much use if that were the case.
Each focuses in a specific aspect of atmospheric physics. There's probably documentation on each member's "genetics" ( if you will). Ho man - can you imagine the Asperger spectrum required to read that? Like Member 6 uses some experimental convective sequencing - now ... go and match all those days whence ever those were valid, and if those valid days match the circumstance at hand... weeee.
Popsicle headache.
Meanwhile member 7 ... some other variant, and on and so on. This stuff actually matters, because the thing about cloud creation (efficiency/proficiency: That releases latent heat during the pseudo adiabatic machinery of the storm, which if done by X physics may or may not be more correct than if done so by way X', or Y or whatever.
The operational version's just employ what's worked the best in the past, through objective comparison with reality through experimentation.
I may be butchering some of this but in principle that's the gist.
Having said all that, the individual ensemble physical implementations don't change ( unless a wholesale new version is rolled out). They're just process out into the future based on whatever is given them. Which is the initialization provided by sounding/satellite
I know the general nature of ensemble modeling, petroleum reservoir engineering involves mass balances and radial diffusivity and multiple phase fluid flow in heterogeneous and anisotropic materials. Seismic modeling gives general depths and shapes of underground reservoirs, the rest is data gathered from individual oil wells, and even as just an undergrad, models in the 80s ran what was called 'Monte Carlo' variation of data, because engineers have so little data they actually know, they must run the models with varying inputs, assign probabilities to changes from the best guess, and finding a mean and range of likely outcomes. The solution of the radial diffusivity equation is so complex simplifying assumptions are made and transforms are used. I still loathe my 'systems of linear differential equations' class at UT. I remember being tormented trying to convert things in LaPlace space back. Back in the day, oil companies had the most expensive super-computers.
What I meant by empirical, a French sewage engineer named D'Arcy did experiments and came up with an equation for fluid flow as a function of differential pressure, size, length of porous media and viscosity of the fluid from that data. Darcy's Law, the key to aquifer and petroleum engineering, was not based purely on physics. I assume in weather many things are based purely on physics, I wondered if somethings were best fit data derived from experiments and observation. I think the below answers that (empirical formulas are used), or changes in the base state, warmer oceans seems like the most significant, will affect model performance.
QuoteThe operational version's just employ what's worked the best in the past, through objective comparison with reality through experimentation.
-
1 hour ago, Typhoon Tip said:
Unfortunately ( well ... not for you
") but for the winter enthusiasts), the numerical teleconnection spread shuts down cold loading into North America, ~ after the 20th. This is also in conflict with the erstwhile consensus for wintry turn at the end of the month, interestingly.
but for the winter enthusiasts), the numerical teleconnection spread shuts down cold loading into North America, ~ after the 20th. This is also in conflict with the erstwhile consensus for wintry turn at the end of the month, interestingly.
I've been keeping track ...about 3 or 4 days ago, the WPO projection flipped sign. As of last night, all the way up to +2SD. And then out around the 20th or so, the EPO goes positive mode. There is a lag correlation between the two, where preferentially ... the EPO will eventually modulate in favor of the WPO's sign - given time. So the EPO rising isn't a surprise considering -
What all this means is, that giant Chinook generator pattern is not a terrible fit for the strengthening +WPO/+EPO.
None of this hugely confident. Even relative to climo/modeling climo that is so. We've been observing wholesale hemispheric modulations that are unusual - considering the mass of the whole thing? Definitely either an artifact of modeling (somehow) or something weird is happening... where pattern identity become mere simulacrums that disperse like farts in the wind, and we're looking at something else entirely about ever 3 days. So I'm not completely sold that the above Pacific scaffolding is going to become history.
How much empirically derived equations go into those forecasts as compared to strictly dynamics/physics. If something in the base state has changed, maybe warmer oceans globally, empirical based predictions that worked before won't work as well now.
-
4 minutes ago, Torch Tiger said:
Oh definitely, and of course no one said "slam dunk" anything. tbh, your posts HERE (can't speak for other subforums) are generally LR stuff and pimping ensemble products. That's really all I can speak of and address.
If nothing is happening short term besides a wind/rain/far interior elevation snow in the near term, all there is to discuss, besides that, is medium range and beyond forecasts. Pimping ensemble products? What does that even mean. I don't know too many people who don't use ensembles for 500 mb pattern or things like the NAO, ENSO, strat warms and the such.
I like mets discussing those things because I am weak on my correlations and thus like seeing discussions on them.
-
1
-
-
On the one hand, I wonder what the NMME verification is at 8 months lead time, probably not particularly high. OTOH, El Nino should go neutral early in the season, and I see forecasts for the Atlantic to be cooler next season.
2024 thread will be interesting.
-
GFS and Euro have rain, but it doesn't look that good for severe, but we are days away.
-
1
-
-
15 minutes ago, dendrite said:
Radar look more like ass than the Pats offense
Per Twitter, 1938 was last time a team gave up 10 or less losing 3 straight games.
-
1 hour ago, Layman said:
To be fair, it seems like you could log on any 5 of 7 days during any given week and find something similar.
I was reading the NE and NYC forums the Friday before Boxing Day 2010 (born in Queens, family near Boston, time spent both places) and the gloom and doom was so bad. At the time, there were a lot of Sabbath observant people in Brooklyn (I think many have since made aliyah) who logged off with crushing disappointment and logged back on Saturday evening to blizzard warnings. It was such a happy thing to see. People verbally dancing in joy.
-
32 minutes ago, MJO812 said:
Remember when it use to snow in December ? Meh
Even in the cold 76-77 Winter the first real snow was Christmas night. Snow on the ground Christmas morning in the NYC metro (and I suspect most of I-95) wasn't that common. It will only get worse as it seems like the offshore Atlantic waters are getting warmer.
-
On 11/30/2023 at 8:57 PM, Powerball said:
It's been a while since I've seen a severe weather setup bust as bad as this one.

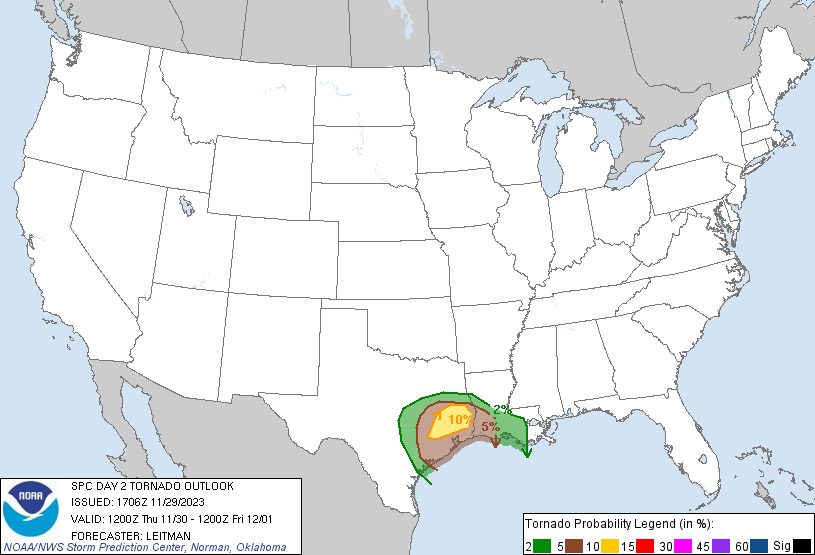
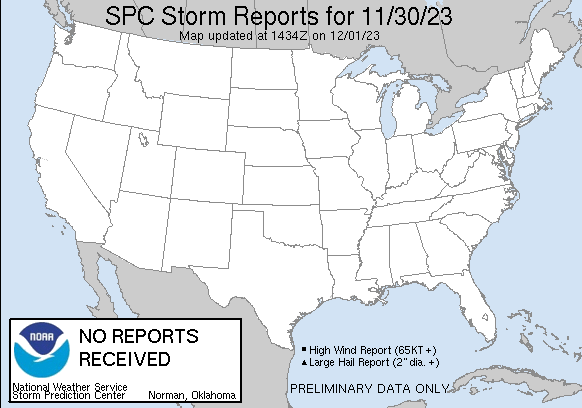
Models never really suggested enough instability for enhanced, but in fairness to SPC, they stated it was very conditional, and I think you'd rather have an enhanced that busts than a marginal with several EF2 or greater tornadoes.
-
2
-
-
Enhanced risk N part of HGX CWA, my house on the edge of Enhanced, Houston and S is Slight. Looking at 3k NAM and FV3, I don't think the 10% tornado probability area will verify. Shear and vorticity are there, instability is not that exciting. Maybe some cold season brief EF-0 and EF-1s. I guess we'll see if the Enhanced is still there at the mid day update.
-
How does this El Nino end as forecast to in Summer 2024? Looking at the forcing posts earlier, the change in the Walker Circulation would cause weak Easterlies or WWBs forever. But obviously it doesn't, because El Nino's do end. What is the key signal I should be looking for next Spring/Summer to know Nino is ending?
-
57 minutes ago, brooklynwx99 said:
perhaps the speculation that this may, indeed, act like a Modoki event due to the WPAC warm pool might not be so ridiculous? we shall see
Larry Cosgrove, retired met, seems to think Modoki:
QuoteThis appears to be a west-based "Modoki: event taking shape, as waters near the Galapagos Islands are cooling. El Nino measures that are strongest in sectors 4 and 3.4 favor colder outcomes in the eastern two-thirds of North America.
-
2
-
 1
1
-
-
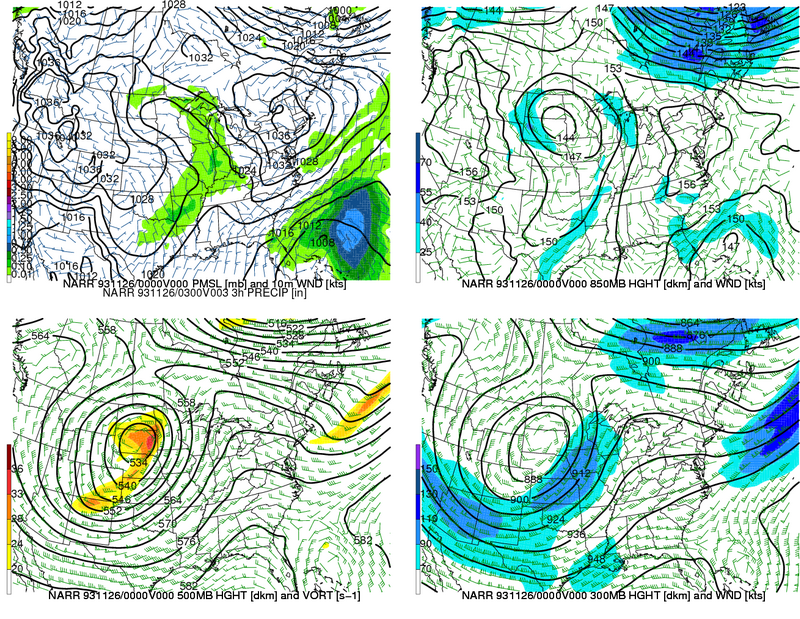
17 hours ago, Chinook said:
I recently watched a video on Youtube, today, about the Cowboys vs. Dolphins memorable sleet-game of 1993, Thanksgiving Day, which was 11/25/93. Players were slipping on the sleet.
Let's take a look at the weather system. The cold front seems like it moved well southeast of Dallas by game time. There was precipitation in a band from SW to NE across the Southern Plains. Apparently this system gave all sleet to Dallas for before/during this game. The 850mb temperatures were above freezing according to this NARR reanalysis, and the 1000-500mb thicknesses well above the typical value 5400m for snow. Surface analysis by the NWS said Dallas had 31 degrees with a dew point of 15 degrees at 12z (6:00AM). By my guess, the surface temperature was just below freezing with sleet falling, and 850mb temperatures just above freezing to possibly 2 degrees C.
I was home from college in Bedford, TX, about 5 mile W of S end of DFW airport. IIRC, there was a little thunder. I remember another sleet storm in DFW when I was in college which had fairly frequent lightning. Probably during one of my ~1 month long Christmas breaks,
-
1
-
-
1 hour ago, stadiumwave said:
I'll argue that weather & climo thoughts have been hijacked by hysteria. Here is just a short list over te last 20 years of the new "permanent":
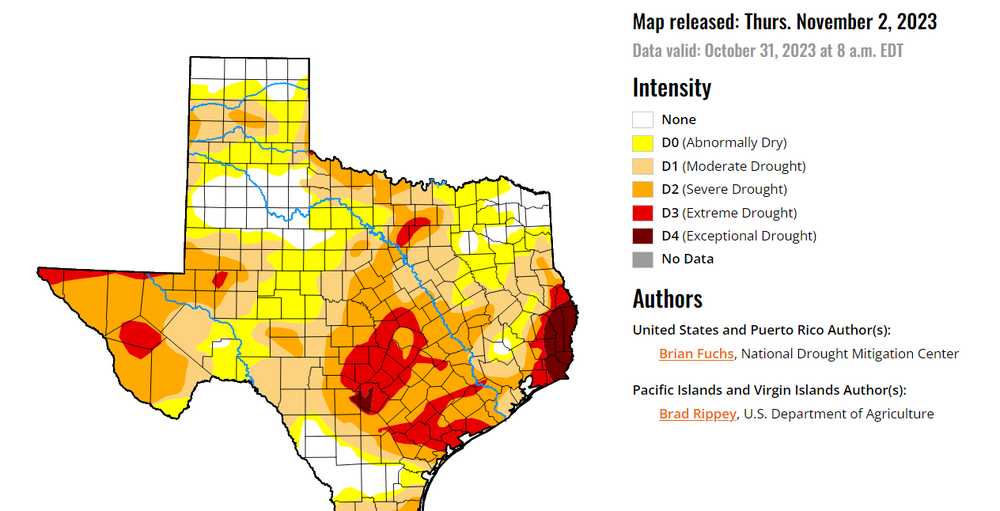
-perma-drought in Texas > Whoops
-perma-west coast ridge > whoops
-perma SE ridge > will be a whoops
Too much jumping to foolish conclusions due to all the hysteria. Hysteria is never good for any field of science. It leads to shallow, quick judgments & a complete inability to be objective.
So, relative to a stuck perma-SE ridge talk, that's just stupid hysteria talk that belongs over in the "planet saver" forum...in my opinion; although the poster saying it is a good poster.
Living in Texas the last 40 years, Houston area the last 23, the idea of a Texas perma-drought being a whoops is not correct. It has definitely been dryer since 2011, even with events like the 2017 floods.
-
1
-
-
-
Suggestion in SWODY 1 of a possible Moderate later today.
-
On 11/10/2023 at 10:02 PM, MattPetrulli said:

1. Southwestern Caribbean Sea:
A broad area of low pressure is forecast to form in the southwestern
Caribbean Sea by the middle of next week. Thereafter, environmental
conditions appear conducive for gradual development of this system
while it meanders in the Caribbean Sea through the latter part of
next week.
* Formation chance through 48 hours...low...near 0 percent.
* Formation chance through 7 days...low...30 percent.
NHC was up to a cherry, it is now back to an orange.
-
 1
1
-
-
6 hours ago, jbenedet said:
Sub tropical system for the Texas coast late Sunday into Monday. Likely not officially recognized as such but the guidance clearly shows those features.
Latest 12Z GFS phase forecast via FSU web site is cold core. Highs here forecast in the low 60s Monday, I had thought of it earlier looking at the models as the Texas version of a Nor'Easter, just at least a month too early for snow. I imagine the 1895 storm resembled it.
NHC lemon seems mostly driven by the GFS and family, but it has a few Euro ensemble members that develop a TC strength system.
-
0Z Friday PWAT on 12Z GFS AOA 2 inches along the coast ahead of the front. Even DFW approaches. (TT regional views don't have PWAT, tropical views do, looking at WATL) 5 inch Thursday into Friday bulleye near Victoria. Nice rain forecast along the Texas coast, near or below an inch up in DFW. Drought is sneaking back.
-
Cold front is a day early per Thursday/Friday forecasts and about 6 hours early per last nights forecast. Only a couple of hours away from Houston and it was forecast last night for the evening. Noon CDT/11MDT map.


January 2024 -- Discussion
in New England
Posted
I noticed that a long time ago and assumed it was because day length and sun angle can be described fairly well as a sine function, or a third of the way from the Solstice to the Equinox everything is half way to late March. Why, if I understand, the Saturnalia is the 25th, not the 21st, the rate of change is so miniscule in late December, it takes 4 days past the Solstice to notice the day lengths are increasing. Although that would seem to imply the Romans were behind most cultures if it took them over half a week to notice the increase in day length.
EDIT TO ADD: If the SSW is 2 weeks away, and the cold follows ~3 weeks later, if it follows, ensembles looking warm in 2 weeks isn't a season cancel, no?