

csnavywx
-
Posts
4,302 -
Joined
-
Last visited
Content Type
Profiles
Blogs
Forums
American Weather
Media Demo
Store
Gallery
Posts posted by csnavywx
-
-
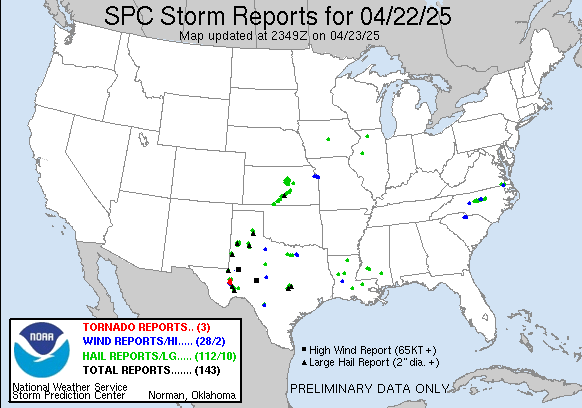
Meh, mostly a bust for our area. Cells struggled as they came off high terrain over N Va and most of MD. Needed a bit more BL moisture to avoid it being partially mixed out in the PM hours. Where that was available, they did pretty well.
Ironically, we'll probably get better storm coverage today with higher quality BL moisture and direct forcing from the upper trough. Shear is light, so shorter-lived multicells only.
-
 3
3
-
-
Deeper mixing is indeed a failure mode here but the HRRR is probably overdoing it, esp if there is any debris in the morning from overnight activity.
-
 1
1
-
-
30 minutes ago, Kmlwx said:
Look at this from the 6z Euro for 3z on Monday evening.
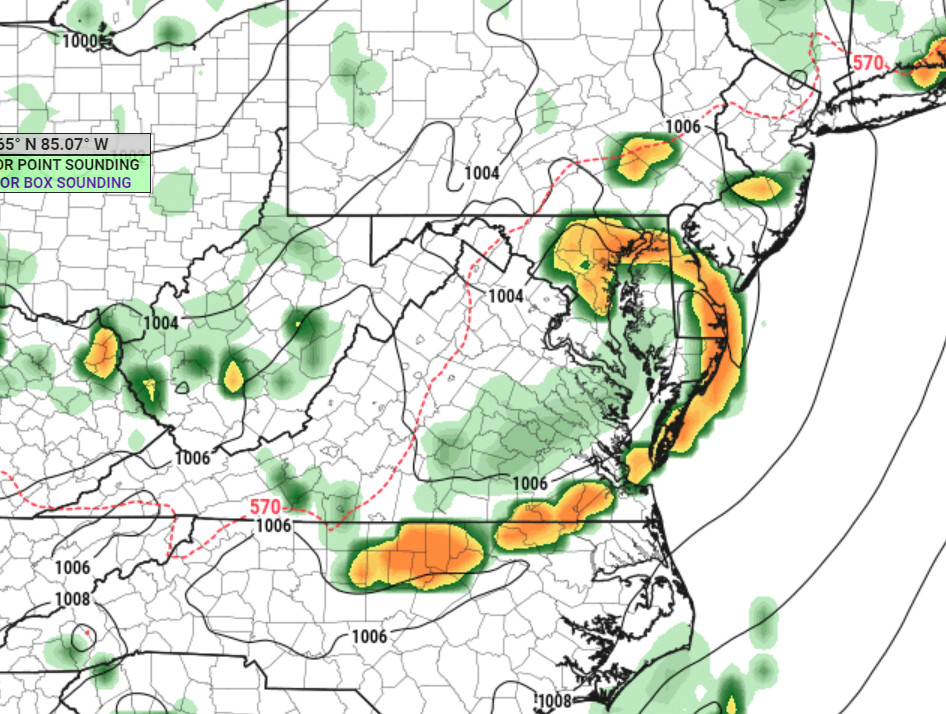
Yep. My favorite theta-e delta method (diff of average boundary layer theta-e and average minimum mid-level theta-e) is sitting around 30-35 deg. K on the 3km NAM. My typical threshold for summer severe is 25 or slightly less on global models along with 35-40kt of wind somewhere in the 700-500mb layer to provide adequate shear. In this case, we've got that and some directional shear. I'm still a bit wary convective debris from overnight activity here but if there's no big organized, long lived MCS upstream, then what cloudiness there is might actually help tamp down BL mixing a bit in the late morning hours. Leaning towards ENH being necessary here without major changes.
-
8
-
-
Monday getting my attention. Remnant EML + DPVA from big, broad trough setups are pretty reliable producers. Still a bit far out and daytime mixing and convective debris are always concerns, though favorably cool mid-level temps make it less sensitive to boundary layer moisture issues.
-
9
-
-
1 hour ago, bluewave said:
We got the WWBs but they were in the WPAC and EPAC instead of near the Dateline. Would be an interesting study to see what lead to this particular evolution. The WPAC kelvin wave development from last winter was in response to the IO WWBs crossing into the WPAC. Then the anomalous EPAC WWB in March rapidly warmed the EPAC.


Warm pool in the NE Pac may be a contributing factor as well.
-
Finally seeing a bit of a trade surge near the dateline, albeit weaker and later than originally forecast a couple weeks ago and paired with (initally) westerly anomalies and outright westerlies north of the equator from 140W on east. That's likely the reason 3.4 has shot up quickly. Should see some flattening off of that trend once the trades pop back up in the next several days. However, this trade surge looks rather limited in duration. Perhaps 2 weeks tops. EPS is more like 7-10 days.
-
2
-
-
Btw, no argument that May melt ponds are a significant contributor! It's a good theory with consistent results. However, it's a tool like any other.
-
29 minutes ago, bluewave said:
Upper patterns are very difficult to forecast in Arctic beyond a week and sometimes two. The one thing we can say now is that we didn’t see the record preconditioning event like occurred in May 2020. That was the only year in the last decade that came close to challenging 2012. The model based on May 2020 melt pond fraction did a great job. It also did reasonably well with other recent years.
https://www.arcus.org/sipn/sea-ice-outlook/2020/juneExecutive summary" of your Outlook contribution (using 300 words or less) describe how and why your contribution was formulated. To the extent possible, use non-technical language.
We predict the September ice extent 2020 to be 3.8 (3.3-4.3) million km2. This is the lowest prediction we have made based on spring melt pond fraction. The likehood is around 30% that this September extent will be a new minimum record. In our model simulation since 1979, May 2020 has the highest mean melt pond fraction for May including some unprecedented melt pond formation in the Central Arctic during 15-18 May when air temperature exceeded 0deg C.This statistical model computes a forecast of pan-Arctic September sea ice extent . Monthly averaged May sea ice concentration and sea surface temperature fields between 1979 and 2020 were used to create a climate network (based on the approach of Gregory et al 2020). This was then utilised in a Bayesian Linear Regression in order to forecast September extent. The model predicts a pan-Arctic extent of 3.96 million square kilometres. Sea ice concentration data were taken from NSIDC (Cavalieri et al., 1996; Maslanik and Stroeve,1999). Sea surface temperature data were from ERA5 reanalysis.


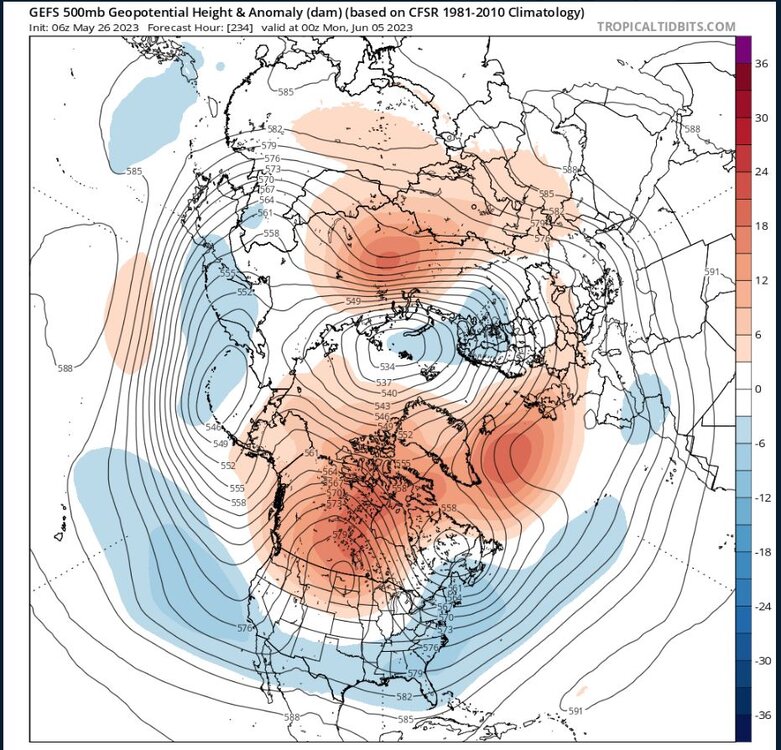
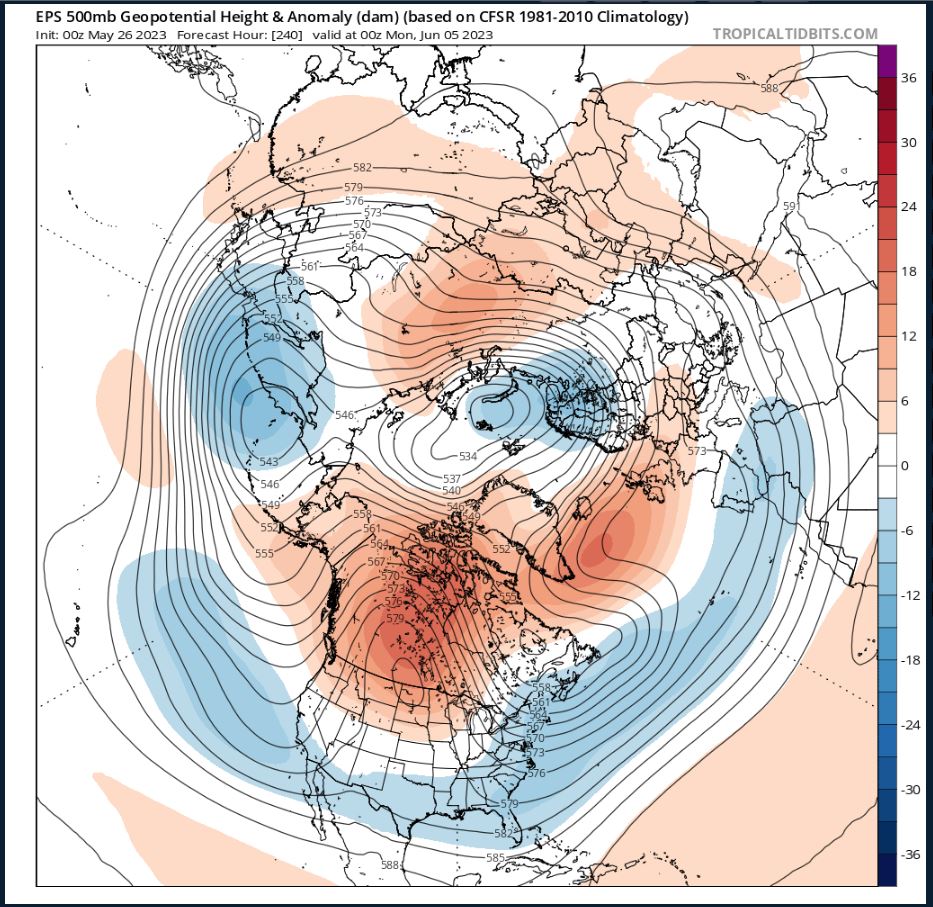
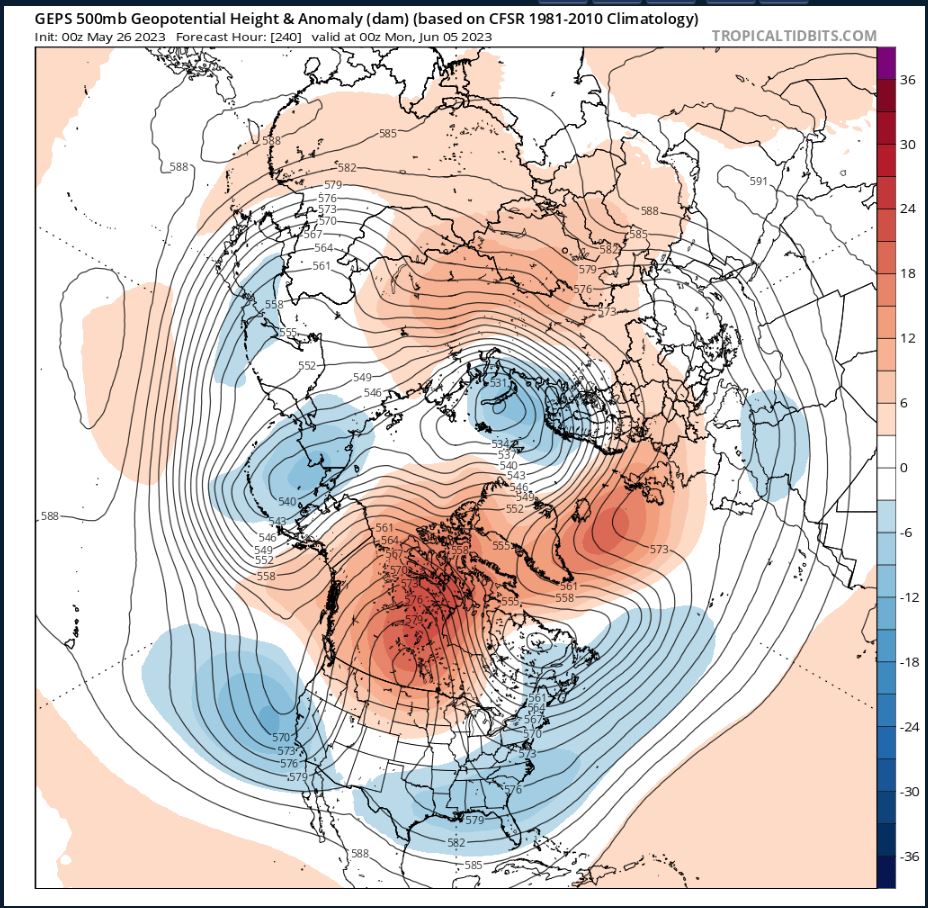
Yes, it's normally quite tough. In this case however, we've got a few "synoptically evident" drivers, two of which are STY Mawar and the location of the Pac jet (STJ). Once that recurves and interacts with the jet and baroclinic zone to the north, it is forecast to induce a large scale wave break via jet enhancement. This is a pretty common occurrence with large/strong recurving typhoons, it's just much earlier in the season than would normally be expected. A strong Bering Sea low and large scale downstream ridging resulting from that RWB is not conducive for the current +AO/annular pattern to maintain its grip. At the very least you would expect some significant disruption for a while.
-
The Canadian province fires experienced so far may just end up being a warm-up if this pattern is to persist as advertised and we may see another smoke-induced aerosol response.
-
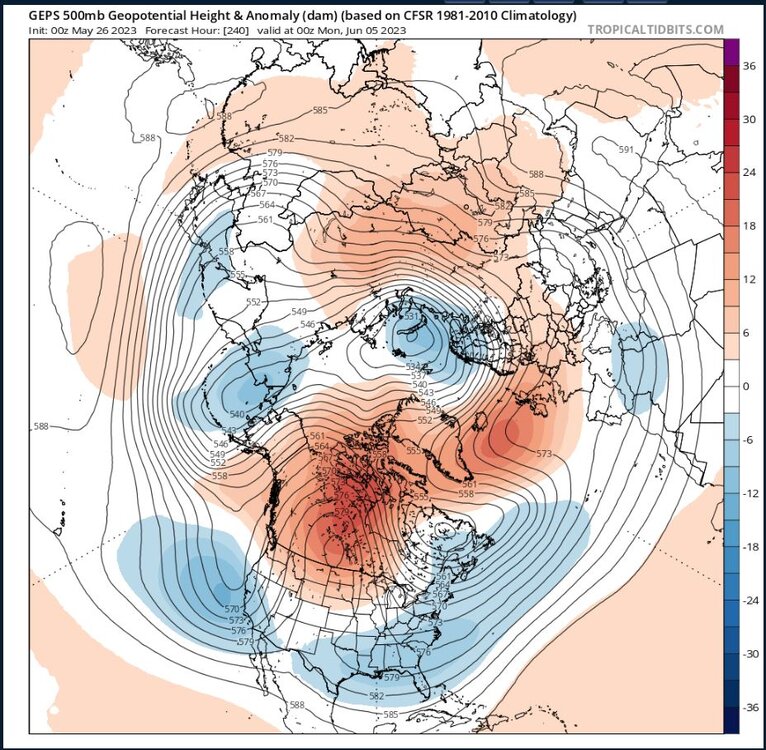
Add in CFS weeklies (wk 2-4) and June monthly to that bin -- which have started aligning strongly with the projected pattern of the others.


-
3 hours ago, bluewave said:
Based on these cooler May temperatures across the Arctic, the melt pond season is probably getting off to a slower start. This is what the melt pond model uses to project a September minimum when the data is released in June by Will Gregory CPOM. So this could mean that the 2012 record will be safe for another year. It’s the opposite of the May record warmth which lead to the big melt year in 2020.
So far, so good and a cursory examination of MODIS reveals most of the ponding is in the CAA so far this year with some small early melt in the Beaufort. An annular upper level pattern (+AO) has been generally protective of the basin proper. However, possible +AD lurking dead ahead with a split stream pattern (enhanced ST jet well separated from a weakened polar jet) and that favors lower heights/cooler temps in the mid-lats/subtropics and enhanced blocking in the upper mid-lats to high latitudes:

-
Yep, read that one! Helluva interesting paper.
-
1
-
-
29 minutes ago, bluewave said:
The record IOD didn’t help El Niño development much in 19-20 like it did in 94-95 and 97-98. The very weak Modoki that winter got overpowered by other factors.
https://www.climate.gov/news-features/blogs/enso/meet-enso’s-neighbor-indian-ocean-dipole
Typically, the strength of the IOD is monitored with the so-called Dipole Mode Index, which is a measure of the surface temperature difference between the western and eastern tropical Indian Ocean. The monthly Dipole Mode Index time series reveals other extreme positive phase IOD events, like in 1994 and 1997, but 2019 brought the most extreme event over past 40 years, at least according to this particular index. This event reached its peak in October and November before rapidly weakening in December—a rather typical seasonal evolution for an IOD event. According to the Australian Bureau of Meteorology, which regularly monitors the IOD, the current Dipole Mode Index is near zero (3), indicating that the IOD has returned to neutral conditions.


Yeah, and the strong pos IOD collapsing like that in boreal autumn is a coherent signal for Nina development the following year.
-
3
-
-
There were plenty of reasons to be bearish on a forecasted Nino in '18. No IOD help, lack of recharge time, lack of WWV, etc, etc.
-
1
-
-
The PDO signature erosion is overwhelmingly due to the insane ridging over the NW Conus and far W Canada over the past few weeks. More of that likely on the way, however that may not impact the southern half of the signature much at all. Looks relatively cool in the subtropical belt for a while yet, especially if blocking stays anchored well north (as currently forecast).
-
1
-
-
1 hour ago, bluewave said:
The WPAC warm pool must be counteracting the normal El Niño WWB response east of the dateline and stalling the ENSO warming. Notice how the westerlies haven’t been able to get past 150W. The equatorial region seems to be the only area not experiencing an El Niño-like pattern. But it’s not uncommon to get high AAM states even during La Niña winters in recent years through the MJO and mountain torques. The next trade wind surge in early June should put that POAMA run even further out of reach.


We'll have to see on that tradewind surge. OP GFS kind of an outlier atm when compared to its own ensembles, EC, EPS, GEM, GEPS.
-
1
-
-
16 hours ago, jconsor said:
Hi, thanks for the constructive feedback/criticism. I agree my Twitter thread was not well-worded. A better explanation would have been that the extensive subsurface warmth slowly shifting from the dateline area into the central Pacific eroded the cool pool in the E. Pacific and led to surface warming during the fall and winter (see attached SST cross-sections from Oct and Dec '22 and Feb '23), which in turn likely favored a more +AAM state in the atmosphere.
FYI, there is some evidence from recent research that upwelling of cold pools below the surface can influence the strength and location of the Walker Circulation, which has a significant influence on the atmospheric pattern across Asia and N. America. It is not hard to envision that upwelling anomalously warm subsurface water could have similar impacts.
See https://iopscience.iop.org/article/10.1088/1748-9326/ab7d5e/pdf
and https://agupubs.onlinelibrary.wiley.com/doi/full/10.1029/2018GL079494

Thanks for the response! That makes better sense.
To piggyback on this -- there was a collapse of -IOD conditions starting right around the same time:
Peak was in Oct:
2021     0.051     0.243     0.266     0.250     0.009    -0.002    -0.228    -0.099    -0.058    -0.091     0.069    -0.120
2022    -0.056    -0.083    -0.093    -0.068    -0.122    -0.335    -0.195    -0.246    -0.322    -0.691    -0.269    -0.092
2023     0.109     0.157
Final collapse of -IOD in the form of strong IO WWBs took place from Dec to Jan. Most of the mechanisms in this paper we're already familiar with, but it makes the case that a IOD + WWV (warm water volume) has significant predictive value and gives a mechanism of action: https://archimer.ifremer.fr/doc/00002/11304/7831.pdf -- In other words, you can, with actually decent skill scores, pick out the likely emergence of a Nino well before the predictability barrier, in some cases as soon as Sept of the previous year! In this case, it was more like late Oct or November.
The lack of any -IOD conditions (much less a sharp peak and cessation) from '17-'21 would've also strongly pointed away from the development of any significant Nino episode.
It seems to me we're seeing that mechanism in action and it would go a long way to helping explain some of why we didn't need a classic WPac WWB to kick off the event. Certainly didn't hurt that we had 3 years of Nina conditions in the lead-up.
-
1
-
-
1 hour ago, FPizz said:
@jconsor is the one who wrote those tweets, same guy
Thanks, didn't notice. Will edit post to reflect that!
-
14 hours ago, jconsor said:
Thread delving into the outsized influence of the subsurface warm pool this late fall-winter, well before water temps at the surface began warming in the eastern equatorial Pacific.
Perhaps it's poorly worded or perhaps I'm misunderstanding here, but I disagree on one part -- this comes off as classic over-detection of correlation = causation. You set up and fail to show how the causation works as far as a transmission mechanism is concerned from the *subsurface* to the atmosphere (and specifically not SSTs, for some odd reason) which, by default, are not in contact with one another. This literally makes no physical sense. Should have left it at the AAM pattern.
Maybe you meant SST trends leading to a +AAM tendency? Struggling with this one.
-
3
-
-
Yeah, seems overly bullish even if the MDR is warmer. Seems like a season where storms would do better in the subtropics or perhaps the Gulf.
-
1
-
-
This paper set to win again: https://www.nature.com/articles/ngeo760
-
1
-
-
2 hours ago, bluewave said:
Do you have the subsurface charts for this week during other developing El Niño years? I know the subsurface is well behind the some of strongest El Niño years at this point. The 180-100 west reading is around +1 this month. 2015 was +1.74 and 1997 was +2.17.
https://www.cpc.ncep.noaa.gov/products/analysis_monitoring/ocean/index/heat_content_index.txt

Of course it is -- warm pool is still largely in the WPac whereas the sample you're comparing to it had already migrated. Sample size issues gonna play havoc here. Most important development in the ST will be the consistent (or lack of) WWBs in the WPac and sustaining trade weakness in the EPac.
If it wasn't already obvious, the evolution has been different from just about every other ENSO event in the modern era (post-'80), right down to the initiation being an IO WWB (Jan)+EPac WWB (Mar), record strong MJO episode and 3 years of pre-conditioning via a triple-dip Nina.
-
1
-
-
2 hours ago, bigtenfan said:
Did the fact that was worst at the airport itself have anything to do with heat generated from all of the jet engines?
Probably coincidence. The amount of heat generated by condensation from ocean fluxes dwarfs anything we can generally produce *directly* (and flights would've been shut down, anyways). Exception is generally from retained solar heat in buildings/concrete, etc -- but wasn't much solar heating going on before that.
-
2
-
-
On 4/17/2023 at 10:48 PM, GaWx said:
More on this huge Ft Lauderdale rain:
- Records go back to 1913.
- 25.91", which fell mainly within just a 12 hour period, far exceeds the greatest there on record in one calendar day. The old record was 14.59" on 4/25/1979 from a weak low in the NE GOM.
Here are prior 10"+ 2 calendar day rains:
- 16.74" 10/19-20/1924 from hurricane moving NE from NW Caribb.
- 15.79" 4/24-5/1979 from weak NE GOM low
- 13.72" 6/2-3/1930 with no tropical system anywhere nearby
- 13.10" 10/11-12/1947 from hurricane moving NE from NW Caribb.
- 12.25" 10/31-11/1/1969 near stationary front
- 11.00" 10/4-5/1948 from hurricane moving NE from NW Caribb.
- 10.89" 5/27-28/2003 (nothing tropical).
- 10.75" 3/14-15/1919 (nothing tropical).
- 10.68" 11/19-20/1973 (nothing tropical).
- 10.14" 6/7-8/1999 (nothing tropical).
The THREE day record is "only" 18.24" set 10/19-21/1924 per this:https://www.newsweek.com/fort-lauderdale-third-annual-rainfall-only-7-hours-1794169?amp=1
Interestingly, no 10"+ event has occurred from a tropical cyclone since way back in 1948! If someone had told me before I did this research that it had been 75 years since the last from a TC, I would have wondered if that was accurate.
Is there any clearcut evidence that GW was a major factor? No clearcut evidence imho. Why?
- It occurred with dewpoints in the low 70s and offshore SSTs no higher than the low 80s. Yes, those are above average for mid April. However, SSTs get into the mid to upper 80s and dewpoints into the upper 70s every summer and yet nothing even close to this heavy an event has occurred most years in S FL summers.
- Look at the decades for the listed 11 heaviest Ft Lauderdale events since 1913:
1910s, 1920s, 1930s, 1940s (2), 1960s, 1970s (2), 1990s, 2000s, 2020s
This looks like a pretty even distribution. If these records had been heavily influenced by the 3 or so degree F warmer globe, I would have expected a heavier concentration since the 1980s (and especially in summer/early fall). Yet, there have been only 3 of 11 since then.
Good stats listed here, but I would debate this portion and some of the interpretation. I'll agree it's complex and difficult to tease out. However -- you're generally not going to get environments favorable for supercells in S FL in summer and fall, esp for the kind we saw with long duration. This strikes me as a combination of mid-spring setup overlapping with higher SSTs than should have been available. 1-2C warmer than normal temps/dews temps into a skinny CAPE-high shear profile will absolutely make a difference in both updraft maintenance and precip output, esp if warm cloud layer is deep enough. A few degrees cooler at the surface and in the inflow layer and I'm not even sure you get an event anywhere near this magnitude -- probably several inches less. But in a marginal situation like this? The persistent maintenance of a mesocyclone alone could've contributed up to 50% of the updraft speed.
Obvs. it falling over a metro area and the expanding bullseye effect have some blame here too.
-
2
-


6/29-7/1 Severe Weather Threat
in Lakes/Ohio Valley
Posted
That rear inflow jet -- sheesh. Looks to be outrunning the reservoir of readily available instability though. Only the southern fringe is likely to survive into the evening hours.
Given the strength of the RIJ, cold pool and advection aloft, might see some induced isentropic lift atop the "dome" and get some additional elevated thunderstorm activity to fire in its wake.