

csnavywx
-
Posts
5,543 -
Joined
-
Last visited
Content Type
Profiles
Blogs
Forums
American Weather
Media Demo
Store
Gallery
Posts posted by csnavywx
-
-
Just about over. 2" of new snow from the backside.
-
 1
1
-
-
Extra inch so far from the backside.
-
1
-
-
1 minute ago, SnowtoRain said:
Dumping snow, probably up to 9" now
I think you to Sussex Cty., DE are going to be the jackpot area. Prob get close to a foot up there. More like 8" from here to Salisbury after the backside tonight.
-
1
-
-
49 minutes ago, csnavywx said:
Flipped to sleet about 45m ago. Now over to a rare sleet/snow/freezing rain mix.
Flipped back to all snow 20m after this. Piling up quick on this last push.
-
14 minutes ago, Lowershoresadness said:
is this thing over performing or doing what was expected?
About as expected. Is nice to see some fight on the transition line though. 30% sleet and 70% enormous aggregates of snow. Absolutely dumping.
-
2
-
-
Flipped to sleet about 45m ago. Now over to a rare sleet/snow/freezing rain mix.
-
Getting some quarters and half dollars under these enhanced echoes. Made of basically pure dendrites.
-
6
-
-
Heavy snow arriving under the main band. Lots of smaller dendrites with enormous chonkers mixed in -- some quarters and half-dollar aggregates made of almost pure dendrites. Very efficient snowmaking going on. Piling up fast now.
-
3
-
-
Up to about 1/2" down here. Light to borderline moderate snow.
-
1
-
-
5 minutes ago, pazzo83 said:
isn't that really an artifact of the radar and the dry air though?
Yes. It's the radar beam hitting the precip further up as the beam travels up and away from the point of origin.
Precip started down here when the ceiling got down to ~3k ft. Ceilometers are useful right now!
-
1
-
-
Light snow commenced here at 11:15pm. Started as tiny flakes with small aggregates mixed in. Quickly picked up in intensity and is now approaching moderate. Good coating already.
-
8
-
-
Light snow commenced here at 11:15p.
Tiny flakes with a few partially evaporated small aggregates mixed in.
-
2
-
-
5 hours ago, Lowershoresadness said:
Yea, CSN will fill us in. I'm wondering how much ice/sleet I will see. That could cripple the bury
High chance there's some mixing as we get towards mid-morning. Saving grace is if we somehow get a decent E-W mesoscale band to set up around the mixing line and feed off the melting-induced gradient. Thinking 5-7" for you and me.
-
1
-
 1
1
-
-
2 minutes ago, AlexD1990 said:
Thank you! You're feeling like the Salisbury area is the jackpot?
I think they prob. mix with sleet a bit too much/early to be the jackpot area. Unless some wild mesoscale melt-enhanced band can set up.
-
1
-
-
7 minutes ago, AlexD1990 said:
Cs, apologies for the IMBY question, but would you be willing to post a estimate for Sussex County/midshore Delmarva? Always love hearing your thoughts, and am curious how much the mixing will affect us.
Prob not as much as just further south. I'd have to break out the soundings but my first guess there would be 6-8" with sleet mixing in around 10am-noon tomorrow.
-
1
-
-
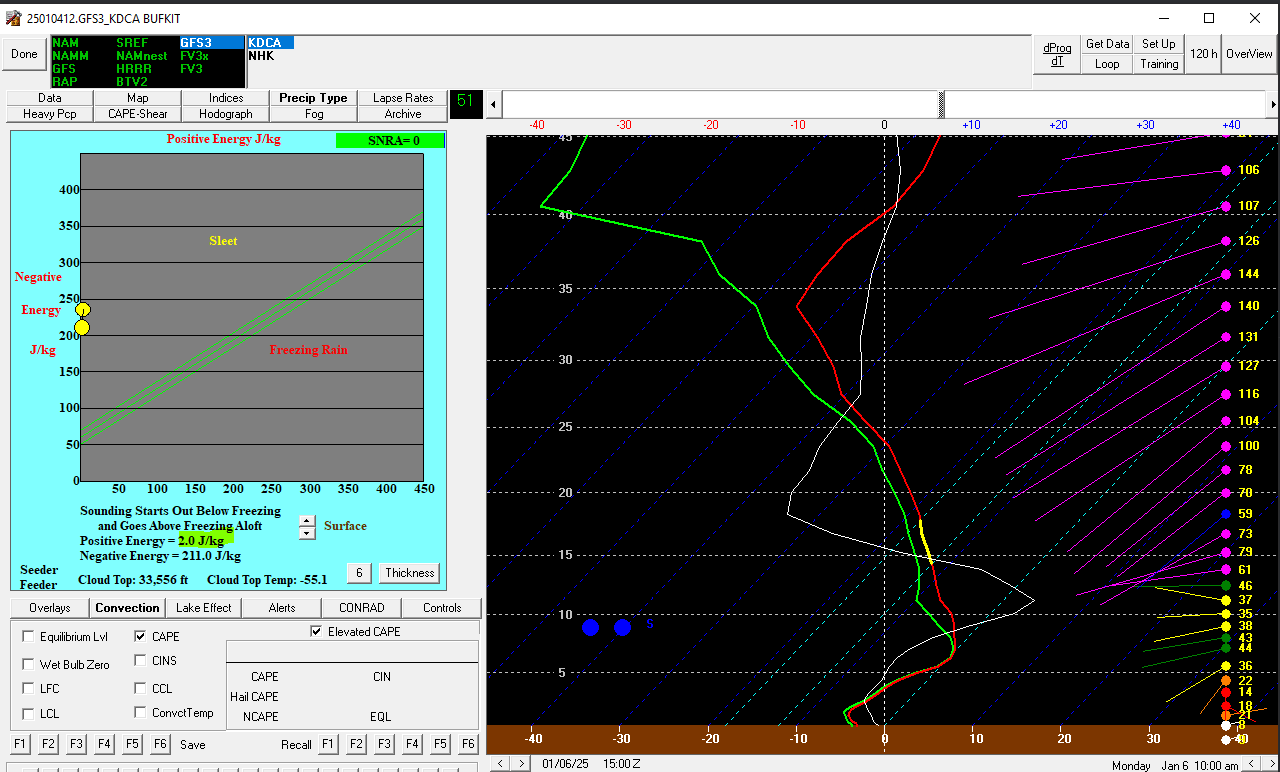
Gonna do some BUFKIT profiles and post em here this evening as we progress.
-
1
-
-
We always have issues with mixing in WAA/WCB setups and I don't expect this time to be different.
The two things we have going for us is that the precip arrives before the surface high/ridge even leaves, so that cold air won't get shoved out immediately. The second is that the wave has a nice flat track so the WCB will be more elevated in the column initially. This gives us a couple of chances to cash in on decent accumulations before thermals become prohibitive. Once with the initial shove of elevated WAA (around 700mb) this evening and then initially with surge of moisture and warm advection in the main WCB early in the morning. I've been watching upstream stations and the transition zone has been fairly narrow, so the southern cutoff with decent snow accumulations to an overabundance of sleet is going to be pretty sharp. Easton may do fairly well here while places like here in Lexington Park to Salisbury mix significantly with sleet.
This is also a scenario where dynamics around melting can enhance an east-west band for a few hours.
Regardless of the WAA driven stuff, I do expect the favorable track of the 500/700mb vort will provide an inch or two of snow on the backside to those of us who get skunked by a sleet-fest.
-
1
-
-
13 minutes ago, WxUSAF said:
Don’t read a ton into it, but KC has had tons of FZRA. Seems like 12z euro had them straddling snow/fzra line now. 3k NAM had sleet. GFS had snow/sleet.
I think in this particular case -- it's less to do with the thermal profile and more to do with the fact that it's unsaturated below -10C in the cloud layer. Lack of ice crystals preventing any sort of nucleation.
-
5
-
3
-
-
1 minute ago, Eskimo Joe said:
12z UKMET has a closed vortex over the St. Lawrence Valley, the GFS does not. That appears to be a key difference at 500mb.
It's also open at H5 vs. GFS which keeps it closed for a while longer. Makes a difference to the WCB.
-
4
-
-
1 hour ago, stormtracker said:
WB has it as sleet or something according to Will's map. You have the sounding? Sometimes WB paints sleet in snow/close snow situations
ETA: Nevermind. Saw you edited and said you checked the sounding
Needs to be >10 J/kg or the hydrometeors won't melt. Verbatim it's still snow.
The real issue is the dry slot impinging aloft around this time, which starts removing most of the ice crystals. Snow growth gets inefficient or flips to snow grains and/or freezing drizzle until around 5pm, when the IC layer is restored as the main vort maxes passes south.

-
7
-
-
Really comes down to who is handling the H5/H7 features better here. GFS opens the upper low later than the EC and as a result has a more coherent WCB and warm nose, which ends up causing p-type issues but makes up for it somewhat with a stronger backside as the H5/7 vort maxes slide just south. The tracks and timing are otherwise basically the same. Either way, there should be some banding along/just left of the mid-level vort maxes.
-
7
-
2
-
-
On 12/31/2024 at 3:16 PM, csnavywx said:
Wouldn't sleep on this one. Nice trop fold, very weakly stable to moist neutral atmosphere as it moves in, strong digging mid-level (500mb) jet streak, and a favorable position of mid/upper features. Lack of decent low-level/surface reflection and a relatively dry boundary layer due to weak return flow are cons.
I love these little systems. They tend to outperform. Quite a few lightning strikes now showing up on my display (14 in last 10m or so).
-
4
-
-
40 minutes ago, osfan24 said:
Aren't temperatures going to be quite warm when the squalls go through? I mean, maybe some of the favored northern areas are stuck in the mid 30's and it will snow hard enough to overcome the temp and stick to the roads, but my temp is forecasted to be in the upper 30's tomorrow afternoon. It would have to snow ridiculously hard for awhile to have any chance of sticking in those temps.
Temps ahead of the trough/front will be pretty mild (u30-l40s), but given the very cold temps aloft and the borderline convective setup right along the boundary, I would expect temps to drop pretty quickly as precip arrives. Convective overturning is in play here.
-
5
-
1
-
-
1/2" hail and plenty of lightning. Gusts to around 40mph. Very solid mid-winter thunderstorm. Probably the strongest cold season storm I've gotten since I've lived here.
-
3
-
Southern MD / Lower Eastern Shore weather discussion
in Mid Atlantic
Posted
Liking the flattish track of the next system. Looks like a classic southern slider. Some room for incremental improvement with slightly better phasing, but this one is unlikely to curve up the coast and cause a bunch of mixing issues. Shared energy area on the front side of the trough between the subtropical and polar jets should keep it from doing so. "Positive going neutral" tilt trough works just fine for us.