

csnavywx
-
Posts
5,702 -
Joined
-
Last visited
Content Type
Profiles
Blogs
Forums
American Weather
Media Demo
Store
Gallery
Posts posted by csnavywx
-
-
6 hours ago, PhiEaglesfan712 said:
91-92 would have probably had a big global temperature jump if not for Pinatubo. It was the 3rd robust el nino in 10 years, and coming off the heels of a temperature jump from the 86-88 el nino.
But my guess is that if Pinatubo never happens, 97-98 still has a temperature jump, but not as drastic. 97-98 not only had the super el nino, but the exiting of a cooling period from a major volcano to enhance its temperature jump.
It's a nice theory, but there's reason to believe cooling caused by tropical volcanic eruptions actually help weaken trades over the WPac:
https://www.sciencedaily.com/releases/2017/10/171003111101.htm
So it's debatable whether that Nino even happens in the first place, or if it does, to that degree.
-
Now that we officially moved to RONI, the funniest possible outcome is a Nino that smashes through 2.0 on RONI anyways.
Still early but hard not to like all of the off-center WWBs pumping warm water volume towards the equator. It's got the potential, especially given how early it got started.
-
 1
1
-
-
6 hours ago, csnavywx said:
Filtered sun again and that line missed me to the north. The watch getting canx'd here is almost begging to be punched in the stomach by the front this evening. 300-600 cape into 500-700 helicity should be good enough for a few mini-supers, imo -- so long as we are indeed done with this overturning crap.
Been in these shoes before. Can't turn your back on em til it's truly over -- even if the front half is a flop.
-
 1
1
-
-
5 hours ago, Eskimo Joe said:
Classic Mid Atlantic would be to get an EF-3 tornado or something run through the metros not 3 hours after they cancel the watch.
Lol, lmao even.
SPECI KDCA 170112Z 31037G59KT 5SM -RA BR SQ FEW016 BKN021 OVC037 08/06 A2936 RMK AO2 PK WND 30059/0112 WSHFT 0052 RAB06 PRESRR P0000 T00830056 $
-
Filtered sun again and that line missed me to the north. The watch getting canx'd here is almost begging to be punched in the stomach by the front this evening. 300-600 cape into 500-700 helicity should be good enough for a few mini-supers, imo -- so long as we are indeed done with this overturning crap.
-
2 minutes ago, BTRWx's Thanks Giving said:
Do all these severe thunderstorm warnings merit a bust?
Virtually all of the LSRs are confined up on the Piedmont and mountains to the west/southwest. Makes sense, because that was the only area that got a chance to destabilize a bit before the crapvection-driven overturning got going. Consolation prize is that it's killing the line off completely to the south, so there might be a chance for the cold front this evening to have a bit of something to work with.
-
Just now, Eskimo Joe said:
Setups like this stink in this part of the country. 9.9/10 times they bust, then you get the 0.1 time where things go gang busters with meager sunshine. You do a post mortem on all of the event and they look all the same, yet you wonder why this one time we nuts.

Needs a lot more helicity with this low amount of buoyancy. There's a narrow window this evening before the cold front, but you'd have to stop bombarding the warm sector with this low grade overturning for it to work. This is why capping is so important. You have it or you get this nonsense.
-
1
-
-
Glad I've been downplaying it to all of my customers today. Quite the bust on the way. Hell I might have not downplayed it enough. Sure, there will be some more 50KT reports and a tor or three but I anticipate this probable bust is going to cause some issues later in the season when we do actually get a system with a clean warm sector. And that's pretty likely, imo, given the strong ramp into Nino.
-
5
-
 2
2
-
 1
1
-
 1
1
-
-
Little peeks of sunshine here. But too much crappy low grade convection polluting the warm sector now, especially in the east. Some is okay ofc, because ideally you don't want your LCLs too high, but still need a corridor of at least some halfway decent destabilization ahead of this afternoon's activity.
-
9 minutes ago, WolfStock1 said:
Interesting. Got a link for that? I didn't realize wind and solar prices had been going up like that. You hear about prices going down, though generally it doesn't include the transmission aspect; which is generally much higher because wind and solar are prevalent in areas where people that use the energy *aren't* as prevalent.
As such I've maintained that we're about done picking the solar and wind "low hanging fruit"; this chart appears to show evidence of that.
LevelTen warns of rising PPA prices amid US trade, policy strain – pv magazine International
This is even more up to date. Tariffs are mentioned and I'm sure those aren't helping, but the trend was there prior to that. And it does not include the global run up in almost all base materials over the last 1-2yr. There's a lot more supply that needs to be unlocked, but that requires sustained higher prices. This was mostly dismissed for years as there was "plenty enough global reserves to go around and the market would take care of it". Well the market is going to take care of it alright. By taking it right out of your pocket.
-
1 minute ago, WolfStock1 said:
Presuming that you're talking about nuclear - the problem is that there has always been *too much* talk about the tail risk; i.e. blowing out of proportion.
Yes, too much talk about tail risk of nuclear and a chronic downplay of ECS >4C scenarios up until very very recently.
-
13 hours ago, WolfStock1 said:
It was *never* going to be anywhere close to "cheap" to hedge, at any point. You're fighting not only physics, but politics and human nature. It would require not only taking a huge hit to our prosperity - but convincing all the other countries in the world to take that same hit. Good luck with that. I don't think you understand just *how* much of our prosperity is based on the foundation of fossil fuel use. It's literally been the basis for the industrial revolution. The big inflection point was 150 years ago - not 20 years ago. But if we somehow had managed to avoid that inflection point - we wouldn't have anything close to the prosperity we do today.
We perhaps had a smidgen of a chance decades ago, with the advent of nuclear power. But then the clueless anti-nuke lobby, led by the likes of Ralph Nader, ensured that wasn't going to happen*. Even still that would have only gotten us so far; even with all-nuclear electricity we still would have other fossil fuel uses in transportation and industry to deal with.
(*Edit: In his defense - he didn't know about MMGW back then. He might have a difference stance today if so. Nevertheless - he and others like him were responsible for the extreme over-reactive risk aversion that killed nuclear.)
I mean, you made the point for me here. If we had hedged off w/nuclear (on a scientific, rational basis) we'd be in a much better spot today. But fear won and so did the campaign to offload responsibility onto the individual (e.g. "carbon footprint", "carbon offset" nonsense) and away from capital interests. Label the individual as the "junkie" (Purdue Pharma style, just nicer words) while perpetrating fraud. Sell the fix as cheap and easy and ultimately again, as up to the individual. Ignore the obvious ideological holes. And by god, never ever talk honestly about the tail risk. It was and continues to be a systemic, collective action and thermodynamic problem.
-
RE will continue to get more expensive on a PPA basis so long as we continue to ignore the issues plaguing transmission, distribution and direct competition between industrial scale AI/DC buildout and the insane lack of investment in upstream base materials supply (like spinning up mining and refining). I maintain that negative prices on the spot market are a sign of market failure, not something that should be cheered.
These prices certainly are not going to get better this year:
The correct take is that *all energy* will continue to get more expensive in the world we've built for ourselves now. (Disclosure that I am long ICLN -- because yes, most of these companies will try and expand their margins off the backs of the ratepayer and externalizing the grid cost -- my PNL tells me if I'm right or not, so far, so good.)
-
About a solid inch of paste with this system after a record high print yesterday (84 vs. 80 old record). Nice little last hurrah. Probably had the best rates of the winter for about an hour there.
-
1
-
-
21 hours ago, WolfStock1 said:
Sorry but the FUD approach is just getting tiresome. I think you vastly underestimate both the adaptability of humans and the durability of planet Earth.
People hear what Chicken Littles have been saying for decades - and then they look at the *actual* impacts that are happening - and the two just don't match. E.g. Weather-related deaths continue to decline, mass die-offs of species like polar bears isn't happening, coastal areas aren't becoming inhabitable due to being underwater, the polar regions still have year-round ice, etc.
As a result the general population seems to be souring on the climate change hysteria, realizing that we aren't in fact in an existential crisis, with many even questioning the veracity of the predictions wholesale. Maybe it would behoove to be more pragmatic in the approach - something other than "the world should be very afraid" stance.
We win when we hedge the risk properly. The phenomenon you're describing is literally us discarding that tendency to hedge out the window, right as volatility ramps. Yeah, policy prescription has sucked to this point and the shilling about the "low cost of transition" has turned out to be damaging and wrong (if you have doubts, look at PPA prices and virtually every base metal in the past couple of years) It was always going to be costly (a significant % of GDP). The balking at the cost is understandable and the damage costs *to this point* have been mostly a "freebie" since it's a) mostly indirect, b) have not pushed us outside historical ranges except at/very near the equator, c) non-linear change tends to be slow at first, and d) tech/econ growth rate has been enough to offset. Problem is, if you wait until forward economic growth is meaningfully impacted, much slowing towards zero, then you are already too late.
Hedging 20 years ago would've been much cheaper.
Hedging now is fairly expensive.
Hedging 20 years from now will be extraordinarily expensive.
You hedge when it's cheap, not when you have to. But until we do hedge this risk properly and start really taking it seriously, the doomers will be right. You are literally short selling a temp graph that is accelerating up.
-
1
-
-
Big ol' parachutes coming down here with this little WAA driven event. Enjoying them while they last!
-
1
-
-
15 hours ago, chubbs said:
SST trend so far this year is consistent with a nino spike to record temperatures, with the caveat that it is early in the nino cycle. I took years between 2010 and 2022 off the chart to better isolate 2023 and later at the top of the chart. On the chart, 2023 is the coldest of the 4 recent Jan and Feb, red is this year and orange 2025.
So far this year SST are tracking 2023, but roughly 0.15C higher. The recent spike in SST has brought 2026 above 2025, approaching record SST in 2024. 2023 moved into record SST territory in mid-March. This year is on a similar pace.
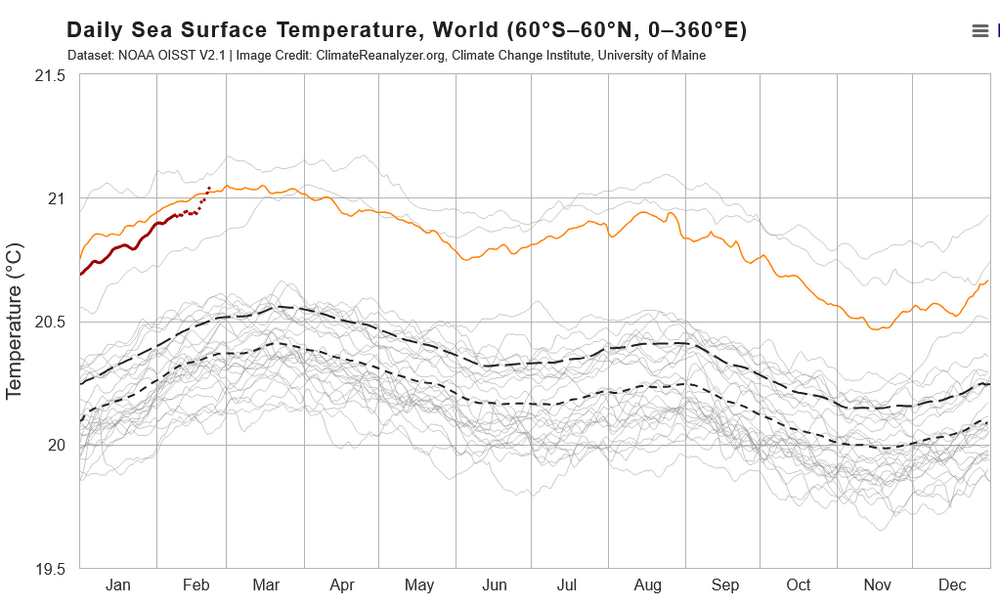
Copernicus Marine showed a 76 (!) ZJ jump in OHC in '25. It's a much more volatile data series than the others, but even the smoothed IAP, etc showed ~24ZJ. Just for reference, if you plug 76 ZJ into the top 400m of the global ocean, you get +0.13C. That's oversimplified ofc, but gives you an idea of just how much heat we're dumping into the ocean. IAP's ~24ZJ gives you 0.14C if isolated to the mixing layer +1 y of extension via diffusion. And the implied EEI from that is about +1.5 W/m2. So these temp increases we're seeing at least seem plausible.
We'd better hope these rates slow down, because we're talking pretty extreme rates of ocean surface warming which ofc will translate to even higher land surface temp rates. The fact that we can print a 1.44 W/m2 figure at these already very high temps is giving me some serious pause.
-
1
-
-
CERES monthlies have rebounded strongly this year. Much higher than I would have expected. Matches the notable leap in OHC figures. I was thinking this year's potential Nino would have a lesser impact on temperatures, but I am not as sure now:
(from Leon Simons on X)
-
2
-
-
Back to snow grains/pellets. Having issues keeping the snow growth zone saturated it seems.
-
Just now, Lowershoresadness said:
not seeing much wind yet
Prob won't see much til about 6pm. Low is still >1000mb. Dropping fast now, but wind lags the increase in pressure gradient force.
-
5
-
-
Getting some snow grains mixing in here. Usually means cloud tops are not quite cold enough. Needs more time.
-
7 minutes ago, SnowtoRain said:
32.5 now, not sure if any model had this, not sure if that means everything is moving quicker or intensity is greater
Better diabatic cooling from getting decent precip early on and strong low-to-mid level lift doing its job. Winds flipping north earlier than forecast didn't hurt either.
-
1
-
-
All snow here. About 3 hours ahead of schedule. Usually a decent sign.
-
8
-
-
12 minutes ago, Lowershoresadness said:
what are we looking at overnight?
For you, should be cranking into the overnight. Will be occasional breaks/lulls as the precip starts taking on a more convective nature and you do lose some saturation in the DGZ as the low pulls in super close to shore -- but there could be a few rumbles of thunder later this afternoon and evening too.
-
3
-
 2
2
-


2026-2027 Strong/Super El Nino
in Weather Forecasting and Discussion
Posted
Given how the following month went in pumping all of that WWV eastward and the sheer amount of momentum transfer into the thermocline, I will make the following statement:
Never short sell synoptically obvious events.