ORH_wxman
-
Posts
91,688 -
Joined
-
Last visited
Content Type
Profiles
Blogs
Forums
American Weather
Media Demo
Store
Gallery
Everything posted by ORH_wxman
-
Good chance for lingering light snow since the shortwave is stretched/sheared out at the end…sort of forces an IVT to hang back and keep light snow falling. Don’t think additional accums would be big but like an inch or two from late afternoon through evening wouldn’t be surprising in that type of setup.
-
Hopefully it’s out to lunch vs other guidance. That’s a huge difference. Some guidance gives warning criteria snow for just about all of CNE/NNE (and even close in parts of SNE) while Euro is not much at all and prolonged mild rains.
-
This current 1/7 storm def is more of an El Niño flavor…I was more referring to the pattern that follows. Very La Niña as we start building SE ridge and western trough. Hopefully blocking is good enough to keep us on the cold side most of the time. That said, Euro doesn’t want to cooperate much with the 1:10 threat. Not nearly as CADish and cold as the other 12z guidance. We’ll see what EPS says in a bit.
-
Track wasn’t too dissimilar (maybe a hair S) but it was not a dynamic as the Ukie solution. Still a solid storm but a Euro type solution is more of like a 5-10” storm for SNE (maybe a higher lolli) rather than 8-12/10-15 or something like that which some of the other guidance has.
-
Shortwave doesn’t really have much integrity to it like other guidance which I why the whole thing is weaker than other guidance.
-
North of 00z but still on the southern envelope of 12z guidance.
-
Not sure I’ve ever seen an arctic high “fill with tropical maritime air”….interesting physics and thermodynamics there. Might be a new discovery.
-
Confluence is good…just as long as you aren’t so close to it that it screws you. Confluence is what helps create awesome fronto bands.
-
Versus your old ‘hood in Woodstock? Yeah it will taint quicker near Ginxy but not by much. He’s in a decent spot far enough off the water for major concerns. I’d think that area would need a true hugger track (like basically over the forks of LI) to have major ptype issues. Im assuming you’re near Moosup/Sterling? I’m on mobile so I can’t see locations in posts right now.
-
Actually a really nice look for Boston on Ukie. Crush job over eastern areas. Most of SNE does well but nice enhancement east.
-
Looks like Ukie is going to be a bit tamer than 00z but that isn’t a shock since 00z was super amped tainting most of SNE.
-
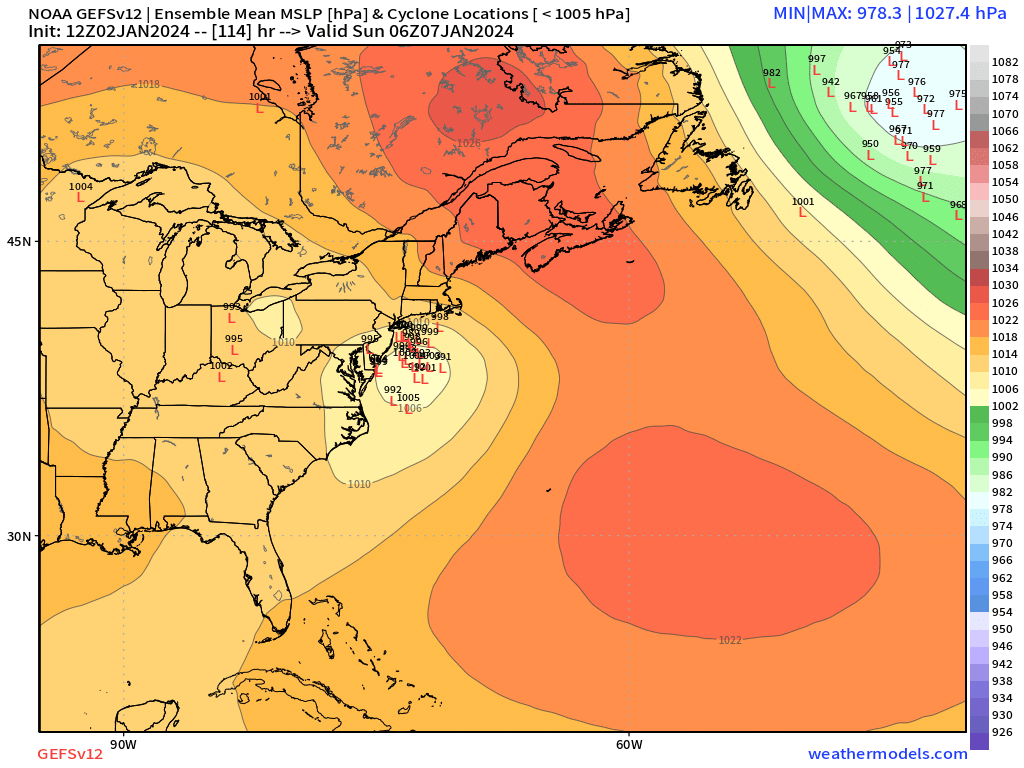
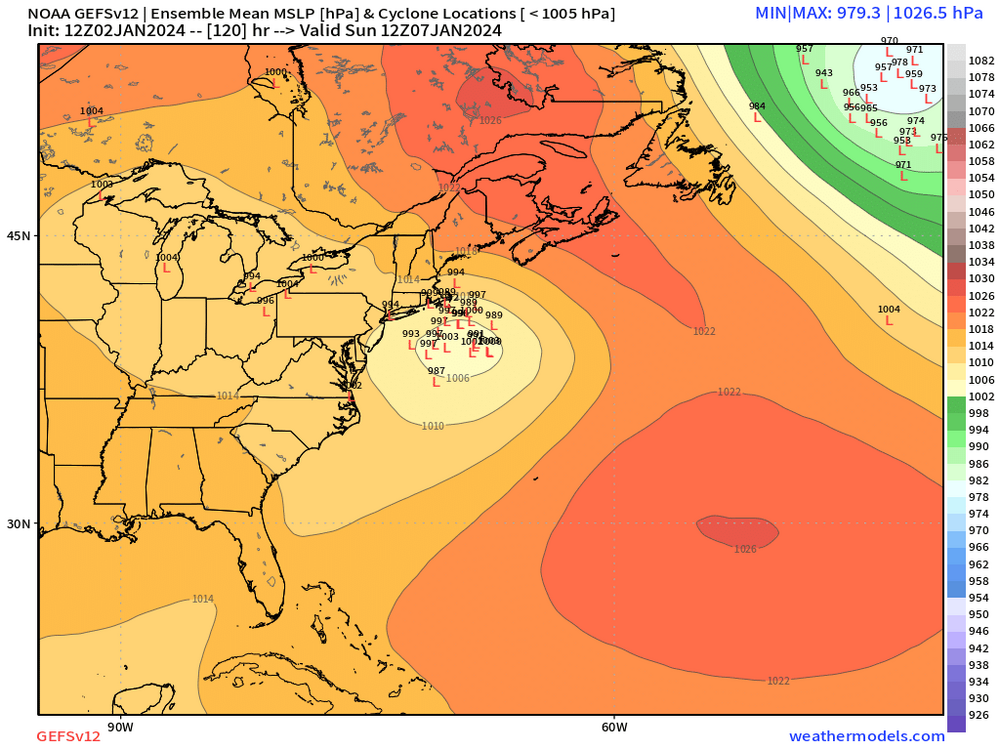
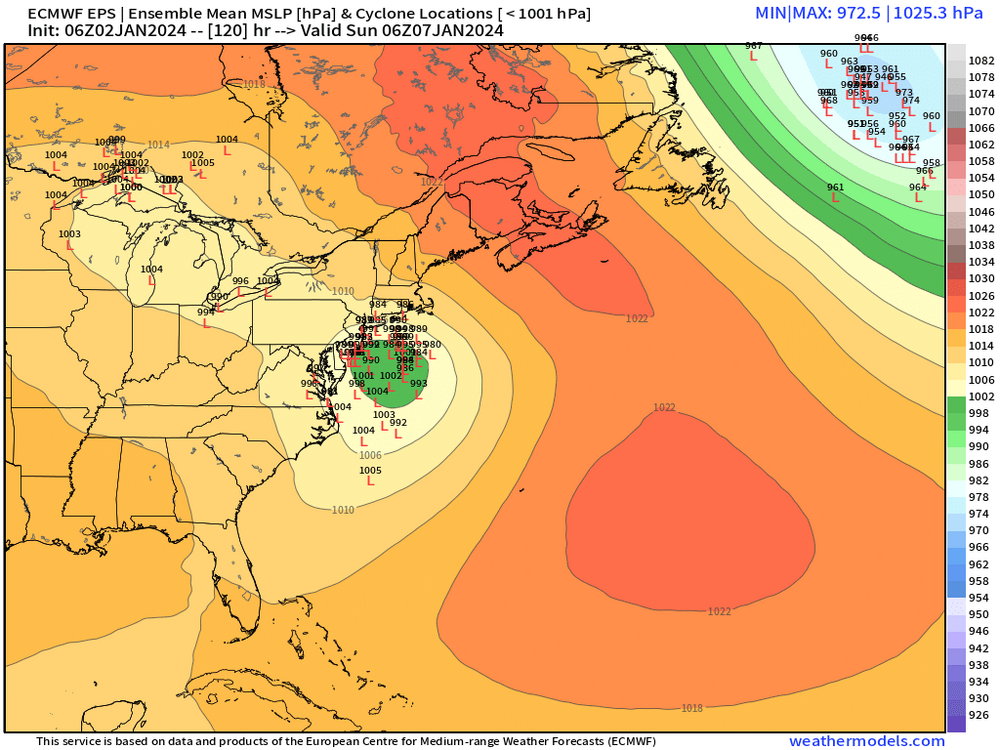
Pretty tight cluster on northern edge but none of them get inland. EPS had a couple onshore in CT but most of them stayed S of LI and all of them do on the GEFS save maybe one right near it. There is a northern extent to this because of the trough out west and the confluence up north. Here 12z GEFS.

-
La Niña pattern. Looks like 07-08 or 08-09 on some of these progs with that gradient.
-
GGEM went way colder and more CAD as well for 1/10. Doesn’t even taint once you get up to dendrite. Maybe a sneaky warm layer for a brief time.
-
Coast and SE areas don’t want that low gaining too much latitude before it slides ENE due to onshore flow. Gotta keep it a bit south. That’s actually true for everyone but interior has a lot more wiggle room for how close the sfc low gets.
-
GGEM similar tho maybe a little south of GFS. These tracks are very similar to that EPS cluster that were NW of the mean…basically going over ACK.
-
I feel mildly optimistic that 1/10 is going to be totally fine for NNE. Might be some ptype mixing but I think there’s going to be a LOT of frozen precip there. Things could change for the worse but there’s been some ensemble support for a colder profile (front end thump to triple point type evolution)…so we’ll see.
-
That was just about perfect for maximizing the snow coverage across SNE. Prob some ML goodies getting up to the chickens over to PWM too.
-
I actually took the snowblower out of my shed yesterday because I needed to make sure it was working after leaving it in there all of last winter. There was a chipmunk nest in it but thankfully they didn’t chew any wires off so everything seemed to work. Gonna have to rodent-proof it before storing it again. If the storm and subsequent pattern afterward shit the bed, you can all blame it on me.
-
The syzygy storm. I think that’s the one where Tip posted he watched the the ridiculous surf and tide on Cape Anne. That was mostly paste near 495 too.
-
It was really thick frost here too. Wonder if the excess moisture in the ground helped with that. Almost looked like it snowed a dusting when I went out but it was pure frost. Usually don’t get that on the hill here…we get frost but it’s normally lighter and the heavy frost is reserved for the lower spots down near the bottom. But today it was thick everywhere.
-
Lot of snow and cold…no real torches or true cutters (has the 1/10 system as a pretty good front ender with a triple point low limiting the low level warming duration)…plenty of threats into mid-month too. The mid-month pattern is kind of high risk high reward. There’s some western troughing which could risk a cutter but it’s also very active so if we avoid the cutters, prob a good amount of snow can result.
-
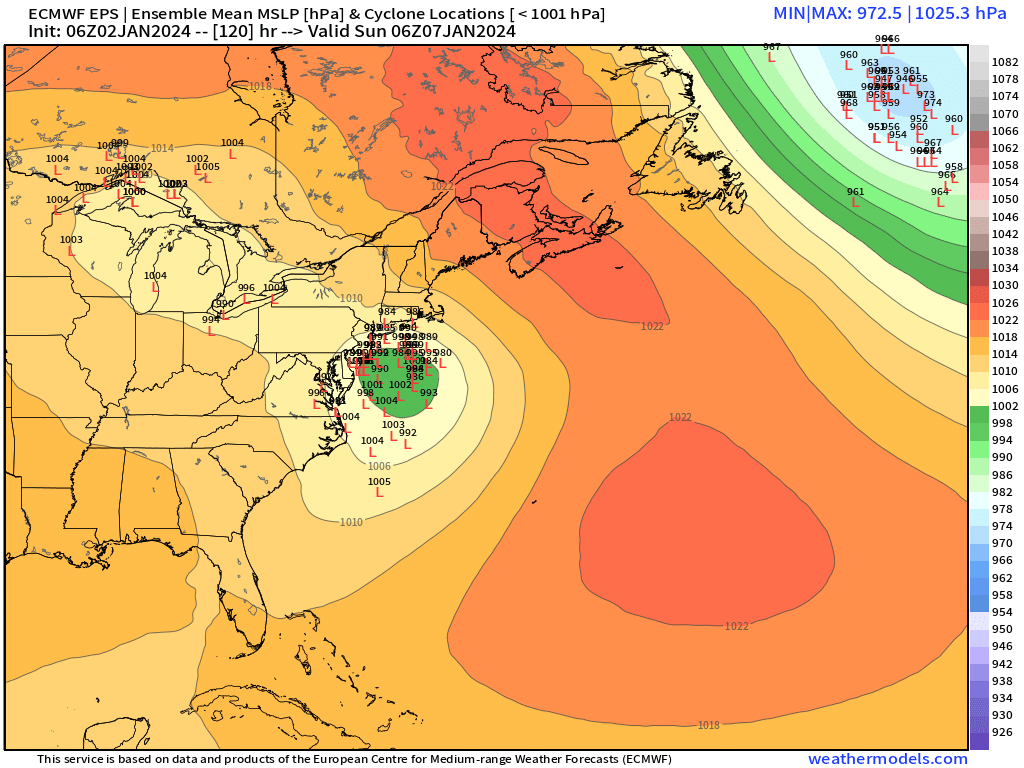
EPS individual ensemble members still have a large cluster that is a closer track

-
Agreed. Those subtle difference is why I’d keep expectations in the moderate range even if we get an ideal track. I do think there will be some double digit totals wherever the CCB meat sets up but as of now, I don’t think those will extend to outside those bands. But we’ll see. Sometimes these southern steamers like to juice up in the final few days.
-
What a weenie run on 06z GFS. That’s how to run the upcoming pattern.