ORH_wxman
-
Posts
93,092 -
Joined
-
Last visited
Content Type
Profiles
Blogs
Forums
American Weather
Media Demo
Store
Gallery
Everything posted by ORH_wxman
-
I thought we'd get a legit threat in the second half of the month, but guidance really was kind of clueless on the pattern. Kept flip flopping. IT was actually kind of a disaster on model guidance really since we got to February....we had so many fake torches get canned on guidance during February and then the reload in March basically turned into this half baked semi-chilly pseudo-zonal pattern with flat/truncated ridges out west interrupted by deep troughs to mix in a cutter or two. .
-
Always love seeing BN heights in New Foundland and Labrador in late March and April with the ridge axis 800 miles west of us.
-
That's almost certainly what happened. In ORH, they were able to get some measurements from the airport for a while despite no official observer, but then that stopped eventually and they started using an observer near the airport. This process happened faster at BDL. You see so many instances of no report at BDL airport but then you get "East Granby" and I also remember a few times seeing them identical when they happened to put both in the report. It's like when BOS had the Winthrop coop doing the Logan measurements for a while...you'd see something like "0.6 W Winthrop" and Logan airport would have identical totals to the nearest tenth.
-
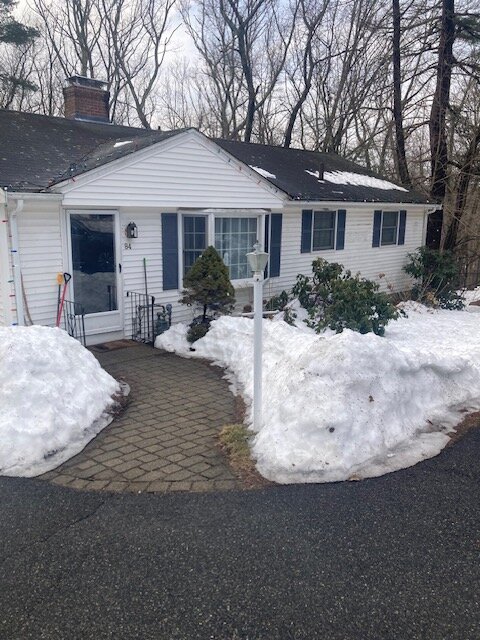
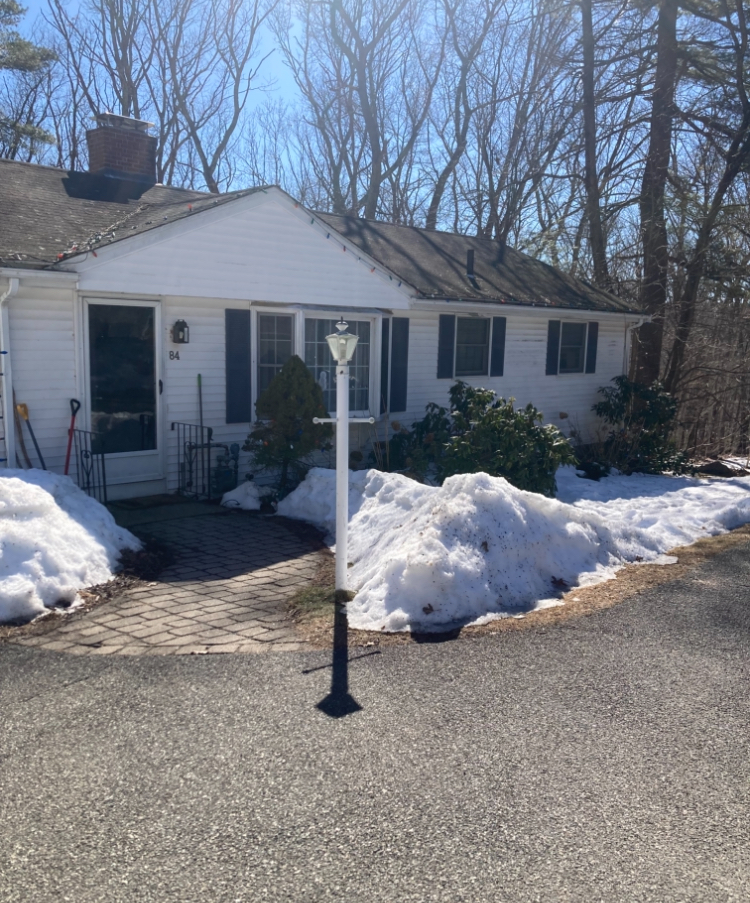
It could depend on your yard too this time of year. There’s a house at the bottom of our hill that has full pack right now on almost all sides except one. It’s deep too. At least 6-8”. Almost everyone else is bare ground with just piles. It’s tucked into the hillside just a bit so it prob catches all the cold dense drainage and maybe a little extra shade…but I think the former is the better explanation. Plenty of other shaded areas have less or just patches.
-
More water in the snow at Ray’s?
-
The old East Granby reports are definitely BDL. At least most of them are I’d think of not all of them. There wasn’t an active coop there either.
-
It’s so nice out….but it’s mostly useless this time of year since we still have snow pack or soggy ground where wet it just recently melted. You can’t do shit except walk in the street, lol. Oh well, back to dogshit tomorrow. Too bad next week couldn’t pan out. Cutter, cold, cutter, cold.
-
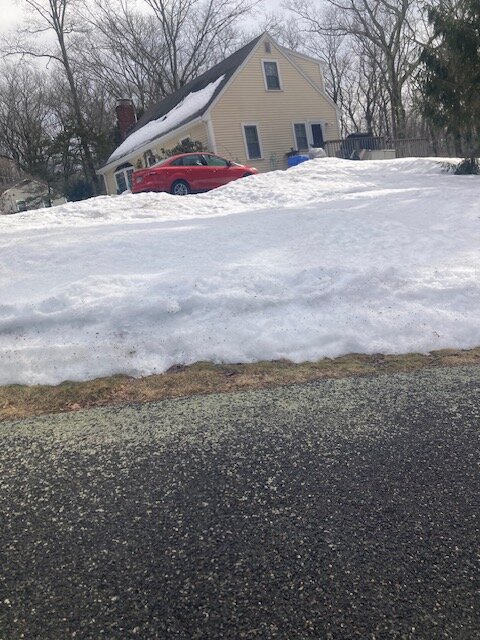
Edges retreating quickly.


-
We’re down to about 10-11” here but the south facing sloped areas are now largely exposed. This pack had some meat in it. This has been a real furnace the last few days that it has taken to get to this point.
-
Yeah the second storm had a very tight snow gradient near 495. We had about 16” but once you went like 5-10 miles inside 495 it was mostly rain.
-
Cold, cutter, cold, cutter pattern...you can see how easily it would have been to get a good one in there. Still think we'll prob get at least another interior threat before the month is out. That PV doesn't really go anywhere...tries to retreat slightly but then drifts back south on ensembles.
-
I was spoiled in ORH for that 12 month period....had back to back nor' easters Dec 6-7, 1996 totaling 26", then 33.0" in the April .97 storm and then 18" in the Dec '97 positive bust. That was the end of the luck for a while though....brutal next 3 years until 2000-2001
-
A Super Nino would almost certainly suck....but I'll roll the dice any day with a mod/strong Nino as long as it's not east based.
-
Probably a few chances but so far nothing has gotten inside 7 days really.
-
I remember seeing the 40-50 dbz echoes on the doorstep and thinking it was definitely sleet. Then we got monster hooked-dendrite aggies pounding for a couple hours. We got 6” per hour in ORH at the peak. Not quite the 8” per hour stuff just northeast of us but pretty insane regardless.
-
I’m locking in 3/24 on euro.
-
Most of these systems were able to be found in PNS data if they were recent. For stuff prior to 1997 (which is when PNS data cutoff on the old BOX page), I'd generally use 2 day totals if I wasn't sure, but I did remember most of the late 80s to mid 1990s events so I'd know if they were separate ones (like December 6-7, 1996 for example). Most of the time, your numbers won't be affected if you solely used 2 day totals....you might get a rare instance like the Dec '96 example....but most of the time your bin won't change if it's adding a rogue few tenths from a snow shower...the only way it would matter is if it made a 5.8" storm into like a 6.1" or something like that....but even then, you aren't really going to be that far off the mark if you accidentally included a 5.8" event in the 6-11.9 bin. Most long duration events I already knew about too....late Feb 1969, Nov 10-12, 1987, Dec 20-22, 1975, etc.
-
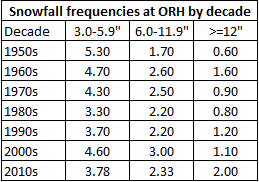
I found ORH from our discussion above...I don't have BOS or BDL at my fingertips but I know it's somewhere. They follow the same general pattern but just lower frequencies. Frequency = # of events per winter
-
LOL....its like seeing the NAM before a SWFE hammering H75 with 2C.....you know you're screwed when it shows BDF/CAD too
-
Meltdown's R Us. What's Buried Is Seen Again...
ORH_wxman replied to Cold Miser's topic in New England
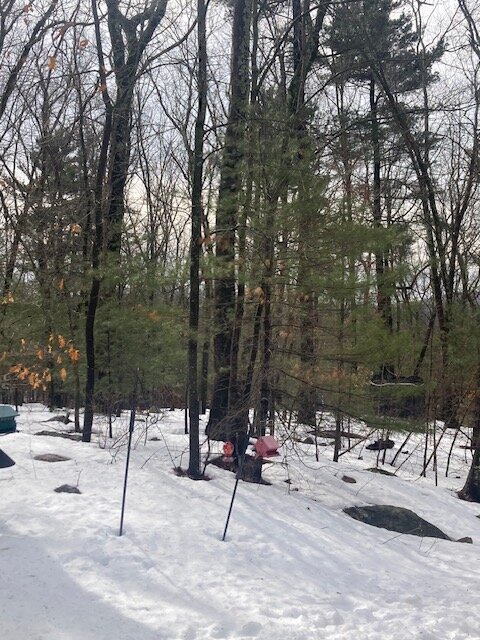
First time seeing the firepit this evening since mid January.
-
So many skeptics on that event leading into it. Models didn’t handle it well at all but the underlying theme was dumping a lot of QPF. A lot of tv stations had like 2-4” or 3-6” for interior elevated areas and I couldn’t understand it. I was going like 8-14” and I was wau too light.
-
They are up a ton since those were published. I have a spreadsheet I did that goes I think through 2018 or 2019. I’ll post the frequencies when I’m back on my work laptop. I think I did them for BOS and BDL too. I think ORH averaged roughly one 12”+ per winter in the last 30 years or so. That basically doubles the previous frequency. To be fair, that 1992 cutoff is brutal in the old averages….youre including the 1980s and those early 1990s years in there without the benefit of having those big 1990s years in there.
-
Epic.
-
Pretty damned impressive run of double digit pack though. One of these years we’ll get a March 2001 or 2018 or 2013 on top of this type of pack…but it wasn’t meant to be this year. Early March melt-outs suck…too early to really take advantage of it unless it’s barely any pack like 2012.
-
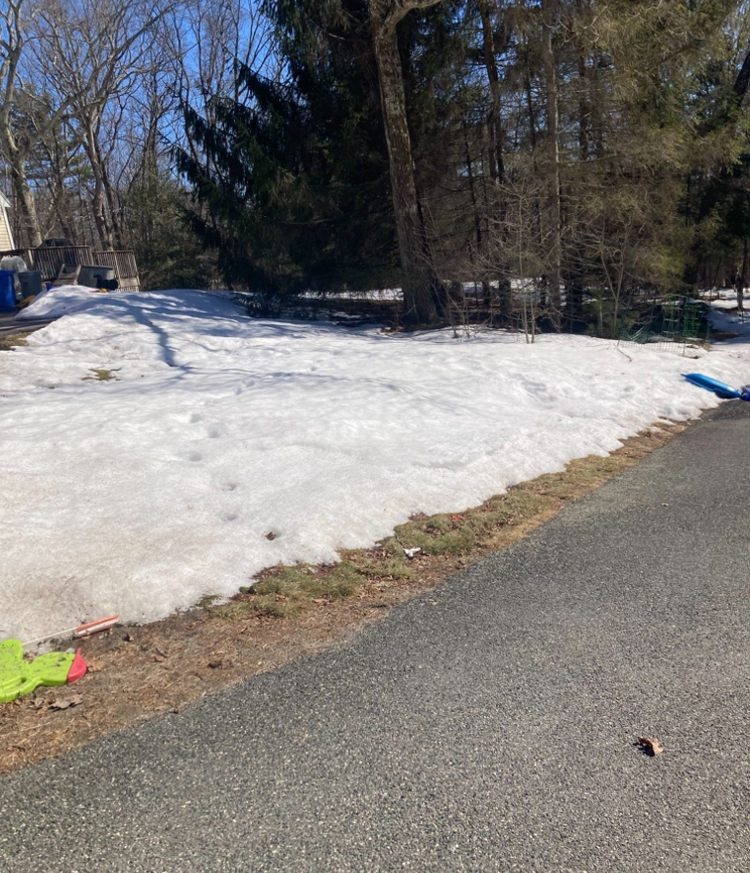
impressive meltoff there. It’s impressive here too. The last 24 hours here has been crazy. Taken an absolute beating. We still have more work to do, but for the first time in eons, the grass is showing on the edges of the snow and we can see a lot of rocks popping up in the woods out back. I hadn’t seen these huge boulders since mid January.