Sundog
-
Posts
12,054 -
Joined
Content Type
Profiles
Blogs
Forums
American Weather
Media Demo
Store
Gallery
Everything posted by Sundog
-
Where do you see the SE ridging?
-
36 degrees where I am but a few 33s popping up just two or three miles east of me.
-
We have had year after year where models in the medium and long range have had raging SE Ridges and wildly warm anomalies for December. I'll take models showing a nice trough in the east with some energy around and take my chances with that any day.
-
The wave amplified much further west this run, so the low formed farther west and the cold didn't get a chance to dig as south as the earlier run either. Like I said, there is a trough in the east and some energy around, maybe something can happen.
-
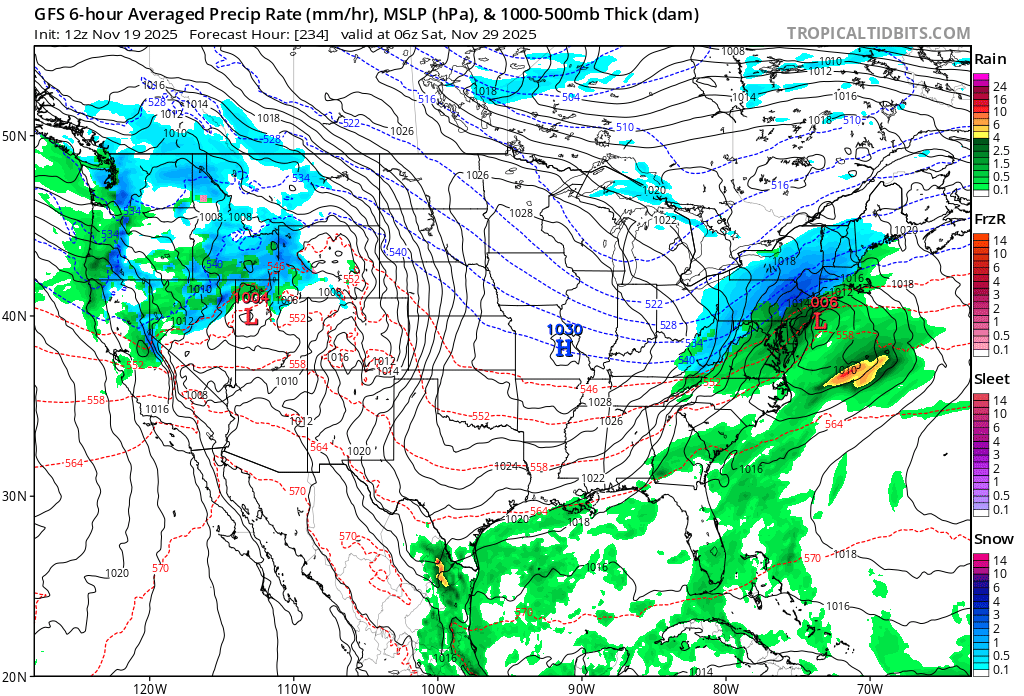
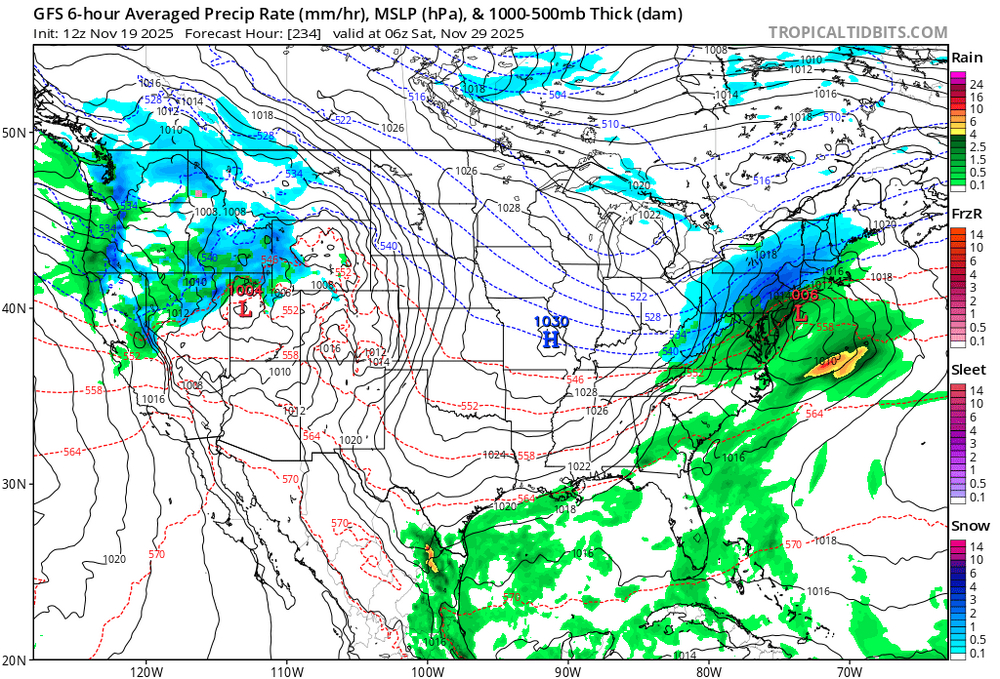
12z GFS for the people who were confused at my post earlier lol:
-
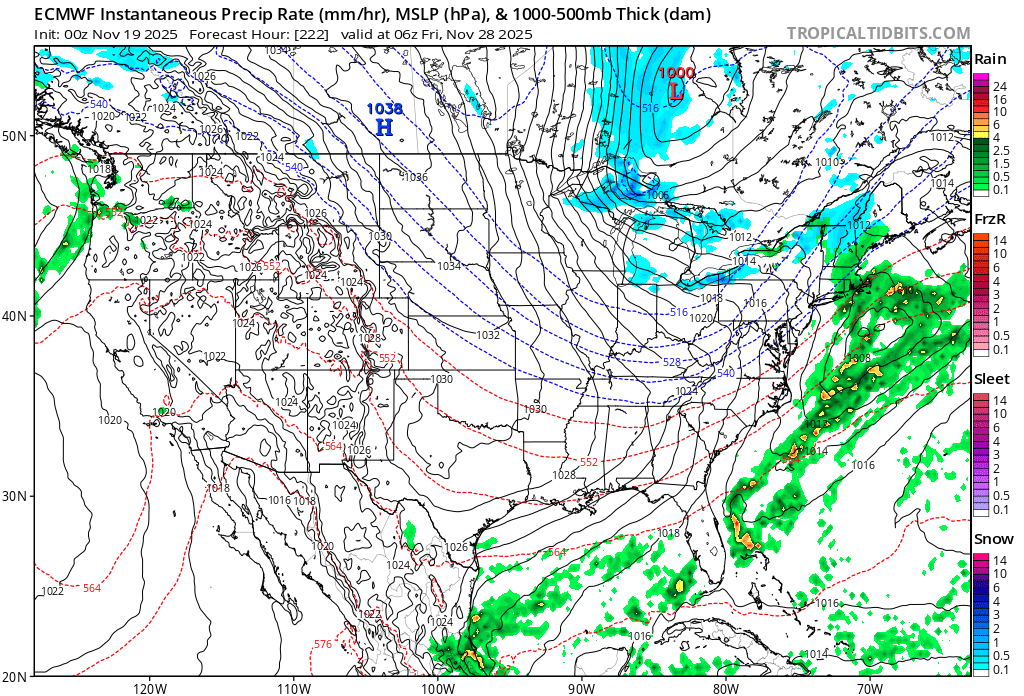
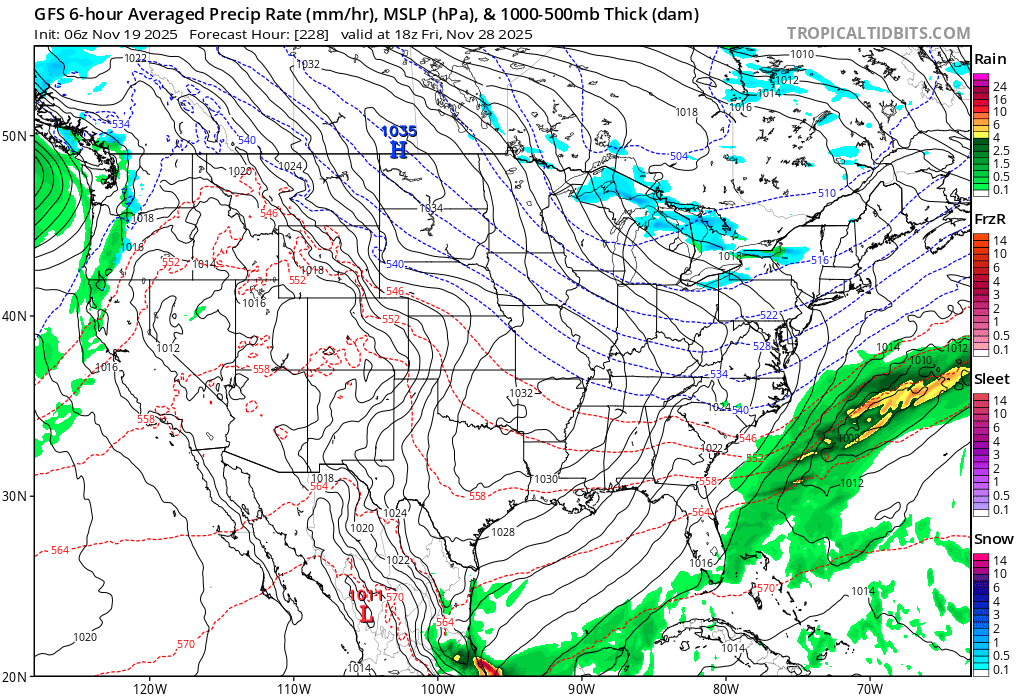
For the people who are confused or don't know what potential means: 6z GFS: 0Z Euro:
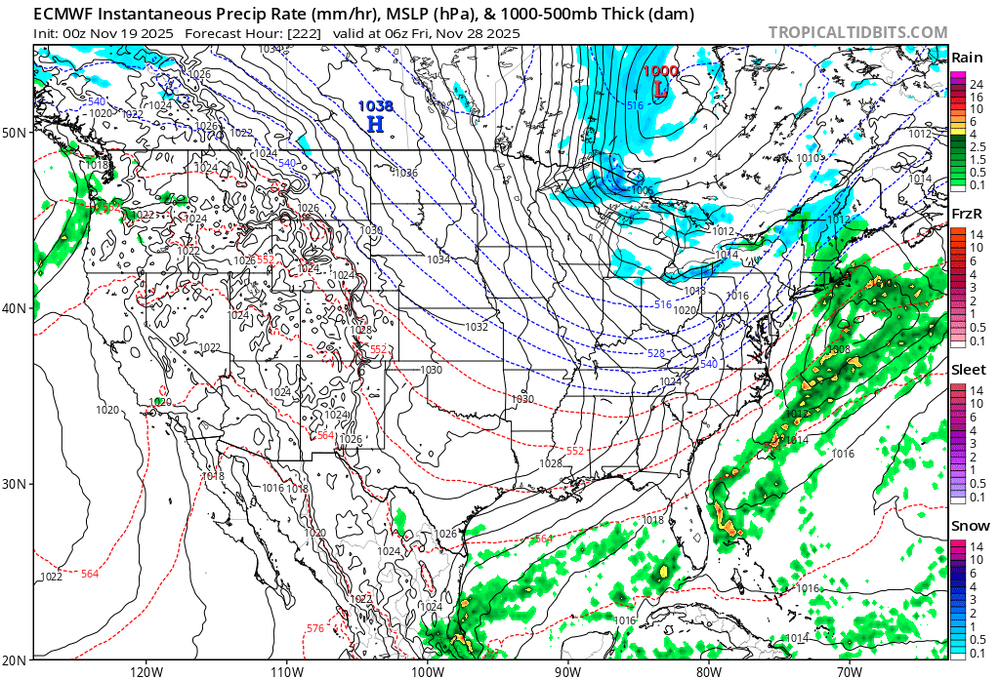
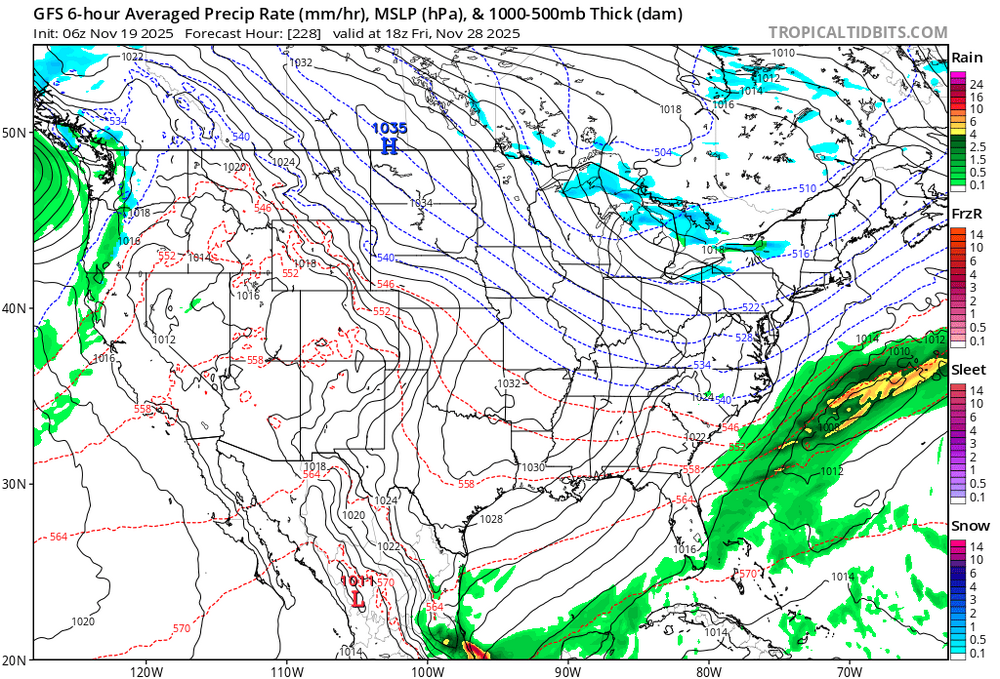
-
Potential snowstorm day 9 on 6z GFS? There could be something there, pattern looks good
-
This website is only Americanwx pre Louisiana Purchase.
-
Very chilly today
-
Euro has major Canadian cold in fantasy land
-
7 to 10 inches here, completely unexpected. Thundersnow by LGA around 4 to 5PM. My car managed to get parked in front of my then girlfriend's house for her parents' Christmas party and there it stayed overnight lol It was a rear wheel drive stick shift with low profile performance tires. Basically the worst combination for driving in heavy, pasty snow.
-
I remember the radar that afternoon at JFK like it happened yesterday. It took two hours just for the snow to get from JFK to LGA. But once it got going it was pounding.
-
I thought even on radiational cooling nights, the water can still influence the air temps nearby. For example, in the fall, on radiational cooling nights, being less than a mile from the water I will be a few degrees warmer than places in east Central Queens, away from both the Sound and the Atlantic. And it's not a matter of more or less urbanity, both locations are basically the same look wise.
-
How are the SSTs off the coast of Islip? Aren't they perpetually above normal? Islip might not be a good location to use as a metric anymore since they're tainted by the warm water.
-
What sucks for us is that it's warmer now. I'd rather have colder averages and take my chances with storm tracks.
-
The snow came down furiously in the late afternoon/evening. I have some videos from then and I recently rewatched them and remembered how heavy it was coming down.
-
Where were these readings actually taken because obviously there were no airports for a very long time.
-
It's about time
-
It's bad luck I agree, JFK on the ocean had TWO events over 4 inches in February 2024, one of them over 6 inches.
-
First freeze for NYC is a fake stat anyway. LGA didn't go below freezing until Novembver 26th in the 93-94 winter for example.
-
Bad luck back then. Still bad luck today but you also have averages warmer which increases the odds of a shitty record like this being broken.
-
Nobody over the age of 15 could have possibly thought that was normal. Ironically we recorded a disproportionate amount of epic duds during the last 25 years as well.
-
My current temperature is actually the warmest of the day at 41 degrees.
-
Tonga + shipping emissions cleanup definitely boosted temps. Sadly the boost from aerosol cleanup is sticking around. Tonga has a few more years left to clear out.
-
 There were a LOT of 33s area wide this morning