WesternFringe
-
Posts
988 -
Joined
-
Last visited
Content Type
Profiles
Blogs
Forums
American Weather
Media Demo
Store
Gallery
Posts posted by WesternFringe
-
-
25 minutes ago, WesternFringe said:
n = 136 isn’t such a low number, but I can run a statistical analysis of the median of decades.
I think mean is more useful over 136 years than medians of decades, which are a man-made concept, but I will take a look.
Especially when I start to look at trends since the 1960s. My n = 62 will go to n = 6
-
20 minutes ago, psuhoffman said:
A mean of such a low number can be skewed by a few years. I’d be more interested in a statistical analysis of the median and changes in the standard deviation.
n = 136 isn’t such a low number, but I can run a statistical analysis of the median of decades.
I think mean is more useful over 136 years than medians of decades, which are a man-made concept, but I will take a look.
-
This is the link for my DC annual snowfall statistical analysis since 1888.
Snowfall is barely decreasing when measured from 1880s (-.07” per year) and 1960s (-.03” per year).
Snowfall is up (+0.17” per year) when measured from the 1980s.
Most of the variability is random and statistical noise (96+%).
Doom and gloom, in my opinion, is just human error (recency effect) when interpreting recent winters emotionally.
These were my conclusions from the link above if you don’t want to view the link:
Conclusions:
Annual snowfall In DC has declined on average 0.07" per year since 1888.
Annual snowfall In DC has declined on average 0.03" per year since 1969.
Annual snowfall In DC has increased on average 0.17" per year since 1984.
The vast majority of the variability (94% up to 99.8%, depending on the time period observed) from year to year is statistical noise, or random, and not due to the passage of time.
-
4 minutes ago, psuhoffman said:
I have to admit I was extremely busy and preoccupied much of last winter and what time I did devote to snow was mostly predicated on my ski trips. But…I seem to have a VERY different perception of last winter than many. I’m seeing a lot of posts where people seek to be rooting for a repeat of last year. Here at least last year was one of the worst snowfall winters of the 18 I’ve spent in the area. Finished 18” below avg and 12” below median. I’m definitely NOT rooting for anything that resembles last year. I think this winter will resemble last year, but that’s a negative to me.
I had 28.5” last year which was a few inches above climo for here (Augusta County). Perspective is paramount, for sure.
-
23 hours ago, psuhoffman said:
Off the top of my head I think the non Nino years with less than 1” were 1949-50, 54-55, 58-59, 75-76, 80-81, 84-85, 2001-02, 16-17, 19-20
So one in the 40s, two in the 50s, none in the 60s, one in the 70s, two in the 80s, none in the 90s, one in the 2000s, and two in the teens. Seems like a pretty consistent pattern.
-
Down to 16 degrees here and continuing to drop. Gusts over 40mph. Sunny.
NW of Staunton
-
2 hours ago, NorthArlington101 said:
Unfortunately for our I-81 comrades the 12z EURO is putting out a icier solution than earlier runs. Cut back snow totals a decent bit.


That is consistent with what LWX has been forecasting for out here in Augusta County. An inch or two of snow/sleet with .1 to .25 freezing rain.
-
10 hours ago, psuhoffman said:
I agree with @CAPE that our next modoki Nino is a great test case. We underperformed our last Nino. The excuses have some validity. But if we underperform the next one…it’s starts getting harder to ignore the obvious. If we get a modoki next year and DC gets 40” then maybe it’s been more a temporary cycle. I think it’s part both. Maybe 70/30 bad pattern cycle v climate. This would have been a bad period in any decade given the pac longwave pattern. But I think it’s been made worse. I’m curious myself to see how “muted” our snowfall is once we get a truly good and long term sustained pattern where we can’t make any excuses if it fails to produce prolific snowfall.
This. I have a gut feeling we can still do snow well in a modoki nino and a nice run of plentiful snow years will put this all in perspective. Then we can better determine whether this poor run we are currently in is more cyclical in nature vs a long-term trend. We shall see.
-
 1
1
-
-
28 minutes ago, IronTy said:
Like I said, same with insomnia, the harder you try the less likely it is to happen. You have to let go your desires and then you will be rewarded. I'm still trackin' the SER though.
Okay, keep us posted.
-
 1
1
-
 2
2
-
-
26 minutes ago, WinterWxLuvr said:
IOW, how much for my house?
Well, exactly. Do you follow this weather board to see how much other people are getting, or how much you might get? Lol
Also, I score little events out here when most of you all have given up, this place turns to banter, and Ji is jumping out windows.
So, yes, I was asking how much the Euro showed for mby, and I am not sorry.

-
1
-
 1
1
-
-
48 minutes ago, TSSN+ said:
At least we ain’t the only ones going to get the shaft. Barely going to snow up around Chicago either now per euro.
 45 minutes ago, frd said:
An improvement with this morning's run.
Maybe I can take advantage of the warmer waters in the C and D canal , ha ! A C&D Canal snow streamer. I am very desperate!

Does anyone have a VA zoomed in map of 6z Euro snowfall for this storm? To my weenie eyes, it looks like the 6z is depicting 6-8 inches in western Augusta County.
-
1
-
1
-
-
3 hours ago, snowmagnet said:
NC has done better than us the past five years.
Such a blanket statement that it is almost meaningless. It matters where you live in VA and where you live in NC. I eked out 28” last year here in the valley (augusta county). Pretty sure most of NC didn’t do better than that.
On the other hand, I am sure the mountains of NC do better than VA Beach at accumulating snow.
-
1
-
-
1 hour ago, clskinsfan said:
18z NAM with some Shen Valley love with the first wave. Nothing special but an inch or two is still possible.
Also, there is still frozen falling at the end of its run for far western and northernmost VA.
-
1
-
-
3 hours ago, Terpeast said:
Agreed. I don’t think this is a good pattern to begin with. By that I mean what’s actually out there in reality, not what has been depicted on model maps 7+ days out. There’s a difference, and the “good” pattern the models told us was coming did not fully come to fruition.
Yes we got the -nao, but we did not get the +pna (which is even more important in Dec than Jan-Feb)
Having all these cutters is about what we would expect from a La Nina.
Meanwhile, my buddy in Deadwood, SD just got a record 5 feet in a couple days. If snow is the measure, there are winners and losers in all patterns.
-
25 minutes ago, CAPE said:
Some adjustments are still possible. The wester you are the better the chances for something frozen at the beginning and maybe again at the end, the way it looks to me. Over here, it's pretty much locked in as a mild rain event with following cold.
Yeah, I am still in the game for a white Christmas out here, but anything over 4 or 5 inches seems out of the realm of possibilities at the moment.
-
1
-
-
10 minutes ago, SnowGolfBro said:
The cluster of lows near the benchmark on the 6z EPS is encouraging. To steal from the CWG:
Less than 1”…..20%
1-3………………..30%
3-6……………….40%
Und BECS?……10%This is my first preliminary early call minus a map with some weenieism factored in, subject to change “forecast”.
Without a map or location stated for your forecast, you can just adjust where it was for afterwards and claim victory.

-
I'll admit I'm looking forward to seeing the clown maps for this one.

Here you go. Brutal cutoff on the 18z GFS Kuchera (from Pivotal)
. -
2 minutes ago, Solution Man said:
Who has PBP?
Yoda? Stormtracker? Bueller? Bueller?
-
1
-
1
-
-
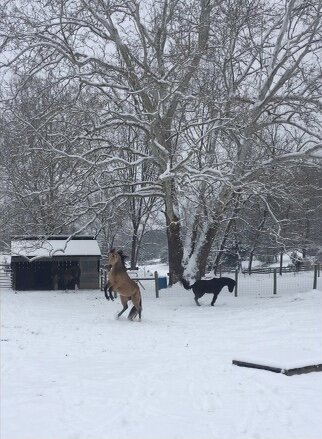
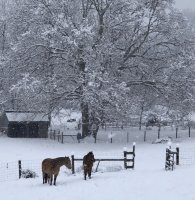
32 and light sleet here NW of Staunton. Trees covered in ice and about an inch of sleet on the ground. Schools are all closed. Nice ice storm here!


-
8
-
-
35/30 and intermittent sprinkles here NW of Staunton
-
34/31 here NW of Staunton
-
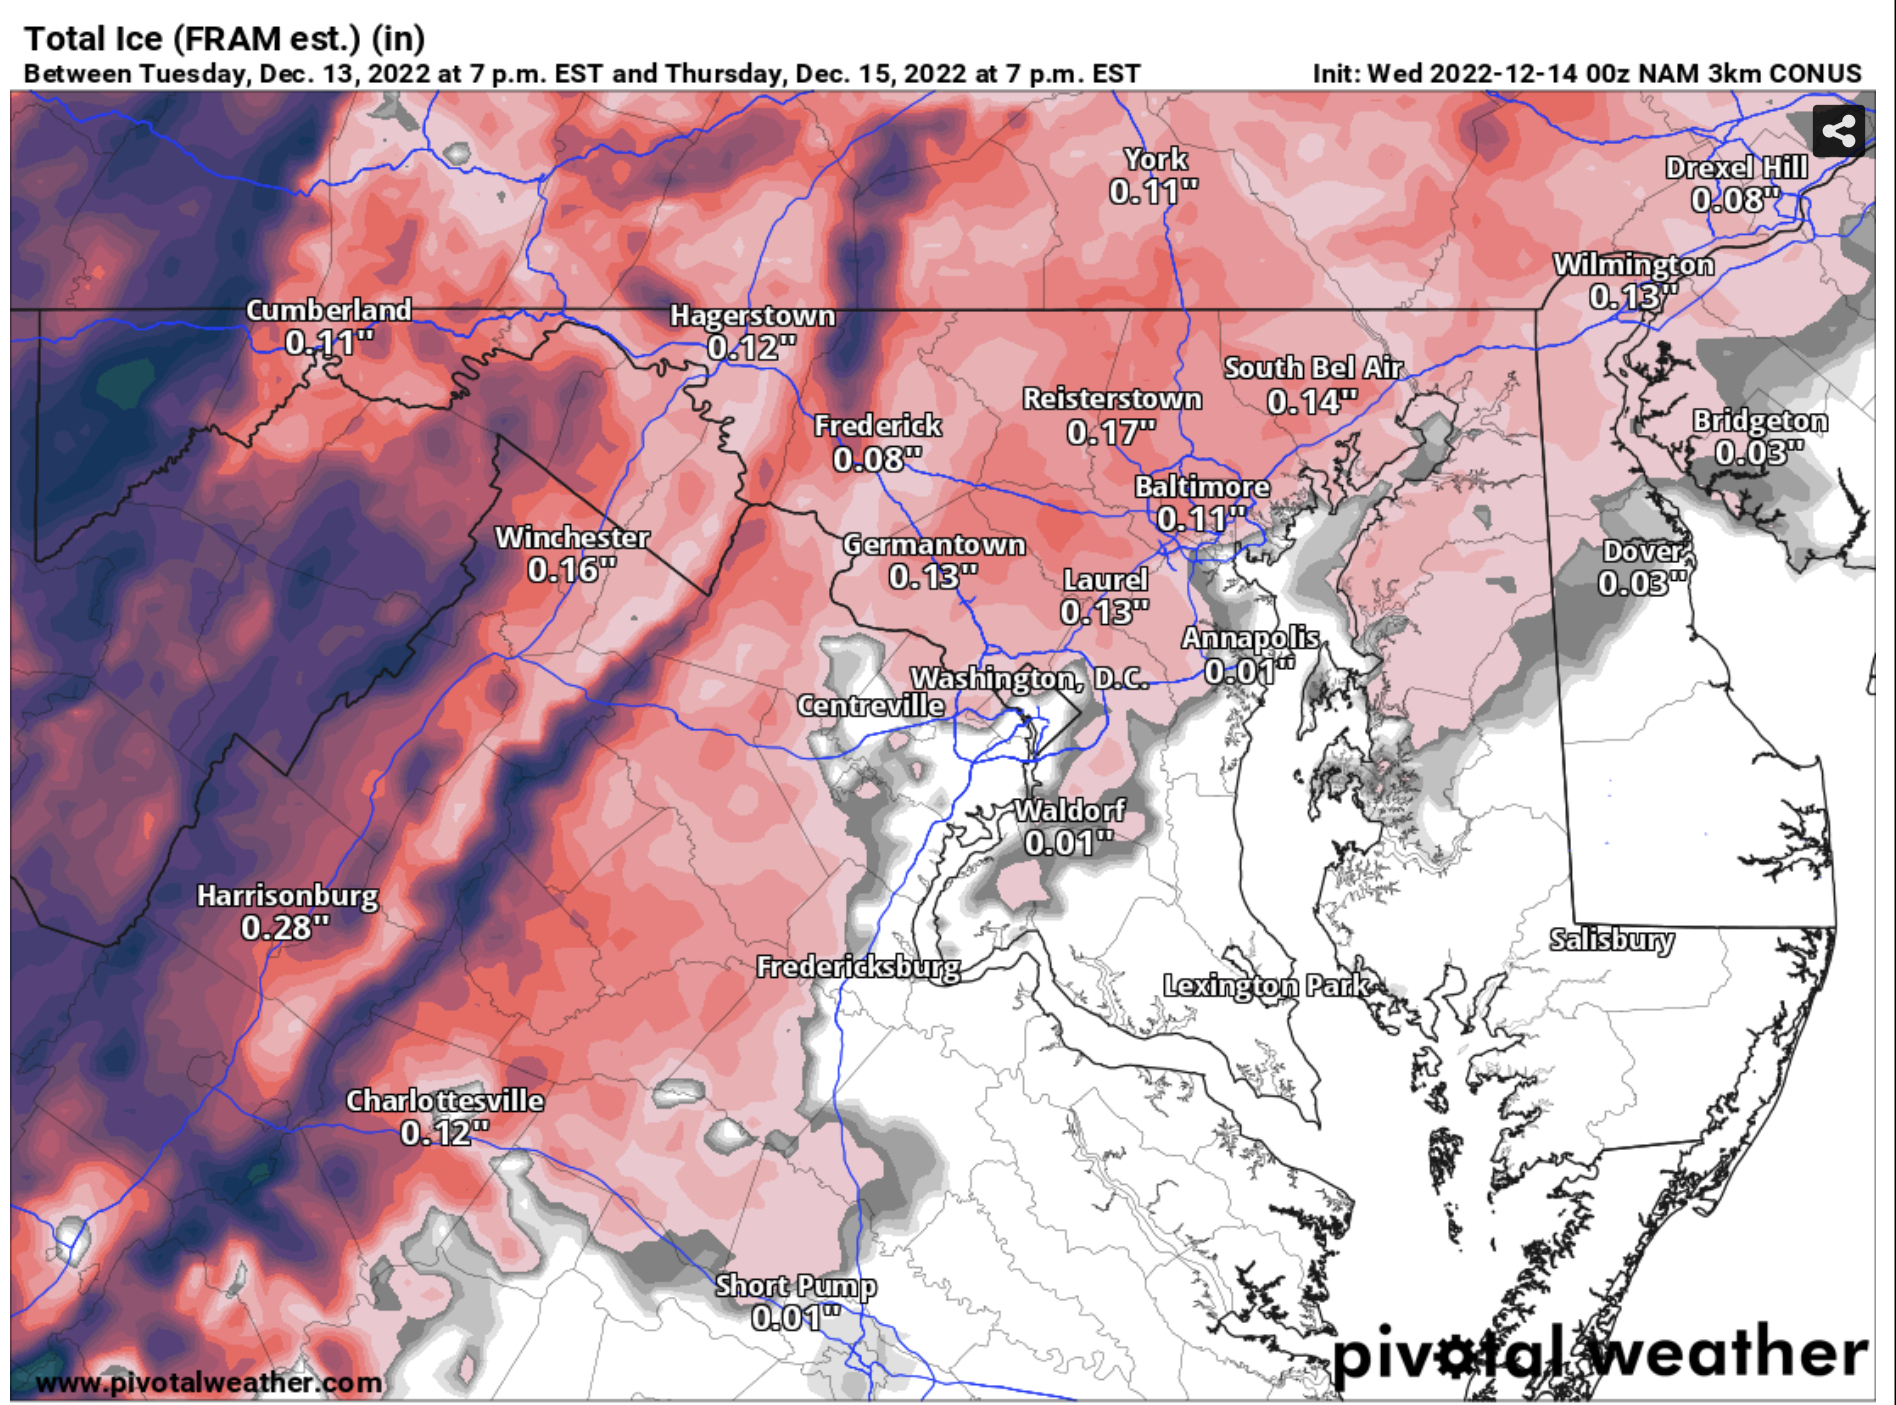
14 minutes ago, mappy said:
Pivotal’s FRAM ice output for the nam

how much ice when it is half orange and half blue?
-
LWX upped ice accumulation totals about 40 minutes ago

-
2
-
1
-
-
7 minutes ago, snowmagnet said:
How soon is this storm hitting the I-81 corridor on Wednesday? I know friends who have students coming back to nova from colleges tomorrow….
They should be fine traveling tomorrow. Early Thursday morning is when the freezing rain is modeled to start.


January 2023 Mid-Long Range Disco
in Mid Atlantic
Posted
Usually studies with n=18 and higher start to become highly generalizable to the general population and those below it do not (thus my issue with looking at decade median data, especially from recent decades). Even looking at decadal data from 1880s only gives us n=14. That isn’t a generalizable sample size.
At least that is what I was taught at University of Virginia when I was getting my doctorate
eta: I think looking at the slope of the standard deviation from 1880s might be useful. Definitely more useful than median decadal data