WesternFringe
-
Posts
988 -
Joined
-
Last visited
Content Type
Profiles
Blogs
Forums
American Weather
Media Demo
Store
Gallery
Posts posted by WesternFringe
-
-
Light snow, 32°. Starting to accumulate.

.
-
 6
6
-
-
Snow and sleet falling from the sky and 33 degrees. NW of Staunton in Augusta County
-
2
-
-
So, I teach math in HS as one of my jobs. 20% of tracking winter weather for me is tracking ‘snow’ days off for my wife (also a teacher) and my son in HS and my daughter in MS, so it is cool that Augusta County, and Staunton, and Waynesboro are all out tomorrow.
But 80% is getting enough snow to sled with the kids and plow and make snow angels and have snowball fights, etc. Not sure we will be able to do this tomorrow, unfortunately!
-
46 minutes ago, TSSN+ said:
Nam also basically says no. Fun stuff.
Kind of location dependent as far as the no
-
3 minutes ago, jayyy said:
Ended up with 7.5” in east Saratoga springs. Heading back home tomorrow. Hope to bring winter home to Maryland with me

.I grew up just south of Saratoga Springs. Had 60”+ in an average winter. Please bring it back with you!
-
1
-
-
Beautiful ice patterns on the car this morning. Flurries on and off today- currently on.

Pretty flakes on the picnic table out back!

-
9
-
-
19 minutes ago, WinterWxLuvr said:


I would take the 2" the CMC or 3" the GFS or the 3-4" the Euro is showing in western Augusta County in a heartbeat! Interested to see what the 12Z suite shows, especially the Euro and NAMs. It is a super sharp gradient so every little bit of CAD will make a big difference for some.
-
1
-
-
23 minutes ago, Ralph Wiggum said:
Been away for a bit....what happened to the Ji storm for midweek? Many were suggesting this was the best setup of the entire season so far? We still on for that one?
I think he said the 28th there was going to be a snowstorm and we needed to just deal with it.
-
Saw snow mixed with rain in the 11-12 range, but mostly rain and no sleet observed.
nw of Staunton in Augusta County
-
1 minute ago, Solution Man said:
@Ralph Wiggumgets left out, gotta have Ralph included
I forgot about Ralph. Good point!
-
1
-
 1
1
-
-
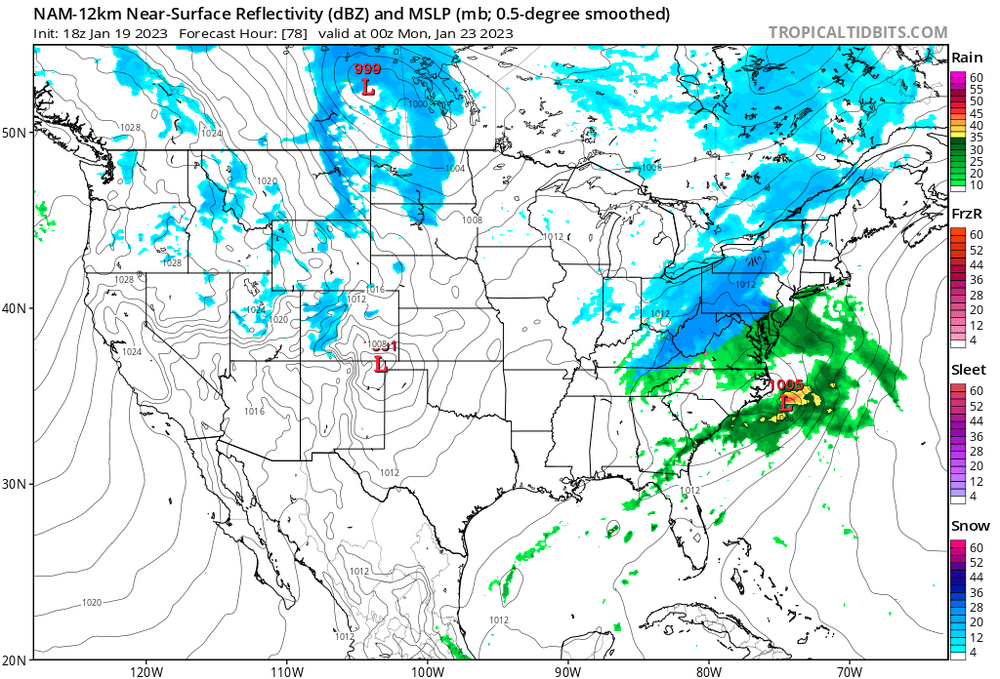
1 hour ago, CAPE said:
Ten+ days out and this is only a 6 hour panel. You get the general idea.

P 04 for the entire subforum win!
-
1
-
-
14 hours ago, Stormchaserchuck1 said:
These snowdepth maps are really good for all generalities, I've learned. Since 2018, they have verified I think everytime, or 90% vs model p-type radar plots of the same model. Shows a pretty clear-long miss.
That’s a hit for me
-
1 hour ago, Solution Man said:
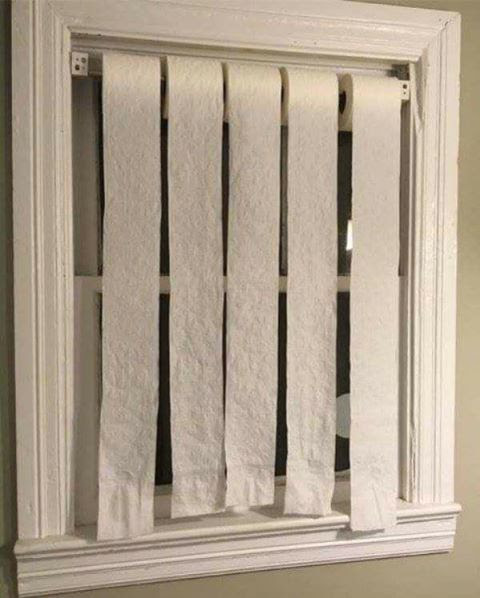
Shit the blinds makes so much more sense now
-
2
-
 8
8
-
-
2 minutes ago, Jrlg1181 said:
Yeah , I'm up to .65 inches of icy mix for the season so far over Waynesboro way.....
I live NW of Churchville (outside of Staunton- so about 35 minutes to your NW) and have had about 1.5" of sleet/snow this year lol. Had about an inch from the 12/15 storm. Last time I saw snow without rain or sleet mixing in was 11/17 and 11/18 when it was flurries. Hope it gets better soon. 2020 was a pitiful winter, but at least we eked out 3 snowstorms for a measly 7".
-
1
-
-
Ice storm with a little snow here in Augusta County. Different date, same storm we have had 3 times previously. From Pivotal:


-
Incoming! Another sleet/freezing rain storm for the valley. Yay. Man, this winter is breaking even my general optimism for snow chances! lol

-
3 minutes ago, windycutter said:
Decent look
There’s a separate thread for that
-
1 hour ago, jayyy said:
I think my area over to emittsburg and points WNW could catch some snow out of the Sunday - Mon event. The odds of a significant event are fading quickly, but I’m not ruling out a couple inches at this juncture. It’s too early to throw in the towel for my area.
.Same for my location in western augusta county
-
2
-
-
1 minute ago, Siberian-Snowcover-Myth said:
My Daffodils are gonna love the watering over the next couple of weeks.
Cool- keep us posted
-
1
-
-
10 minutes ago, snowfan said:
GFS looking good

Haha! Fringed! (On the dark blues)
-
1
-
-
I watch NHK (Japanese PBS) a decent bit and their snowfall is well below normal nationwide this year.
Maybe nationwide that is true (I don’t know), but a quick search shows that at least parts of Japan have been experiencing record snowfall. “Heavy snowfall across Japan” and “some parts of the country are reporting 3 times their annual snowfall” and “December snowfall records set” and “24 hour snowfall records set” etc and this is all after last year’s crazy amount of snow in Japan


-
21 minutes ago, psuhoffman said:
I’m talking about NOW. Right now. I don’t know what May or may not happen 50 years from now and frankly I don’t care. I have my suspicions but I’m not been going there. Y’all do that.
Your posts definitely imply this is the new normal. At least that is how I think the vast majority of folks in here read them. You talk about trends a lot. And medians of decades declining. The posts are very suggestive of how things might be going forward, even if that isn’t your intention.
eta: You also write about how if we need every teleconnection to even snow along with anomalous cold, then what is the point. I am not sure how one would interpret that other than you are implying this is the new normal.
I agree with BobChill and Ji and others that our lack of snow is primarily cyclical. I had 28.5” last year, which is a few inches over climo, so we all have our perspectives.
-
1
-
1
-
-
3 hours ago, Terpeast said:
Maybe someone will step up and be our sacrificial lamb so we can get our good winters back.
I volunteer. I am one of those folks who thinks recency bias and a bunch of ninas has colored our understanding of the past and our expectations for the future.
If we don't turn it around in the next 2-3 years, I will admit I am wrong, go see the reaper, and disappear from this forum forever. Because what is the point in tracking if we absolutely can’t snow for the most part? Especially if we have to read about it over and over from people in every mid/long range thread. That isn’t good for mental health if one is investing so much time tracking potential snowstorms!
-
Rain with snow mixing in. Went from 43 to 37 degrees on my 15 minute car ride. NW Augusta County
-
4
-


January 25, 2023 Front End Frozen Chance
in Mid Atlantic
Posted
This ‘trainwreck’ is much appreciated, though. Lol. First time I have seen accumulating snow (rather than accumulating sleet) this winter. It also gives my family of four a much needed break from the daily routine and school since my wife and I are both teachers. Time to get the wood stove roaring and watch light snow falling from the sky.