WesternFringe
-
Posts
1,131 -
Joined
-
Last visited
Content Type
Profiles
Blogs
Forums
American Weather
Media Demo
Store
Gallery
Posts posted by WesternFringe
-
-
2 minutes ago, brooklynwx99 said:
UKMET out to sea, ICON buries Virginia, GFS smokes NYC, CMC smokes you guys, and ECMWF got way colder
pretty well defined idea of what this is going to do IMO
But the trends…
-
 4
4
-
-
4 minutes ago, WEATHER53 said:
Observation and 50 year historical record keeping vs clueless and dependents solely upon models.
You practically said 25% for each of 4 scenarios, so you have all of your bases covered and the forecast is essentially meaningless, but keep trashing others with ad hominem attacks.
eta: ninja’d by NA101
-
 1
1
-
-
9 minutes ago, Jebman said:
This cutter washing away the snow can be mitigated by simply grabbing a Jebman Shovel then piling up the snow embarrassingly high on the north side of sunlight blocking objects. Pack it down then pile it way up. That's what I would do if I was there. Pile up snow like The Jebman!
I like you and always have enjoyed your posts, but do you always talk about yourself in 3rd person? Too funny. Lol
20 minutes ago, Terpeast said:From last night’s runs, I assume.
It’s trended colder from 4+ days ago when it was depicted as all rain.
So the actual verification might be somewhere in the middle. Too early to tell, but I’m not sold on this being a mostly snow event here. We don’t even have the first wave passing us yet, and that will partly determine the cold air setup here.
If one data point from where you start makes a trend, then my Stats professors lied to me. Agree with your post regarding the first wave determining a lot of the outcome of the second wave.
-
23 minutes ago, psuhoffman said:
The gefs is trending warmer also.
Starting from what reference point? Last 3 runs? Last 5? Last 10?
Not being contentious, just honestly curious. Like you have correctly stated before the starting point is important to denote when identifying trends, and choosing that starting point can frame the data in any way you would like to frame it. In other words, I am wondering about the magnitude and the timing of the trend.
eta: For example, the 18 hr trend on Will’s gefs mean snowfall maps was robust and towards more widespread snowfall in Virginia, but the 24 hr trend was minor and only a slight push SE with the heavier snow line.
-
3
-
-
4 minutes ago, Weather Will said:
WB GEFS snow mean current and last 4 runs about the same IMBY. Less SE.


The latest run looks most similar to its run 24 hours ago, except for a slightly better push SE with the 2” line in northern Maryland and towards the metros.
-
Question for the mets, is there a NBM for ensembles? Or does the blend include ensembles, ops, and mesos? If it includes all, does the weighting change as time progresses toward zero hours out?
-
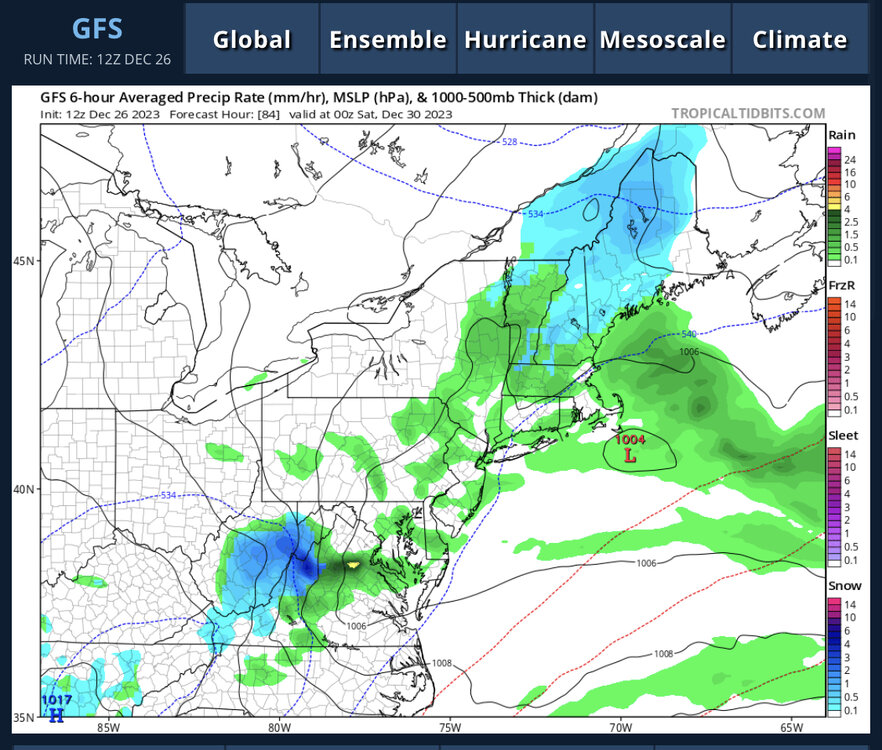
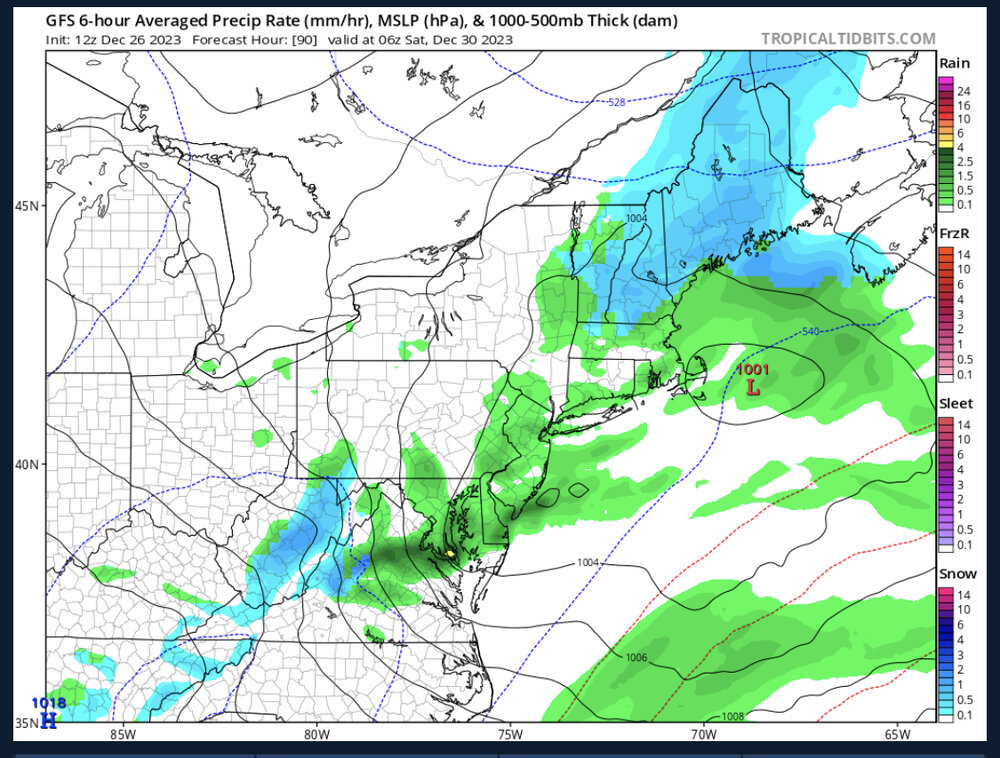
I know it is an op run at 6-7 days, but the gradient on the 12z GFS is crazy if it were to verify like that. Verbatim Augusta Co imby would get 10-12” but 10-15 miles away would get 0-1”!
-
1 minute ago, LP08 said:
Positive changes just about everywhere.

Apparently, the geese know what’s up.
-
5
-
10
-
-
So, the Geese Index is high right now. And there is a 2-3 week delay in its effect on snowy weather, sort of like SSW events. Got it!
In all seriousness, I am focused on the ensembles and the 7th. Would be nice to get everyone on the board, even if it isn’t the MECS, HECS, or the KU that some in here are hunting.
-
Snowing at Wintergreen according to mPing users. Reports of sleet in Greenville, according to family members.
-
1
-
-
1 hour ago, Ji said:
Euro at 216

Gfs at 216
Ops aren’t great at predicting temp at hr 216? Wow! Great insight
eta: ops are pretty useless after Day 5, but we know this
-
 1
1
-
-
6 minutes ago, nj2va said:
Can @pazzo83 and @WesternFringe take it to banter or just create a CC thread? FFS.
Yeah, whatever man. See my post. I am not even arguing either side of cc though
my whole point is that the cavalry is late bc the model doesn’t even show what we were arguing over being impossible even happening anymore
-
11 minutes ago, pazzo83 said:
yeah i mean that's what we'd expect from a slightly cold-biased model output given low position and other factors. i think the question is, on that particular model run (and we've seen this in quite a few others over the past couple of years), why - given the low position, antecedent air mass, etc - was the boundary layer so warm? What is having the model generate that as the highest probability outcome? We've seen a number of such outputs - and actual events - that should have some snow that were rain for virtually everyone. Obviously the concern here is that the base state has warmed significantly and models are starting to output scenarios - even fleeting - that reflect that. You disagree with that premise so you try to undermine any such concern. That's fine - but don't trivialize the concern.
Again, people putting words in my mouth. I don’t disagree with any premise you mentioned. I also am not going to pretend that a 192 hr op depiction proves anything! That is my point. I am not talking climate change at all. The next 2 runs of the fricking same model showed nothing like we were talking about!!!! So why even say this shouldn’t happen when it never fucking did!!!! Jesus Christ, that is all I am saying!!!
-
1
-
-
19 minutes ago, pazzo83 said:
again - you are focusing on the discrete (PSA to the board - not you WF - the word is discrete, not discreet - discreet describes acting in a way so as to avoid attention) outcome relative to others in the overall model timeseries vs the fact that the model generated such an output at all - and we've seen myriad other such outputs over the past couple of years (and real outcomes that match them).
Yeah, we were all talking about a discrete threat, so you have it right about that.
The models saw rain bc the ground layers were warm in its depiction of the future. And then we all agreed to kinda see what actually happens in 8 days instead of focusing on one model run’s output. But I am missing the point? Enlighten me
eta: And it is bs if you say it is concerning when the model says this at all. Where were you all in saying it was concerning when the models were portraying 20-30 inches a few runs ago? Get real and accept the good with the bad. And also realize that 192 hr depictions rarely verify.
-
14 minutes ago, pazzo83 said:
just keep your head buried in the sand I guess.
If that means discounting an op run at 192 that never happened that it’s own two subsequent runs disagreed with and said would not happen, count me an ostrich! Lol
ETA: but keep preaching to me about events that never happened. That will prove your point.
-
13 minutes ago, pazzo83 said:
again - you are missing the point. the fact that it was a model output at any point is the concern.
If every model run’s output is a concern to you, you are ridiculous and missing the point. Hour 192 never verifies on the GFS. But yeah, I am missing the point!? Lol
eta: it was model output that we were discussing that never happened at 192, and hasn’t been modeled since as even close to our area at 186 or 180 in the 2 subsequent models runs, but I am missing the point? I should have been alarmed by the one run?
Okay, you are right. The fact the models showed something that never happened is evidence of….what exactly?
-
1
-
-
3 minutes ago, pazzo83 said:
i don't think you are quite grasping what he's saying. all weather models are probabilistic models that factor in historical data, current observed data, and the understood mathematics that describe the atmosphere. obviously it could be wrong because models are often wrong. but let's look at the inputs again - unless you are arguing that one of those inputs was somehow corrupted for this particular model run, it is telling you that the most likely outcome is what is shown (with rain basically everywhere). i think that is where the concern lies - it is outputting an outcome that is not what one would've expected in years past, meaning it is incorporating some sort of fundamental change in terms of those inputs. I don't think the math has changed wildly (if only to improve model precision), so...
So a model that factors in historical data is outputting what would not have been expected in the past? Thanks for the insight.
Abd btw, the model isn't even showing anywhere close to what we were disagreeing about 2 runs ago at hr 192 anyways, so you are way late.
-
1
-
-
4 minutes ago, Weather Will said:
It is an operational run in fantasy land beyond Day 10, but there is no cold air....compared to yesterday's 12Z run. Zonal flow in Canada, no cold air moving south. Big disappointment if correct.


So the forecast temp on an op changed 7 degrees 13 days out? Shocker!
-
8 minutes ago, clskinsfan said:
You are missing the point. The fact that isnt a snowstorm in the Shenandoah Valley in early January is a problem. It would be in any other year I can remember. We have been torched at the surface plenty of times heading into snowstorms in the past. Something is just different about the base state now.
Didn’t a wise poster (psu) just say this 20 hrs ago?:
A pattern change doesn’t mean we instantly snow. You seem overly focused on snow otg but in the long range we’re often discussing a process. There was no cold anywhere in North America. We can’t go from that snow by snapping a finger. It’s taking some time after the long wave pattern flips to establish enough cold in our area to get snow. Even then we will need luck. It is a pretty good pattern to get a snowstorm in the eastern US. But it could go just north of us. Just south. Cut island a bit. Out to sea. A good pattern doesn’t guarantee snow. We also need luck.
-
2
-
-
GFS saying snow again for Augusta and surrounding counties Friday night into Sunday morning.
-
44 currently and steady light rain today in western Augusta County.
-
2 minutes ago, psuhoffman said:
You make a good point. But it HAS been happening. People have just been sticking their head in the sand when it does. Super Bowl 2021 was the best example. There was a perfect track rainstorm last winter also.
I hear you, but let’s wait until it happens or at least gets closer and is continually modeled to add it to the book. And maybe more than just one model showing it as well.
It is also perspective. My elevation of 1550’ helps out here. I got 8” on 2/6/21 for the superbowl and another 5” five days later. This storm that we are discussing now drops 6” imby verbatim according to the GFS.
Not sure what storm last year you are referring to, but it has happened out here as well. Did we not used to get perfect track rainstorms in winters in the past? I remember some in the 80s even in upstate NY that were disappointing rain even with a classic track.
-
2
-
-
6 minutes ago, psuhoffman said:
No because it’s irrelevant. The fact a sophisticated simulation (which frankly is biased cold) says that’s the most likely outcome based on its current data and physics is alarming. It shouldn’t be possible to have a vertically stacked bombing low there with a deform band right over us in January in a pattern where we’ve had a NW flow into the east for a week and get rain. How that doesn’t bother anyone is beyond me.
Never said it didn’t bother me, so please don’t put words in my mouth. I think it is perfectly relevant to distinguish between weather depicted at Day 8 on a model (with very little skill after Day 5) and weather that has actually occurred.
I will have to respectfully disagree on this one. When you say, “it shouldn’t be possible” it very well might not be. There are plenty of times the experienced and knowledgable posters on here disagree with the surface depictions based off of the H5 in the Day 5-10 range. But this time it is irrelevant that the event hasn’t occurred and is 8 days away? C’mon, man!
-
5
-
-
44 minutes ago, osfan24 said:
It's still rain on the backside when the low is off the coast of Nantucket. Alarming. Going in the PSU book.
It hasn’t happened yet. Can we at least wait until it occurs to put it in PSU’s book?
-
2
-


Jan Medium/Long Range Disco: Winter is coming
in Mid Atlantic
Posted
No, but I don’t call people names. Can you say the same?
You made a forecast, I commented on it. I still find it literally meaningless to forecast similar probabilities for 4 such disparate outcomes.
eta: and always will