

Cobalt
-
Posts
4,865 -
Joined
-
Last visited
Content Type
Profiles
Blogs
Forums
American Weather
Media Demo
Store
Gallery
Posts posted by Cobalt
-
-
2 hours ago, ChescoWx said:
Is global cooling underway off the east coast of the US?? I guess global warming is the cause of the warming off the coast of Africa.
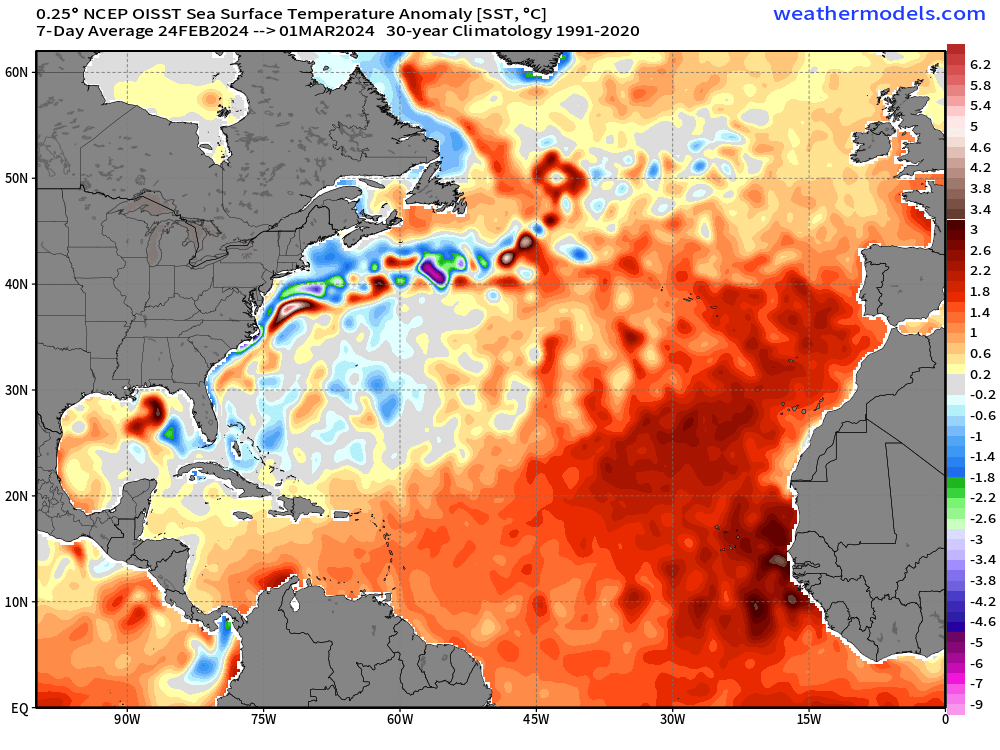
The entirety of the area depicted, averaged out, depicts a positive anomaly against the 1991-2020 averages. The red very obviously takes up more space on the map than the limited blue hues.
-
 1
1
-
-
17 hours ago, TheClimateChanger said:
As we round out the first quarter of 2024, I thought it might be a good time for a review of temperatures. Through the first quarter of 2024, it's been quite toasty in central Pennsylvania.
Williamsport: Third warmest start to the year [of 130 years], behind 2012 & 2023.
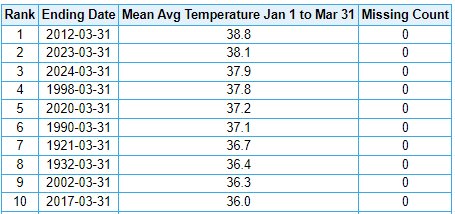
Harrisburg / Middletown: Sixth warmest start to the year [of 136 years], behind 2020, 2023, 1998, 2012 & 1990.
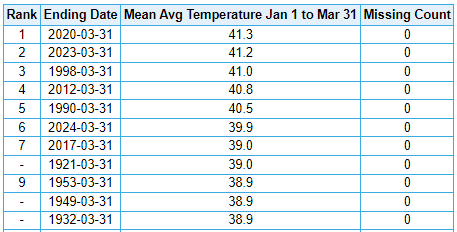
Yeesh, so many recent years in those charts.
-
 1
1
-
-
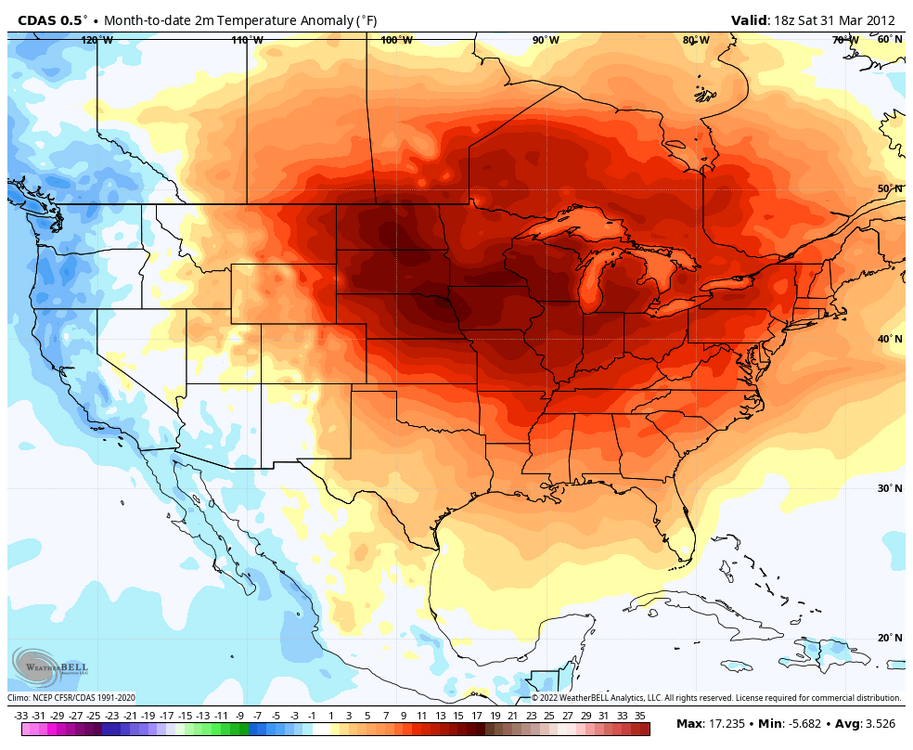
17 hours ago, ChescoWx said:
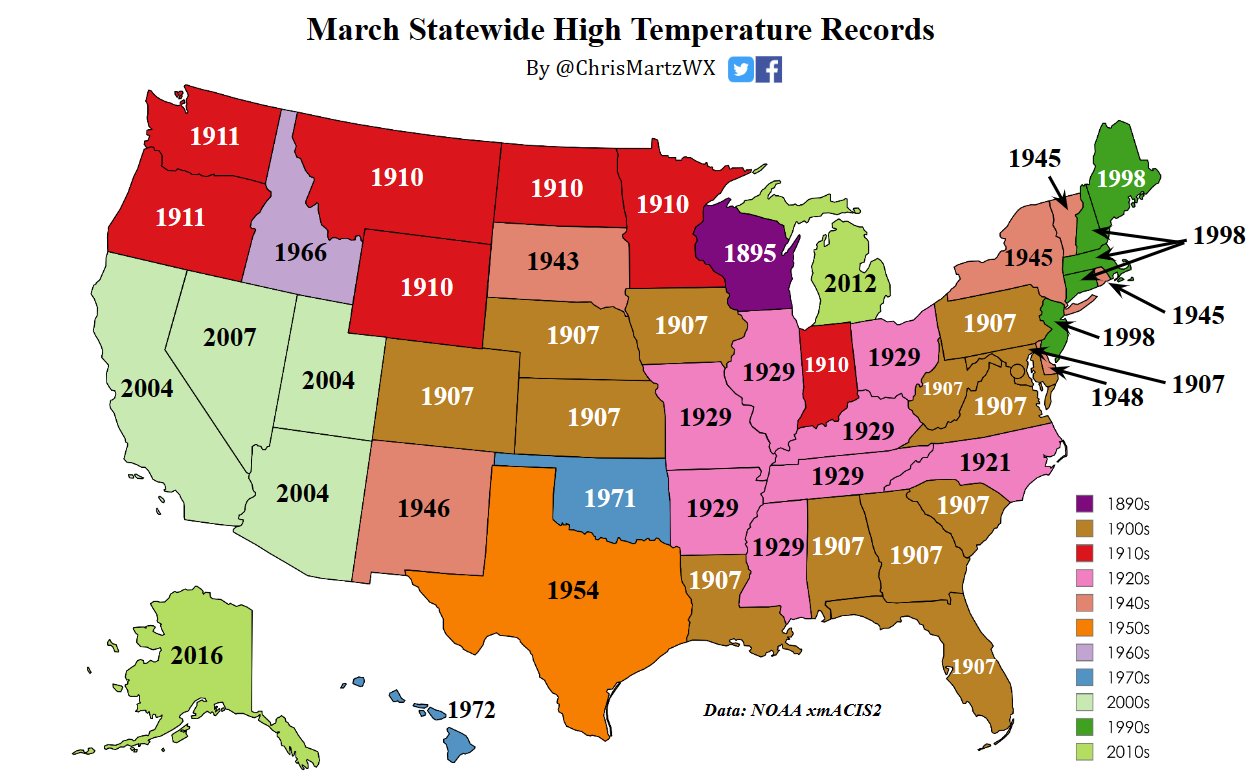
Below is a great list (Thanks Chris Martz) of all-time US by State high temperature records (of course before adjustments NOAA adjustments etc.).
Per Chris "35 states set their “all-time” March monthly record high temperatures prior to 1955. Thirteen states set theirs in 1907 alone, the most in a single year and a single decade. Eight states set their March records in the 1920s, seven of which were in 1929. I ran the numbers by hand from NOAA's database on xmACIS2 and have been consulting with just about every state climatologist to confirm that these are in fact legitimate, as NOAA NCEI only lists records set for all months, not individual months."

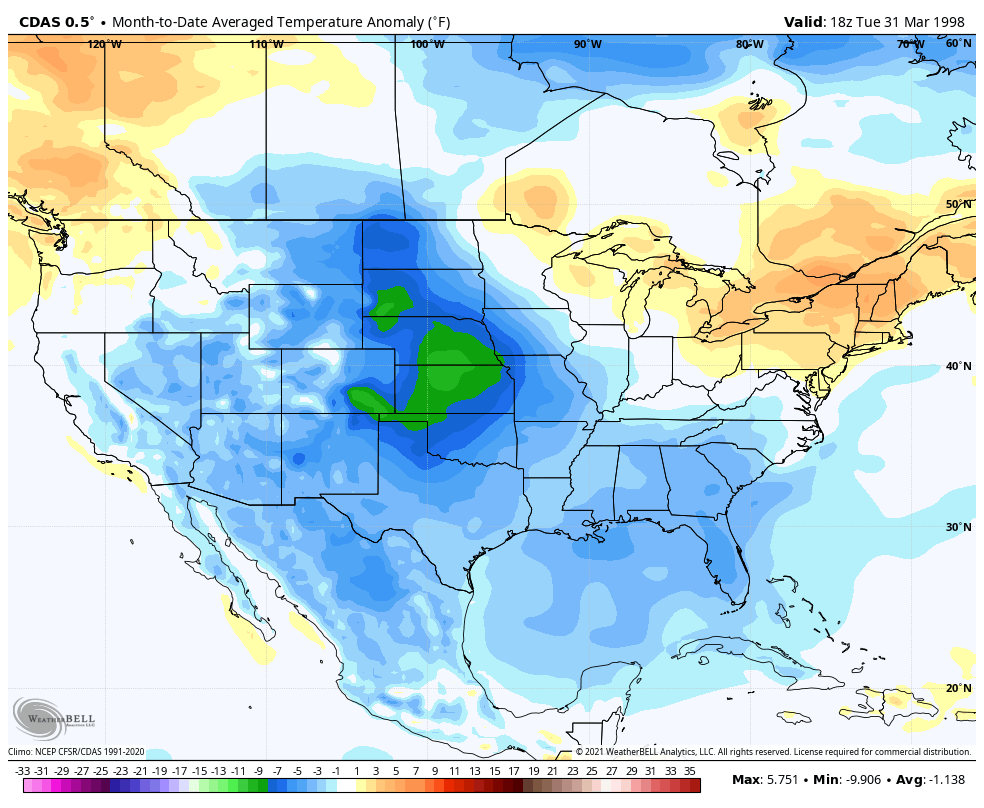
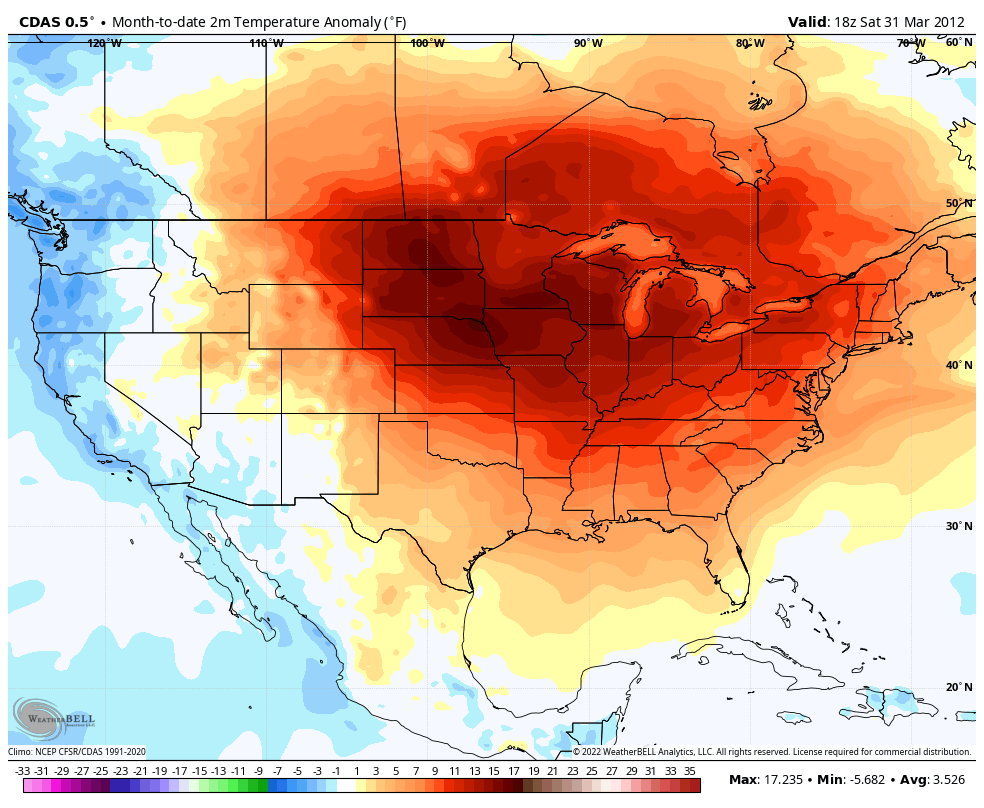
It looks like this is referring to daily temperature records for one location, which feels way less statistically significant than a 31 day temperature average. That stripe of 1998 on the East coast might've been hit on a particularly warm day, but the month on a whole is no comparison to a March like 2012. I feel like that is worth mentioning in your post.

-
1
-
1
-
-
Crazy how the late February HECS loading pattern very quickly became the 2025-2026 winter loading pattern instead
-
Moderate (non-accumulating) snow atm. 2/24 storm confirmed

-
3 minutes ago, StormyClearweather said:
Ahem

Georgetown snow shield working overtime
-
 2
2
-
-
19 hours ago, bdgwx said:
Yes. Solar output is correlated with warming/cooling of the climate system. The modulation is at most 0.4 W/m2 of radiative force from trough to peak. To put that into perspective the Earth Energy Imbalance (EEI) is currently around +1.9 W/m2. So this uptick in solar activity accounts for at most 10% of the energy uptake. Of course, once SC25 peaks and solar output drops in the next few years the solar effect will turn negative. The rate at which the climate takes excess energy will decline a bit as a result, but the EEI still going to be significantly positive meaning that the planet will continue to warm.
Oh. What about the other 90%? Where does that come from?
-
51 minutes ago, Ji said:

That’s the one signal that hasn’t wavered. Been on the guidance since the Mesopotamian model was the go-to.
-
2
-
-
6 hours ago, wishcast_hater said:
He attributes all of this to sunspot activity or solar activity which makes far more sense because it is the main driver of weather.
Oh, that is definitely interesting. Has sunspot activity gone up along with the recent warming, or is it just a temporary blip unrelated?
-
2 hours ago, wishcast_hater said:
For those who have an open mind… (because real “science” is supposed to be open to all possibilities)
.Hello, I watched this video and believe I got the key points, but I was wondering, what were the key takeaways/points/arguments from the video, for you? Just making sure I'm on the same page with what you and dseagull gathered from this video. Thanks!
-
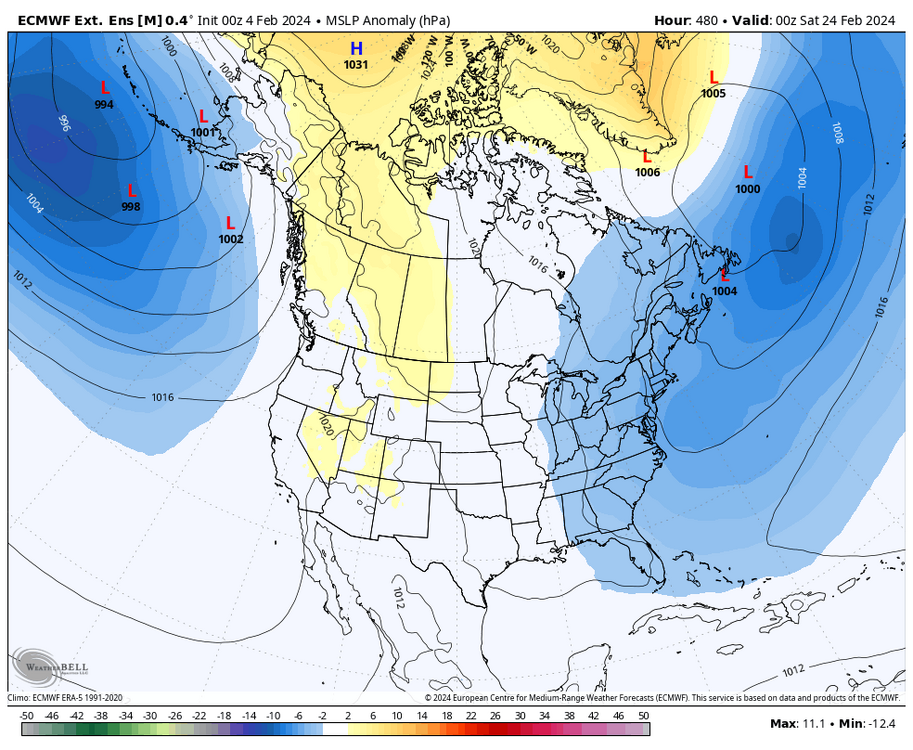
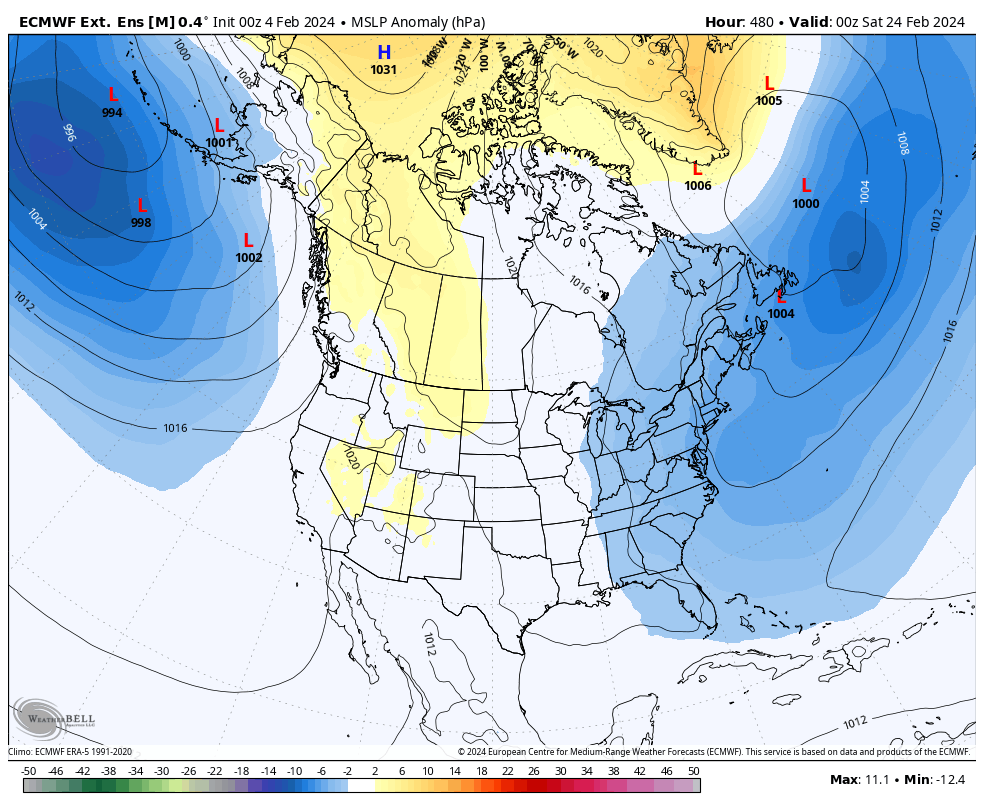
39 minutes ago, brooklynwx99 said:
my guess is that you get a vigorous wave coming onshore around the 20th, the Aleutian low retrogrades, spiking the PNA, and that's how you get clobbered. everything is in place there, TPV is perfectly elongated
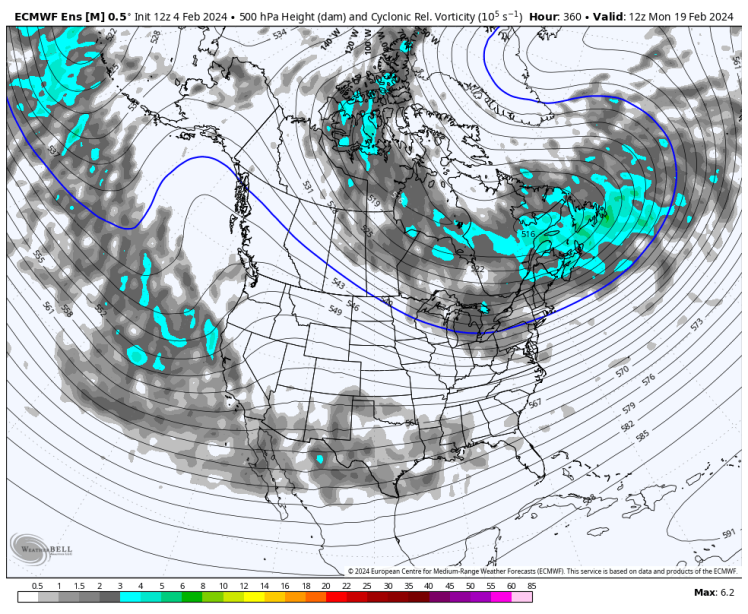
Weeklies from today are maintaining that potent storm signal centered at the 23rd/24th. From what I can tell, that signal has been there in some form on the weeklies since it was 30 or so days out.
-
8
-
-
11 minutes ago, stormtracker said:
lol, Euro slides it under us and we get fridge...surface progresses colder but it's gone by then. We're too far north!
probably connected.. fridge doing its magic
-
1
-
1
-
-
Low of 1F, up to 11 degrees now.
-
3
-
-
Euro is a snower for the 16th-17th
-
4
-
-
6 hours ago, donsutherland1 said:
November finished with a mean temperature of 46.7° (1.2° below normal) in New York City. November 2023 was the coldest such month in November since 2021.
Tomorrow will be another mild day. Showers could affect the region late in the day or on Saturday.
The ENSO Region 1+2 anomaly was +2.0°C and the Region 3.4 anomaly was +2.1°C for the week centered around November 22. For the past six weeks, the ENSO Region 1+2 anomaly has averaged +2.22°C and the ENSO Region 3.4 anomaly has averaged +1.80°C. A basinwide El Niño event is ongoing. El Niño conditions will likely continue to strengthen into the early winter.
Should the ENSO Region 1+2 and 3.4 anomalies remain at or above +1.00°C in December, which is likely, and should the PDO remain negative, there is a single past case (1950-2022) with similar ENSO/PDO conditions: December 1972.
The SOI was +6.30 today.
The preliminary Arctic Oscillation (AO) was -3.350 today. Only four prior November cases (1950-2022) saw the AO fall to -3.000 or below during the last week of November: 1985, 2002, 2010, and 2018.
On November 28 the MJO was in Phase 3 at an amplitude of 0.457 (RMM). The November 27-adjusted amplitude was 0.555 (RMM).
Looks like @qg_omegawas only a bit off.
On 11/9/2023 at 6:48 AM, qg_omega said:Based on sensitivity analysis applied to the latest guidance, there is an implied 52% probability that New York City will have a cooler than normal November (1991-2020 normal). November will likely finish with a mean temperature near 47.8° (0.2° below normal).
Time will tell but I have a hard time seeing how November doesn’t finish at least 1 degree above normal if not more
-
2
-
-
39 minutes ago, qg_omega said:

How're you feeling about this prediction so far?
On 11/9/2023 at 6:48 AM, qg_omega said:Time will tell but I have a hard time seeing how November doesn’t finish at least 1 degree above normal if not more
Looks like Central Park is running 2.0F below normal through the 15th. According to the 0z EPS it looks like they'll be running around normal for the next 7 days and then 3-5F below normal for the following 7 days to close out the month.
-
11 minutes ago, CoastalWx said:
Reread what I said for temps by the end of the month.
I have, and from this quote
2 hours ago, CoastalWx said:It's a notable cold snap for them and kind of goes to the point that while the NE was warm this month, the south was cooler relative to normal.
I read this quote and gathered that you were saying the South has been cooler than their given normal for the month of October, not relative to New England or any other thing. I responded saying that hasn't been the case, and if that response had no application here then I'd like to hear what normal you were referring too. Because yeah in reference to NNE every part of the US has been substantially cooler this month, but if that's what you were trying to focus on then I think this whole discussion of "relative terms" was confusing to follow from the onset. I'd like to hear which normal you were focusing on.
-
35 minutes ago, Pixee said:
THAT'S RIGHT! Besides we're supposed to be "Snowball Earth" right now according to 60s scientists. Why isn't earth a block of ice?
Because that idea never had consensus in the 60s and 70s. It's a common fallacy, published research from back then predicted the modern day warming rather accurately, surprisingly so for being half a century ago.
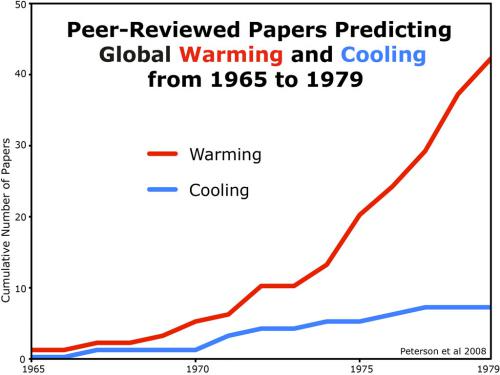
In any case the thought process of "science was wrong back then so it shouldn't be taken with any credence now" is one made in bad faith. Scientific inquiry is not infallible, but the best working theories or lines of research cannot be disregarded simply because some guy was wrong 500 years ago. Even your 60s argument has no weight when comparing to the current working theory of current global temperature rise. The 60s idea never had any great backing or predictive capabilities. The best understood theory of current global temp rise has both of those things.
-
8
-
-
44 minutes ago, CoastalWx said:
It's like Bizarro-World in here.
As long as it's not a world where the defined blue area on that map is perceived to take up more area than the red, then all is well.
-
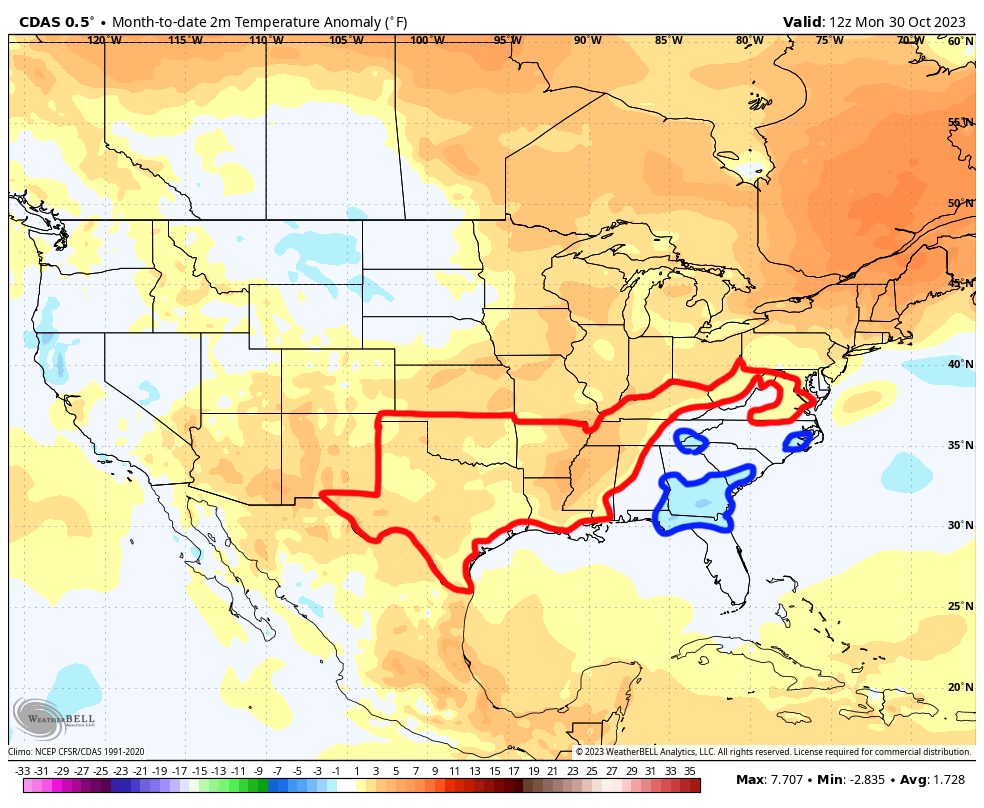
53 minutes ago, CoastalWx said:
based on their average temps.
Here's a revised edit of the above WxBell map, with AN anomalies in the South boxed in red, and BN anomalies boxed in blue.

Which takes up more area in the Southern states, the AN anomalies, or the BN anomalies?
-
 1
1
-
-
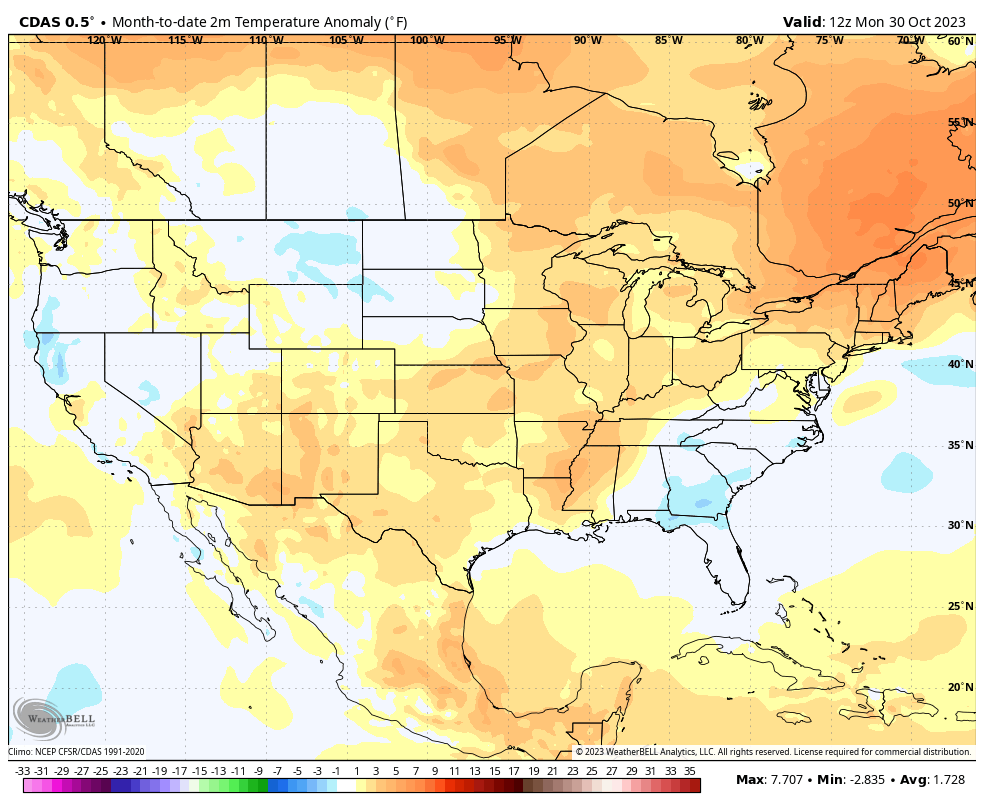
12 minutes ago, CoastalWx said:
Yes as a whole for the month the south will be a lot cooler, especially the SE.
Cooler than the Northeast or the 30yr average? That area being cooler relative to NE's record warmth is a no brainer, but the map above indicates that the South as a whole will finish above the 1991-2020 average. The small nugget of BN temps in the Southeast doesn't offset the anomalies found to the West.
-
3 minutes ago, CoastalWx said:
It's a notable cold snap for them and kind of goes to the point that while the NE was warm this month, the south was cooler relative to normal.
On the whole the South has skewed AN so far this month. Maybe the next 36 hours will tip the scales a bit to the side of BN temps, but not by much.

-
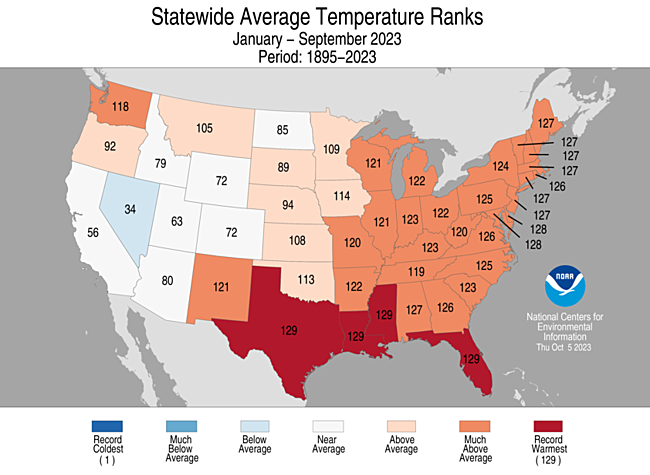
3 hours ago, MaineJayhawk said:
I'm looking forward to @TheClimateChanger's report on this TX cold snap
That cold snap probably won't do much to change the fact that Texas (along with all but one Gulf Coast state) are on pace to see their warmest year in 129 years of record keeping. The shifting of goalposts is interesting, we're so used to record warmth that one cold snap is seen as an inexplicable event that somehow offsets all of the other positive anomalies.
-
8 minutes ago, the_other_guy said:
well, you guys are a little crazy on this forum with this 4 days of 70s. Never mind that it’s freezing out right now.
I think this forum becomes an echo chamber sometimes were narratives get amplified to extremes
Looks like for some areas in Vermont, they are not freezing, at a point in the season where it is becoming exceedingly uncommon for such an event to not have occurred at least once already.
15 minutes ago, powderfreak said:The first sub-32F SFC prog at the MVL ASOS from the latest GFS run is October 31st.
That is absolutely insane.
I don’t think people understand how rare that is based on standard deviations from the period or record.
If we even entertain November 1 as a first freeze at a NNE radiational site, wow. Been a mild fall. This isn’t a troll post, just recognizing what is actually happening.
-
1
-

Occasional Thoughts on Climate Change
in Climate Change
Posted
It seems like that temperature dip was necessary for human life to come around and flourish in the first place. What's true in the present day is that humanity can't support itself in an ice-free world. 2 billion people rely on glaciers for drinking water, power, and agriculture.