

LibertyBell
-
Posts
30,108 -
Joined
Content Type
Profiles
Blogs
Forums
American Weather
Media Demo
Store
Gallery
Posts posted by LibertyBell
-
-
On 4/17/2024 at 2:46 PM, Typhoon Tip said:
This is very interesting
https://phys.org/news/2024-04-scientists-paradox-extreme-cold-events.html
I've mused a possible sci fi novel idea in the past where "Gaia," it turns out, has an an ethereal consciousness; it's just so vast it eludes what we think of as awareness - ... perhaps 'godlike'. And, it is well-aware of CC, more importantly, how to "cure" the disease.
I like the analogy of the Clean setting on an oven - you know... raise the temperature to kiln degrees and converts the organics to ash. The impetus here is of course to clean the disease causing agent. But that's kind of hard to do if the pathogen is aware of the temperature rise. Uh... humans are the intended ash to complete this metaphor.
By sending cold cloaks into the continents ... think of the frog in the pan experiment: plunk a frog into a pan of boiling water and it immediately jumps out ( or tries to...). But turn the heat up slowly and the frog, continuously adapting, will do so until it is cooked alive.
That's all tongue-in-cheek, but it's an eerie negative feedback loop whence the primary inducing differential CC agent only responds immediately to that which is directly perceivable through the five senses ... which is precisely needed, and is being offset.
uhm this is exactly what I write about
read
I conjecture on a new theory of everything; in my theory each dimension can be analoged to a primary color..... in our universe each spatial dimension would be equivalent to an additive primary color (RGB) with time as the background (Black) with a complementary spacetime which consisted of dimensions that analoged to the subtractive primary colors (CMY) with complementary time as the background (White) as one space expanded the other contracts and vice versa (because the arrow of time flows opposite to each other but forward within each), It's been peer reviewed and it seems there's some excitement over this as this would solve the dark matter / dark energy problem by unifying the strong nuclear force and gravity (the strong nuclear force is carried by gluons and color charge and analoging dimensions to primary colors is gravity's version of color charge) so now we have a strong force-gravity unification and an electroweak unification and we just need to combine those dualities. There are four layers to the omniverse, with universes of different dimensions in each layer (the number of dimensions in each layer bear a pythagorean relationship to the other layers and each universe has a parent superverse from whose parent black hole it was created. If you loop through the entire hierarchy of universes you end up back where you started, so the omniverse is not only cyclical time, but also in space. I guess I'll leave that for a sequel lol.
BTW if there are multiple timelines they would be created right after the big bang, by the force of inflation and be emergent diverging timelines along two dimensions of time (think cartesian coordinates) and if the cyclic model is correct and dark flow does reverse the expansion of space, the time lines would converge once again with a Big Bounce as the universe deflated (rinse and repeat.) The antiverse would have opposing cycles (because the arrow of time was opposite compared to ours) and if there was someway to construct some sort of device (a la star gate) to tap into the barrier which separates the two (consisting of light, which does not experience the passage of time) than both time and long distance space travel would become possible through the second temporal dimension (which keeps each timeline intact)...... according to Einstein the past, present and future all coexist and it is we who move through them, so theoretically this should be possible. He also stated that the universe (or omniverse on a larger scale) created us in order to understand itself better, forming the framework for a cosmic collective mind which encompasses not only humans, but animals, plants, alien life, even whole planets (Gaia Theory, which has been proven multiple times) and even stars and galaxies, the only difference is the density of the level of consciousness, although planets (for example) are much larger than any single life form, their density of consciousness is much less, with their memories (fossil record) spread out over a much larger area, so any one spot (on our scale) is seemingly lifeless. But it's not. The planet consists of a complicated series of checks and balances and delicate interplay between different parts that can and should be considered alive.
also read:
https://nautil.us/the-strange-similarity-of-neuron-and-galaxy-networks-236709/
-
 1
1
-
-
1 hour ago, coastalplainsnowman said:
I figure this is okay to post here in banter? I assume you have seen this tornado footage from Nebraska? Holy Moses.
Wow 30 tornadoes and counting including some terrifyingly large wedge tornadoes crossing roads!
-
1 hour ago, SACRUS said:
Records:
Highs:
EWR: 93 (2009)
NYC: 92 (2009)
LGA: 91 (2009)
JFK: 86 (2009)
Lows:
EWR: 34 (1934)
NYC: 31 (1919)
LGA: 37 (1972)
JFK: 37 (1967)
Historical:1834 - Killer frosts were reported in the Deep South. The frost was quite severe around Huntsville AL, and highlighted a backward spring in the South that year. (David Ludlum)
1884: Tornadoes were hard to capture on old cameras with their hard to use glass plate negatives. The first recorded photograph of a tornado was taken on this date by A.A. Adams near Garnett, Kansas.
1978 - An unusually strong occluded front swept out of the Gulf of Alaska and produced the first April thunderstorm of record at Fairbanks. Pea size hail fell northeast of Fairbanks from thunderstorms whose tops were less than 8000 feet. (The Weather Channel)
1984 - Severe thunderstorms associated with an intense cyclone spawned a total of forty-seven tornadoes in two days from Louisiana to Upper Michigan. The tornadoes killed 16 persons and injured 259 others. (Storm Data)
1986: The Chernobyl nuclear power station in Kiev Ukraine suffered a massive explosion. The radioactive cloud of particles and gas carried westward and northwestward, contaminating large areas of Europe in the following week.
1987 - Twenty-two cities in the central and western U.S. reported new record high temperatures for the date. The afternoon high of 83 degrees at Astoria OR smashed their previous record by 13 degrees. Sacramento CA hit 94 degrees. (The National Weather Summary)
1988 - While Rochester, MN, was blanketed with 13.7 inches of snow, establishing a single storm record for the month of April, Minneapolis MN, just 90 miles away, got only rain. (Storm Data) (The National Weather Summary)
1989 - Thirty-three cities in the central and southeastern U.S. reported record high temperatures for the date. Afternoon highs of 91 degrees at Evansville IN and Nashville TN equalled April records. Thunderstorms produced severe weather from Iowa to Kentucky, with more than ninety reports of large hail and damaging winds. Thunderstorm winds gusted to 90 mph at Berwick IA. (The National Weather Summary) (Storm Data)
1990 - Twenty-nine cities from the Carolinas to the Great Lakes Region and western New England reported record high temperatures for the date as readings soared into the 80s and lower 90s. Record high temperatures included 95 degrees at Baltimore MD and 92 degrees at Allentown PA. The record high of 89 degrees at Alpena MI was the third out of six straight record highs for that location, and smashed their previous record for the date by ten degrees. (The National Weather Summary)
1991 - Severe thunderstorms in the central U.S. spawned fifty-five tornadoes from northeastern Texas to Iowa and eastern Nebraska killing twenty-one persons. Early evening thunderstorms over south central Kansas spawned a violent (F-5) tornado whiched traveled 45 miles from southwest of Wichita to north of El Dorado. It killed seventeen persons, including thirteen at the Golden Spur Mobile Home Park in Andover. The tornado also caused 62 million dollars damage to McConnell Air Force Base as it crossed the south side of Wichita. (National Weather Summary
1991:During a severe thunderstorm event, large hail fell over parts of Brown, Spink, Hand, and Buffalo Counties. Both Brown and Hand Counties received hail up to 1.75 inches in diameter.
2003 - Twenty inches of snow falls in California's Sierra Nevada Mountains. Alpine Meadows ski resort just north of Lake Tahoe reports more than 100 inches and Kirkwood south of Tahoe reports 112 inches.
Didn't realize this was also the anniversary of Chernobyl-- a day that will forever live in infamy!
-
1 hour ago, SACRUS said:
Records:
Highs:
EWR: 93 (2009)
NYC: 92 (2009)
LGA: 91 (2009)
JFK: 86 (2009)
Lows:
EWR: 34 (1934)
NYC: 31 (1919)
LGA: 37 (1972)
JFK: 37 (1967)
Historical:1834 - Killer frosts were reported in the Deep South. The frost was quite severe around Huntsville AL, and highlighted a backward spring in the South that year. (David Ludlum)
1884: Tornadoes were hard to capture on old cameras with their hard to use glass plate negatives. The first recorded photograph of a tornado was taken on this date by A.A. Adams near Garnett, Kansas.
1978 - An unusually strong occluded front swept out of the Gulf of Alaska and produced the first April thunderstorm of record at Fairbanks. Pea size hail fell northeast of Fairbanks from thunderstorms whose tops were less than 8000 feet. (The Weather Channel)
1984 - Severe thunderstorms associated with an intense cyclone spawned a total of forty-seven tornadoes in two days from Louisiana to Upper Michigan. The tornadoes killed 16 persons and injured 259 others. (Storm Data)
1986: The Chernobyl nuclear power station in Kiev Ukraine suffered a massive explosion. The radioactive cloud of particles and gas carried westward and northwestward, contaminating large areas of Europe in the following week.
1987 - Twenty-two cities in the central and western U.S. reported new record high temperatures for the date. The afternoon high of 83 degrees at Astoria OR smashed their previous record by 13 degrees. Sacramento CA hit 94 degrees. (The National Weather Summary)
1988 - While Rochester, MN, was blanketed with 13.7 inches of snow, establishing a single storm record for the month of April, Minneapolis MN, just 90 miles away, got only rain. (Storm Data) (The National Weather Summary)
1989 - Thirty-three cities in the central and southeastern U.S. reported record high temperatures for the date. Afternoon highs of 91 degrees at Evansville IN and Nashville TN equalled April records. Thunderstorms produced severe weather from Iowa to Kentucky, with more than ninety reports of large hail and damaging winds. Thunderstorm winds gusted to 90 mph at Berwick IA. (The National Weather Summary) (Storm Data)
1990 - Twenty-nine cities from the Carolinas to the Great Lakes Region and western New England reported record high temperatures for the date as readings soared into the 80s and lower 90s. Record high temperatures included 95 degrees at Baltimore MD and 92 degrees at Allentown PA. The record high of 89 degrees at Alpena MI was the third out of six straight record highs for that location, and smashed their previous record for the date by ten degrees. (The National Weather Summary)
1991 - Severe thunderstorms in the central U.S. spawned fifty-five tornadoes from northeastern Texas to Iowa and eastern Nebraska killing twenty-one persons. Early evening thunderstorms over south central Kansas spawned a violent (F-5) tornado whiched traveled 45 miles from southwest of Wichita to north of El Dorado. It killed seventeen persons, including thirteen at the Golden Spur Mobile Home Park in Andover. The tornado also caused 62 million dollars damage to McConnell Air Force Base as it crossed the south side of Wichita. (National Weather Summary
1991:During a severe thunderstorm event, large hail fell over parts of Brown, Spink, Hand, and Buffalo Counties. Both Brown and Hand Counties received hail up to 1.75 inches in diameter.
2003 - Twenty inches of snow falls in California's Sierra Nevada Mountains. Alpine Meadows ski resort just north of Lake Tahoe reports more than 100 inches and Kirkwood south of Tahoe reports 112 inches.
wow 2009 had a very cool summer, this day in April that year may have been warmer than most of the days that summer.
-
1 minute ago, bluewave said:
I believe that 108° In Mineola during 2010 was probably the highest temperature on record for Long Island. But the site shut down in 2011. Ed was the president of the Long Island Weather Observers. The site was in operation from 1938 to 2011. His observations were featured every evening on News 12 for years.
In Mineola, temperatures hit a low of 6 degrees on Dec. 23, according to Ed Lynt, president of the Long Island Weather Observers, a volunteer organizationTime Series Summary for MINEOLA, NY - Jan through Dec
Click column heading to sort ascending, click again to sort descending.RankYearHighest Max TemperatureMissing Count1 2010 108 0 2 2001 105 32 3 1999 103 10 - 1966 103 0 5 1988 102 50 - 1975 102 1 - 1948 102 1 8 2002 101 0 - 1973 101 0 - 1968 101 0 - 1952 101 0 12 2006 100 1 - 1993 100 8 - 1991 100 0 - 1957 100 12 - 1955 100 3 We're really going to miss him -- I wish we had that mesonet set up that the city does so we could keep track of local temperatures
-
 2
2
-
-
24 minutes ago, bluewave said:
Usually somewhere between JFK and LGA eastward along the LIE out to near Commack just north and west of where the sea breeze front sets up.
hey, maybe we can use this to define new record highs?
does Nassau county have something like this for the area around Mineola?
-
2 minutes ago, forkyfork said:
those fronts can give us a small boost from compressional heating
Is this how it's often hottest just after a cold front passes?
-
13 minutes ago, Brian5671 said:
Had a solid frost here on everything this AM. Hopefully that's it for the season.
Maybe one last one tonight
-
6 minutes ago, bluewave said:
The winter was dominated by the record polar vortex over the Arctic which got driven south by the strong -EPO block in early May.
we don't snow anymore even in the winter without these strong EPO blocks.
-
13 minutes ago, bluewave said:
My guess is that the much stronger spring blocking at times in recent years has been compensating to some extent. The hard freeze last May over the interior occurred with one of the strongest -EPO +PNA blocks on record for that time of year. But the stronger spring blocking at times can’t affect the earlier arrival of spring. So we get these overlaps leading to damaging freezes in susceptible arras.


what caused the crazy May 9, 2020 arctic shot, Chris?
was it the strongest arctic shot in May since May 9, 1977 or maybe even stronger?
-
11 minutes ago, bluewave said:
My guess is that the much stronger spring blocking at times in recent years has been compensating to some extent. The hard freeze last May over the interior occurred with one of the strongest -EPO +PNA blocks on record for that time of year. But the stronger spring blocking at times can’t affect the earlier arrival of spring. So we get these overlaps leading to damaging freezes in susceptible arras.
absolutely-- we don't exist in a vacuum. The planet can to some extent self regulate and nature tries to balance out the human caused changes by adjusting in return.
-
1 hour ago, TJW014 said:
Starting off at 24. Bird bath is frozen.
Same low as Westhampton and a record there
-
15 minutes ago, bluewave said:
Figures the first record low of the year down to 33° at Islip would wait until late April.
https://www.weather.gov/wrh/timeseries?site=kisp
Islip
Low 33
Gabreski also had a record low, 24 I think?
-
3 hours ago, MJO812 said:
43 here
it got down into the upper 30s last night!
-
11 hours ago, GaWx said:
The major effects of CC to this point haven’t all been bad on a global basis. For example, fewer deaths from temperature extremes resulting from GW due to cold being a much bigger killer than heat. This is largely due to many more hours spent in the cold danger zone than within the heat danger zone in a large majority of locations:
“For the majority of the time, most cities have colder temperatures than their local optimum temperature, or the temperature that minimizes the death rate in that area.
“It has been estimated that about 5.1 million excess deaths per year are associated with non-optimal temperatures. Of those, 4.6 million are associated with colder than optimum temperatures, and 0.5 million are associated with hotter than optimum temperatures.”
“Deaths associated with non-optimal temperatures have been decreasing over time as it has gotten warmer partly due to a reduction in cold deaths. It has been estimated that warming from 2000 to 2019 has resulted in a net decline in excess deaths globally (a larger decrease in cold deaths than an increase in heat deaths).”
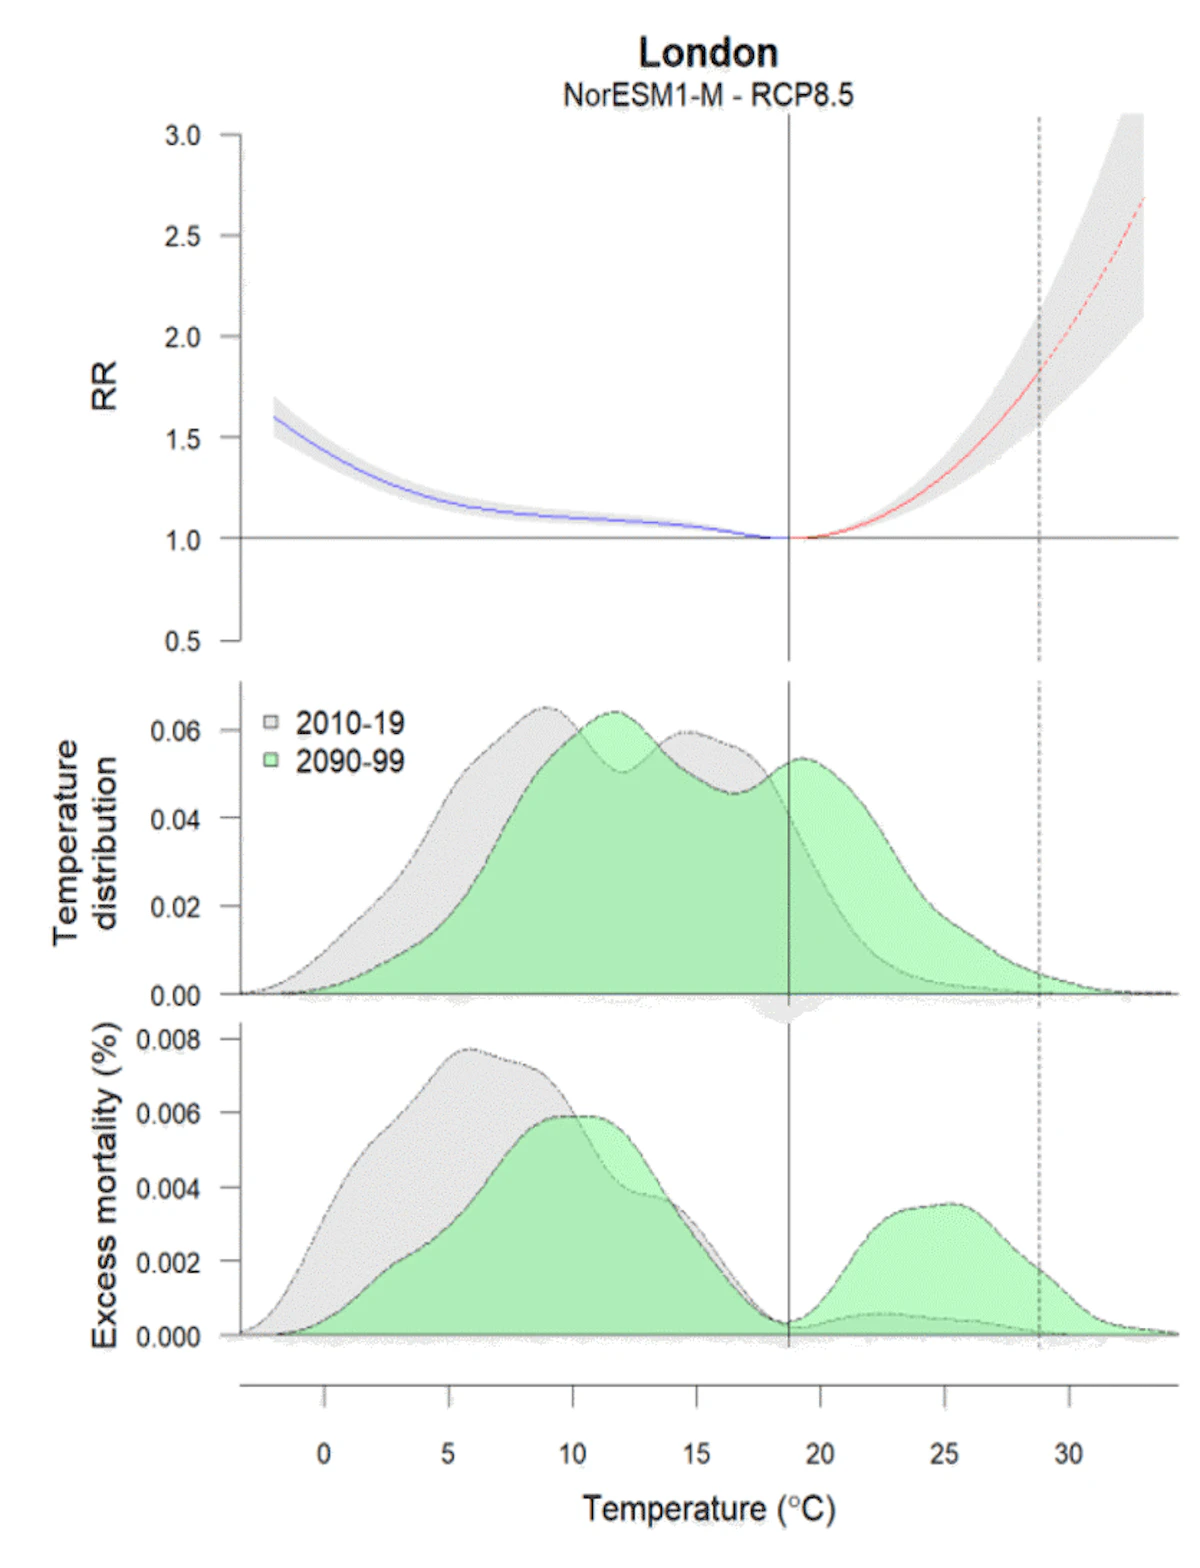
Whereas deaths from temperature extremes have decreased through 2019 per this study, the same study says that there’s much uncertainty looking well out into the future. A good number of models suggest that after deaths continue to drop in the near future, they will start to increase late this century. This is because heat related deaths are being projected by these models to then start increasing more rapidly than the reduction of cold related deaths. From the same study, here’s Figure 10, which shows London as an example:
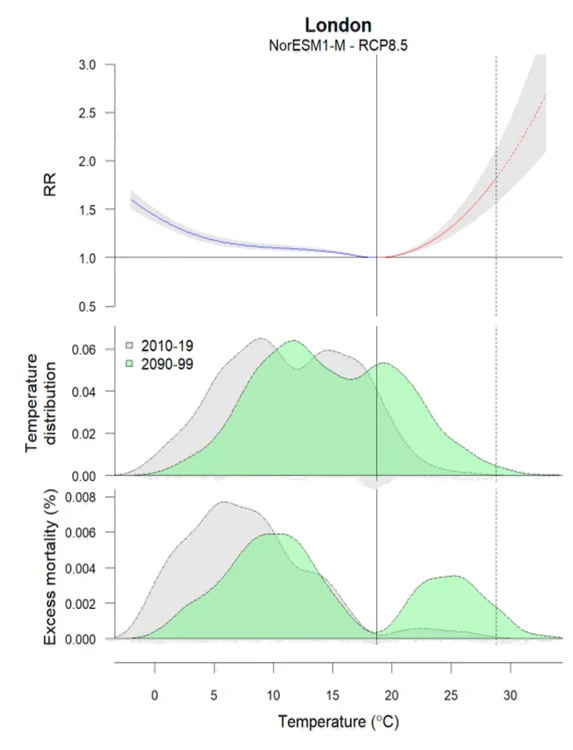
Of course due to that being so far out in the future, there’s lots of uncertainty since increased acclimation/air conditioning could negate a good portion of the projected increase in heat related deaths.There's other factors associated with this-- for example excessive flooding, more forest fires and higher air pollution.
Add them all up together and you have billion dollar disaster that need to be paid for by lowlifes like Greenskeeper and his kind who don't understand science and the fossil fuel cartels trash like him worships.
-
1 hour ago, bluewave said:
You are missing the point that I made. The first 70° and 80° degree days of the season are becoming earlier at a faster rate than the last freeze is becoming earlier. So this creates more damaging freeze potential in the spring due to the increasing overlap. This is why the most damaging interior Northeast freeze on record for the spring occurred in May 2023. This works for many stations across the Northeast where the spring bloom is becoming earlier faster than the last freeze is becoming earlier. Some spots have a 3 week to one month faster start to spring while the last freeze is still within a week of where it was during the 1951-1980 climate normals period. Now if you go back to the late 1800s off course the last freeze was later. But that really isn’t relevant to the current day agricultural interests which have been sustaining spring freeze losses. We have also seen this is the Southeast with earlier starts to spring in February only to be subject to damaging freezes in March.
This has been getting more attention from the literature in Europe recently but the same thing happened in the Northeast last May.
In early April 2021 several days of severe frost affected central Europe following an anomalously warm March. This led to very severe damages in grapevine and fruit trees, particularly in France, where young leaves had already unfolded in the warm early spring. Using published peer-reviewed methods we analysed how human-induced climate change affected the temperatures as extreme as observed in spring 2021 over central France, where many vineyards are located. We found that although climate change made the temperatures of the observed event less cold than they would have been without the burning of fossil fuels over the last centuries, the fact that climate change has also led to an earlier start of the growing season means that frost damage in young leaves has become more likely due to human-induced climate change.SHELBURNE, Vt. (AP) — Vineyards and apple orchards across the Northeast are still gauging damage from a late-season frost in May that wiped out a third to most of the crop for some growers who say it’s the worst frost damage they have ever seen.
Some states are seeking federal disaster declarations, which would make low-interest loans and other programs available to affected growers, while agriculture officials across the region are contemplating together asking the U.S. Department of Agriculture for direct aid to farmers.
In southern Vermont, Scott Farm Orchard lost up to 90% of its apple crop when the temperature dipped to 25 degrees Fahrenheit (minus 3 degrees Celsius) for five hours on May 18. At the northern end of the state, Shelburne Vineyards in Shelburne, Vermont, lost about 50% of its grape crop, which is potentially a half-million dollar revenue loss, according to head wine grower and vineyard manager Ethan Joseph.
To make up for lost production, Shelburne Vineyards plans to buy additional grapes at a time when its overall costs this year will be higher due to the frost, Joseph told The Associated Press. The vineyard has wine in stock to sell and it's not off the table that it could raise prices, he said.
“We’ve never seen this kind of freeze event, certainly in the history of the vineyard,” Joseph said. “I’ve been here for 16 years. We’ve never seen anything like it.”
The widespread frost hit the large wine-producing region of the Finger Lakes in upstate New York where it's estimated about half of the grape crop was lost regionwide, according to Kyle Anne Pallischeck, executive director of the Finger Lakes Wine Alliance. Depending on their location, some vineyards were hit hard and others had little to no damage. Vineyard owners say it's still too early to tell what the final financial impact will be.
“I’ve been in this almost 40 years, doing it full-time and this is by far and away the worst,” said David Stamp, vineyard manager of Lakewood Vineyards, in Watkins Glen, New York, of the frost damage. He estimated their total crop loss at about 30% to 40% though it's tough to tell since the damage is scattered throughout the vineyards. “I mean, if you put all the years together that we’ve had any damage it’s not even a quarter of what this is,” he said.
The losses will mean shorter supplies of certain wines next year and higher prices for apples this year. Some vineyards and orchards are having to reduce staff.
Keuka Lake Vineyards, in Hammondsport, New York, estimates it lost between 50% and 65% of its crop, said Mel Goldman, owner and vineyard manager. “We lost a lot,” Goldman said, adding it will take a few weeks before a final verdict as the vines produce secondary buds and shoots that could bear.
The last freeze at Newark hasn’t changed since 1950 but the first 70° and 80° days of the season are arriving much earlier.


The important thing to remember about climate change, as you stated, is more extremes. That means both extremes in temperature as well as precipitation.
The motto should be to expect the unexpected.
-
1
-
-
1 hour ago, MJO812 said:
NYC never radiates well

They will once we get rid of this polluted concrete. NYC has plans to make the city 30% green by 2030.
-
1
-
-
19 minutes ago, bluewave said:
The main challenge for the area is that the last freeze date is similar to 1951-1980 but first 70s and 80s of spring are arriving much earlier. So this has lead to the damaging spring freezes across the northeast especially in the interior. The historic damaging freeze last May to our north matched the pattern of early season warmth causing blooms which were followed by a damaging hard freeze. We can understand that as the climate continues to warm spring will arrive earlier with the quicker blooms. But the last freeze date has not changed as much and needs some further investigation. My guess is that the much stronger spring blocking from the EPO to NAO regions recently is allowing the last freeze date to remain more constant relative to earlier eras.
I will use Newark as an example of this pattern that shows up to varying degrees across the region.
Newark
2010-2023
Last 32°…. 04-04…last 30s…04-21
First 70°…..03-07…first 80°….03-31
1951-1980
Last 32°…..04-04…..last 30s…04-22
First 70°.….03-26….first 80°…..04-22
But why is last freeze for Central Park being listed as March 30th? When I was growing up it was listed as April 10th....
-
20 minutes ago, donsutherland1 said:
JFK had 1.5" on April 19, 1983. The low temperature was 35°.
wow I wonder if that was the warmest low temperature at JFK at which 1" of snow has fallen?
-
15 minutes ago, SACRUS said:
LGA : 4/17 : 32 (1980)
JFK: 4/16 : 32 (2014)Thats right we had a small accumulation of snow on 4/16/14!
I'm shocked it wasn't either 4/19 or 4/20 in 1983.... didn't JFK have about 2 inches of snow on that very late date? Tony, can you please check 4/19-4/20 in 1983 and see what the temperature was when it was snowing on those days? Thanks!
-
17 minutes ago, Dark Star said:
Am Weather sounds familiar, but can't remember a thing about it? Comcast in Union County NJ removed the full time weather/radar about 10 years ago. Maybe with everyone owning a smart phone, it was no longer really necessary?
10 minutes ago, IrishRob17 said:Is that what is was called? Was that on in the early 80s too? I remember watching some early morning weather show not on a major network. My first distinct memories of this are from April 1982.
18 minutes ago, Dark Star said:Am Weather sounds familiar, but can't remember a thing about it? Comcast in Union County NJ removed the full time weather/radar about 10 years ago. Maybe with everyone owning a smart phone, it was no longer really necessary?
Found it!
It was on until 1995-- ended just before the historic 1995-96 snowfall season (but at least it was here for 1993-94 when I remember watching it almost every morning!)
https://en.wikipedia.org/wiki/A.M._Weather
A.M. Weather[1] was an American weather news program that ran from October 30, 1978 to February 3, 1995. and was broadcast on PBS member stations throughout the United States. The 15-minute daily program, which aired fifteen minutes before or after the hour (depending on the station's scheduling of the program) and was produced by Maryland Public Television (MPT, or before 1984 the Maryland Center for Public Broadcasting), featured detailed forecasts presented by meteorologists from the National Oceanic and Atmospheric Administration (NOAA).
While many other media outlets embraced computer weather maps and graphics in the 1980s for weather forecasting use, A.M. Weather held back on fully embracing computer graphics until 1991, although the program did adapt to such graphics for satellite and radar maps in the late 1980s. The show's trademark yellow pointer was a mainstay of the program entire run.
Overview[edit]
The show's progression usually started with a satellite and radar segment, followed by the current conditions around the U.S. (vice versa in early years), then the forecast (especially in terms of temperatures and precipitation), followed by an aviation forecast (locations of MVFR and IFR, aircraft icing, turbulence and winds aloft) and ended (when necessary) with an inclement weather report, called "WeatherWatch" (the only time that the yellow pointer was not used).
The program aired its final edition on February 3, 1995; one of the reasons behind A.M. Weather's cancellation was that MPT wanted to expand on its morning business news enterprise with Bloomberg L.P.
Hosts included NOAA meteorologists Carl Weiss, Joan von Ahn and Wayne Winston, as well as H. Michael Mogil, Rich Warren, Dale Bryan and Barry Richwein. Other notable substitute hosts included: Regis Walter, Steve Zubrick (now the president of the National Weather Association), Gary Petti (a meteorologist with National Weather Service and National Environmental Satellite, Data, and Information Service (NESDIS), now retired), and George Lessens (now the chief meteorologist at WZZM in Grand Rapids, Michigan).
-
 1
1
-
-
7 minutes ago, IrishRob17 said:
Is that what is was called? Was that on in the early 80s too? I remember watching some early morning weather show not on a major network. My first distinct memories of this are from April 1982.
Yep, and they gave flight info and it's the first time I ever heard of these terms! It was only on for 15 minutes a day in the 80s and 90s at 7:15 AM but I loved watching it and I remember looking at their forecast snow maps-- they were usually first onto a potential threat before the local news stations got it.
-
1
-
-
8 minutes ago, SACRUS said:
Down to 42, now to 45 partly to mostly cloudy, clearing by early afternoon. Chilly today mainly in the 50s - low 60s. 30s or lower inland and upper 30s metro/coastal for what should be the coldest night till the fall. Warmer each day peaking Sun / Mon in the 80s to perhaps the first 90s in some spots. Step down next week to open May but still overall dry / warm till about the 4th. Then cooler beyond there for a period.
How much cooler are we talking about after May 4th, Tony? Not as cool as it is now or will be tonight?
-
6 minutes ago, SACRUS said:
Looks like April 23rd at EWR (1933), NYC May 6 (1891)
Thanks Tony, what about LGA and JFK?


Global Average Temperature 2024
in Climate Change
Posted
also note-- the trees in the Amazon regulate their own rainfall.