

janetjanet998
-
Posts
6,027 -
Joined
-
Last visited
Content Type
Profiles
Blogs
Forums
American Weather
Media Demo
Store
Gallery
Posts posted by janetjanet998
-
-
Here is the model the WH likes to use
https://covid19.healthdata.org/united-states-of-america
60,000 deaths .....down from 120K
the issue I see with it is that the slope may be too steep after the peak with decreasing deaths per day
plus no deaths after June 15th and only 60 total June 1-14
you can see this error in Italy ...which served as some of the original data input for the model
https://covid19.healthdata.org/italy
Italy projection for 4-9 was 384 actual 570 (plus almost 4000 new cases...)
-
Brutal. “The FDNY reports 241 New Yorkers dying at home Sunday — more than the number of confirmed #COVID19 deaths that occurred citywide that day. On Monday night, the city reported 266 new deaths, suggesting the possibility of a 40% undercount of #coronavirus-related deaths.”
-
 2
2
-
-
looks like 1237 new cases in IL
73 new deaths
-
Just now, Hoosier said:
Going to have a 2000 day, if not today then soon. Although these daily counts are pretty prone to error in multiple ways.
Last Tuesday also had a big spike after a decline/flat weekend .. 550ish to 900ish
weekend backlog processed on Monday?
Similar trend in Europe
-
Michigan with another bad day
1749 new cases
118 new deaths
US daily death tally now at 1522 and counting
-
41 minutes ago, Hoosier said:
An estimated additional 180 - 195 deaths per day occurring at home in New York City due to COVID-19 are not being counted in the official figures. "Early on in this crisis we were able to swab people who died at home, and thus got a coronavirus reading. But those days are long gone. We simply don't have the testing capacity for the large numbers dying at home. Now only those few who had a test confirmation *before* dying are marked as victims of coronavirus on their death certificate. This almost certainly means we are undercounting the total number of victims of this pandemic," said Mark Levine, Chair of New York City Council health committee [source]
[source]just like Italy and Spain
-
oh man
ISDH: 11 dead from COVID-19 at Madison County nursing home
https://www.wishtv.com/news/medical/isdh-11-dead-from-covid-19-at-madison-county-nursing-home/
-
The Illinois Department of Public Health announced Saturday there are 899 new cases of coronavirus disease (COVID-19) in Illinois, including 31 additional deaths.
-
1 hour ago, Baum said:
I'm not a blame guy in times of crisis. The Chinese Government thing is an altogether different animal which will have to play out.
although it was very obvious from the start for those paying attention China was lying....many casual observers likely thought it was just like SARS only a little worse...( I have been paying very close attention and started daily threads at another forum about this since late Jan)check out these numbersLast 3 days USA 88,631 cases 3329 deathsLast 3 months CHINA 81,639 cases 3326 deathsChina has over 4 times the population of the USA -
warm humid weather will stop the virus?
Corpses Lie For Days As Ecuador Struggles To Keep Up With COVID-19 Deaths
Ecuador is one of the smallest countries in South America but it is dealing with one of the region's worst outbreaks of COVID-19, with more than 3,100 identified infections and 120 deaths.
The epicenter of the country's outbreak is the Pacific port city of Guayaquil, where bodies are lying in the streets.
As a result, the bodies of people who have died in their homes due to COVID-19 and other illnesses often lie for days, wrapped in bed sheets and plastic and decomposing in the tropical heat as relatives watch over them.
-
2
-
-
10 minutes ago, snowstormcanuck said:
Spain saw a sizeable decrease in new cases and deaths today. It may be just another mirage but here's hoping.
not sure if that is the final total..they have several updates a day
-
SPRINGFIELD – The Illinois Department of Public Health (IDPH) today announced 1,209 new cases of coronavirus disease (COVID-19) in Illinois, including 53 additional deaths.
-
6 minutes ago, Chicago Storm said:
Deaths per 10k population (or something similar) would be better, but I’m too lazy to do all of that...thus the easy total count.
The total count is still important too though.
.I hear ya
if you have time a graph of IL, MI, OH would be cool for both cases and deaths since they are all pretty close in population and are in this sub forum
")
I saw one earlier on twitter and was going to post it here but can't find it....it shows the spike in IL and MO and the flat curve in OH
not sure what data set you are using but here is a good one ..it even has the total number of tests (state daily 4pm)
-
Just now, snowlover2 said:
I think it has to do with our Governor closing everything down really quick more than anything else. He's wasn't messing around with this.
perhaps....he was very aggressive despite the relatively low numbers
-
Just now, Chicago Storm said:
A graph I've been adding to, showing total fatalities in the hardest hit countries...
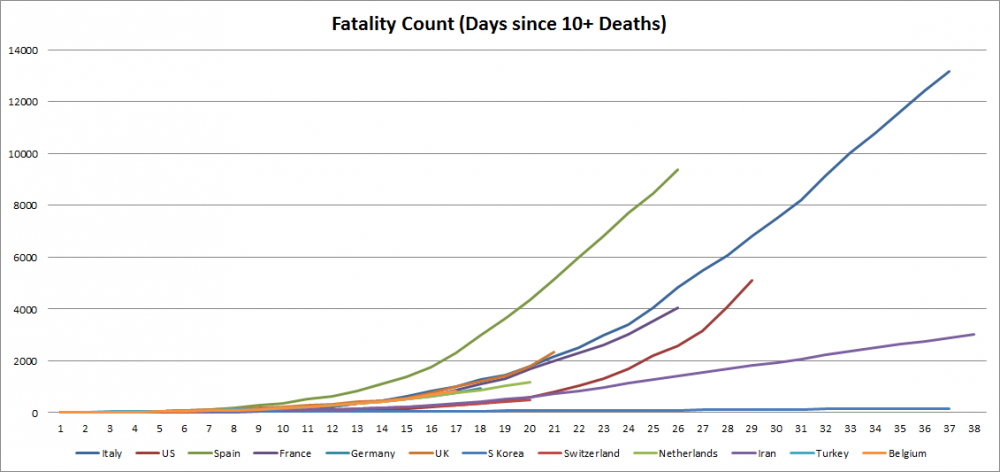
the Y-axis should be deaths per 10,000 people or something....98% of people are comparing raw numbers .....Italy has 1/5 the population of the USA
deaths per 1,000,000 people
Italy 218
Spain 201
UK 35
USA 15
-
so far OH and been doing better then IL and MI
it could be that there isn't one HUGE population center (ie Chicago. Detroit) and therefor OH is less dense in any urban center(has more metros rather then one huge one)
but OH also cancelled the primary and MI and IL did not
-
IL MAY not be in that bad of shape compared to some locations
488 new cases (19% increase)which is a drop from yesterday. ..yet almost 5000 more tests then then yesterday...(30% increase)
also about a 10% positive rate..much lower then NY
time will tell if this trend continues
-
 1
1
-
-
after the first wave this morning, latest RAP and HRRR have the training more south into AL..missing the TN valley
-
3 hours ago, Holston_River_Rambler said:
Obed Flooding at the confluence of the little Emory:
Judge Branch coming off of Frozen Head:
Highway 62 at the Emory River:

crest 33.88 at Oakdale
1) 42.30 ft on 03/23/1929
(2) 38.71 ft on 12/23/1990
(3) 38.70 ft on 05/28/1973
(4) 38.70 ft on 03/23/1991
(5) 34.20 ft on 12/30/1969
(6) 34.10 ft on 04/04/1977
(7) 33.00 ft on 02/13/1948-
 1
1
-
-
XCESSIVE RAINFALL DISCUSSION
NWS WEATHER PREDICTION CENTER COLLEGE PARK MD
1057 AM EST WED FEB 05 2020
DAY 1
VALID 16Z WED FEB 05 2020 - 12Z THU FEB 06 2020
...THERE IS A MODERATE RISK OF EXCESSIVE RAINFALL FROM FAR
NORTHWEST ALABAMA INTO EAST CENTRAL TO EASTERN TENNESSEE...
1600 UTC UPDATE
THE SLIGHT RISK AREA WAS UPGRADED TO MODERATE OVER FAR NORTHWEST
ALABAMA INTO EAST CENTRAL TO EASTERN TENNESSEE. THE 1200 UTC ARW
AND NMMB TRENDED HEAVIER FROM THIS AFTERNOON INTO THE EARLY HOURS
OF THURSDAY ACROSS THESE AREAS. THE LATEST HI RES GUIDANCE IS
SHOWING POTENTIAL FOR SEVERAL ROUNDS OF HEAVY RAINS MOVING
PARALLEL TO THE SOUTHWEST TO NORTHEAST ORIENTED FRONTAL BOUNDARY
THAT IS EXPECTED TO BE NEARLY STATIONARY INTO THE EARLY HOURS OF
THURSDAY FROM NORTHERN ALABAMA INTO EASTERN TENNESSEE. STREAM
FLOWS AS PER THE NATIONAL WATER MODEL ARE HIGH ACROSS THESE AREAS
WITH HI RES CONSENSUS FOR 2-4"+ OF RAIN ACROSS THESE AREAS THROUGH
THE END OF THIS FORECAST PERIOD 1200 UTC THURSDAY. IN AREAS OF
TRAINING...HOURLY TOTALS OF 1-1.5"+ POSSIBLE.
MESOSCALE PRECIPITATION DISCUSSION 0034
NWS WEATHER PREDICTION CENTER COLLEGE PARK MD
1201 PM EST WED FEB 05 2020
AREAS AFFECTED...NORTHEAST MS...NORTHERN AL...SOUTH-CENTRAL &
EASTERN TN...EXTREME NW GA...
CONCERNING...HEAVY RAINFALL...FLASH FLOODING POSSIBLE
VALID 051700Z - 052230Z
SUMMARY...SHOWER/THUNDERSTORM COVERAGE CURRENTLY TRAINING THROUGH
SATURATED GROUNDS MAY POSE SOME ISOLATED FLOODING CONCERNS, IN
ADVANCE OF MORE SIGNIFICANT CONVECTION LATER THIS AFTERNOON
INCREASING FLASH FLOODING RISK THROUGH THIS EVENING.
DISCUSSION...CURRENTLY A STATIONARY FRONT EXTENDS FROM SW VA
ACROSS CENTRAL TN INTO FAR NE MS, WHERE A WEAK SURFACE INFLECTION
IS BEGINNING TO LIFT NORTH-NORTHEAST. A SUBTLE SHORTWAVE OVER E
AR INTO W TN, WITHIN A SMALL WEDGE OF REDUCED UPPER-LEVEL
FLOW/INCREASED DIFFLUENCE IN CENTRAL TN, SUPPORTS THIS WAVE
LIFTING NORTH AND INCREASING SOUTHERLY FLOW ACROSS E MS/AL AND GA.
AS SUCH INCREASED FLUX MOISTURE CONVERGENCE HAS ENHANCED SHOWERS
FROM SE TN ACROSS N AL, SUPPORTING GREATER VERTICAL DEVELOPMENT
AND INCREASED CLOUD TOP COOLING NOTED IN GOES-E 10.3UM, WITH TOPS
COOLING BELOW -65C ACROSS NW AL AND SE TN ATTM. LOW TO MID-60S TDS
AND SOME WEAK FILTERED INSOLATION THROUGH BREAKS IN THE CLOUDS HAS
HELPED TO INCREASE INSTABILITY AVAILABLE FOR THIS AREA RECENTLY
WITH MLCAPES NOSING ABOVE 500 J/KG INTO N AL WITH GRADIENT UP/OVER
1000 J/KG BUILDING FROM THE SW. THIS IS IN COMBINATION OF
STEEPENING LAPSE RATES BUT ALSO INCREASED THETA-E AIR WITH TDS
EVEN UP TO 70 ACROSS CENTRAL MS ATTM.
CURRENTLY, THUNDERSTORMS ALONG THIS AXIS FROM NW AL INTO SE TN ARE
CAPABLE OF 1-1.25"/HR RATES WITH ISOLATED RATES UP TO 1.5"/HR WITH
THE STRONGEST CORES. MEAN STEERING FLOW SHOWS DEEP UNIDIRECTIONAL
FLOW TO SUPPORT TRAINING, ACROSS THE AREA, THOUGH A SLOW NORTHWARD
TREND/PROPAGATION IS EXPECTED DUE TO THE LIFTING NORTHWARD OF THE
SURFACE WAVE AND ASSOCIATED SHORTWAVE, PERHAPS LIMITING BEST/IDEAL
TRAINING A BIT. STILL, GIVEN LAST 24HR RAINFALL ACROSS THE AREA,
PARTICULARLY FURTHER NORTH AND EAST INTO THE CUMBERLAND
PLATEAU...LOWERED FFG VALUES AND SATURATED SOILS EXIST ALLOWING
FOR INCREASED/NEARLY COMPLETE HYDROPHOBIC RUN-OFF OF THESE 1-2"
TOTALS. AS SUCH, THERE IS A LOW POSSIBILITY OF ISOLATED FLASH
FLOODING OVER THE NEXT FEW HOURS ACROSS N AL AND S-CENT/SE TN.
STILL, REGARDLESS OF FLOODING WITH THESE CELLS, THEY WILL CONTINUE
TO FURTHER SATURATE THE GROUNDS FOR ADDITIONAL CONVECTION EXPECTED
BY LATE AFTERNOON EARLY EVENING.
STRONGER HEIGHT-FALLS AT THE LEADING EDGE OF STRONGER POSITIVE
TILT FULL-LATITUDE SYNOPTIC TROF WILL SUPPORT INCREASING UPPER
LEVEL JET DYNAMIC ASCENT AND DPVA TO OVER-WASH THE AREA. THIS
WILL SUPPORT FURTHER UPSTREAM/BACKBUILDING REDEVELOPMENT TO OCCUR
ALONG/NEAR THE SURFACE INFLECTION IN N MS, WITH SOUTHWARD
EXPANSION AFTER DARK. STILL, GIVEN THE PLACEMENT OF THE SURFACE
WAVE, ENHANCED LOW LEVEL FLOW AND MOISTURE/THETA-E
FLUX...INSTABILITY WILL INCREASE TO 1500-2000 J/KG TOWARD 19Z,
ALLOWING FOR STRONGER/BROADER CONVECTIVE CORES. THESE CORES WILL
CROSS N MS/N AL INTO TN LATER THIS EVENING INCREASING THE
PROBABILITY FOR FLASH FLOODING GIVEN THE GROUND CONDITIONS ARE
BEING COMPROMISED CURRENTLY (IF NOT EXCEEDED ALREADY BY 20Z)-
2
-
-
the start of a 2020 redux?
Both the 12z Euro and 18z GFS have huge amounts 8+ inches over TN over the next 360 hours..GFS 14 in
a dumping the next 2 days..a decent break but then very active
and soil moisture is currently already high (70-80 percentile)
-
-
5 inch contours back on 7 day click for this mornings update
The MS river at Baton Rouge, without the rain factored in, crest 44 feet .... top 5

-

Expected Rainfall Amounts Thursday Night through Sunday Afternoon. Total rainfall amounts will generally range from around 2.5 inches to around 3.5 inches. These expected rainfall amounts may have an affect on area rivers. These expected rainfall amounts are preliminary and subject to change.
-
1
-

Coronavirus
in Lakes/Ohio Valley
Posted
ouch MI
205 new deaths with 1279 new cases
IL
1465/ 68