
LaGrangewx
-
Posts
399 -
Joined
-
Last visited
Content Type
Profiles
Blogs
Forums
American Weather
Media Demo
Store
Gallery
Posts posted by LaGrangewx
-
-
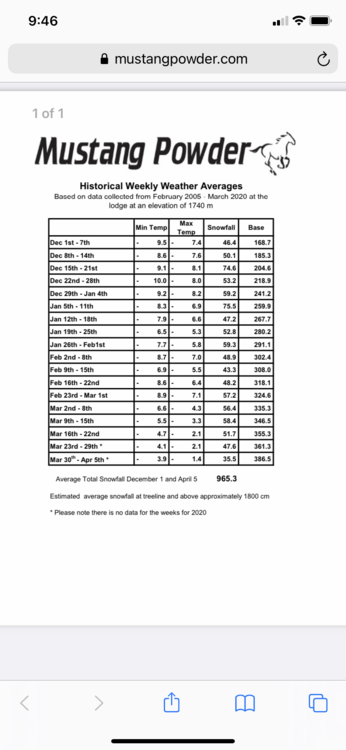
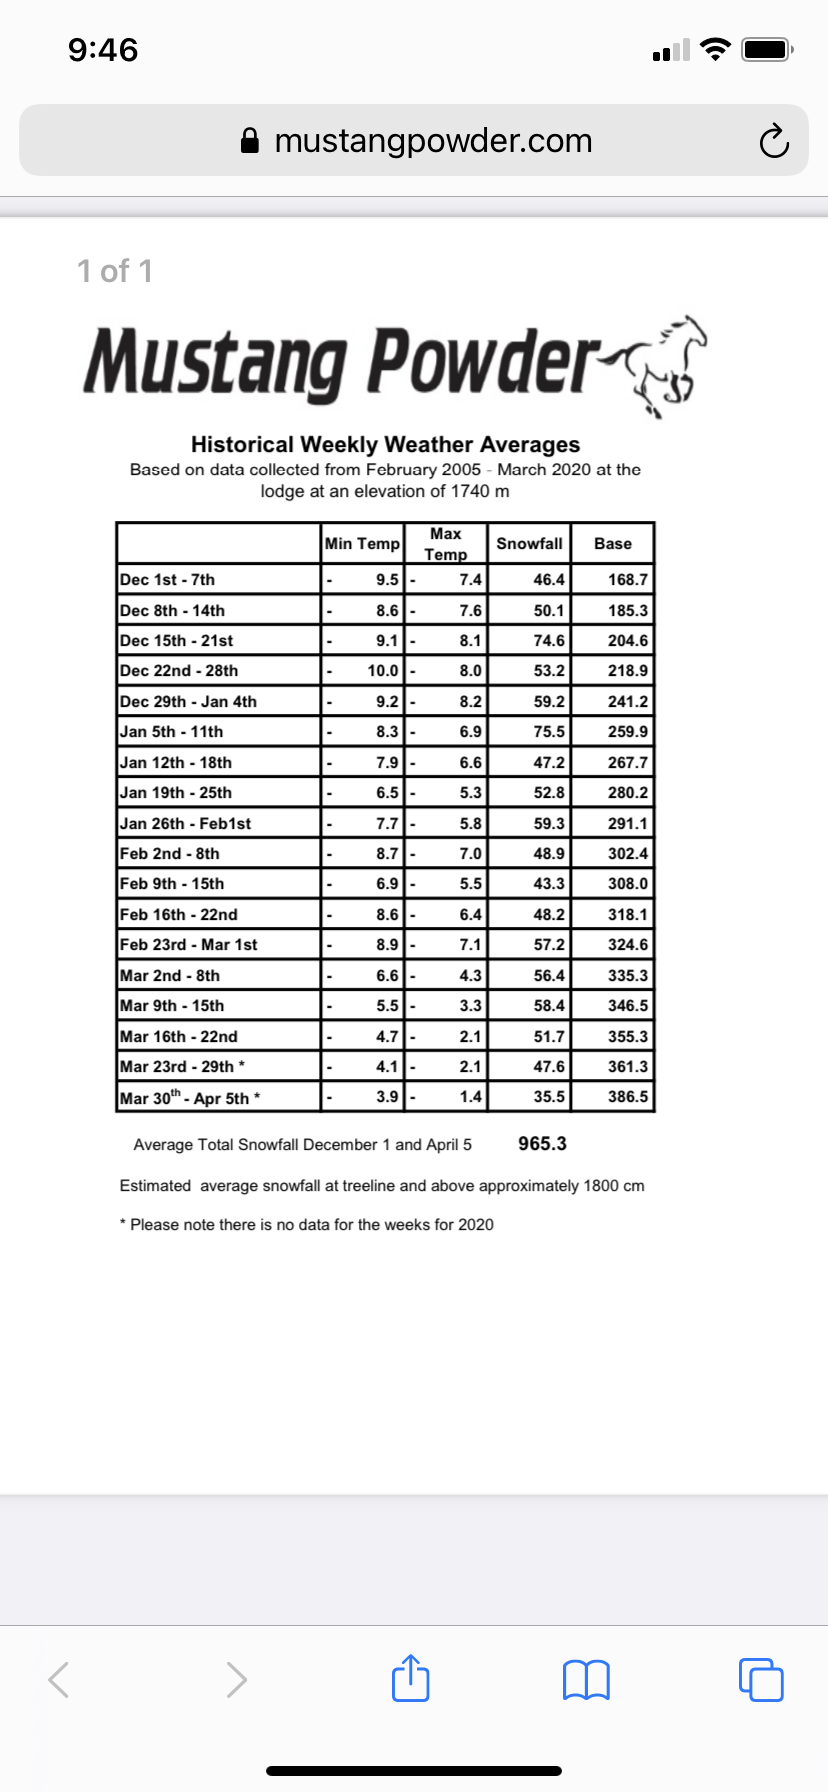
Was snooping around some cat skiing operations in BC after seeing a bunch of Instagram videos recently and found some cool data. Mustang Powder in the Monashee mountains near Revelstoke has kept records at their lodge at 5700’. They claim to average 380” just December thru March which blew my mind. Nearby Mount Copeland had a station at 6000’ for a few years in the early 1970s and averaged like 750” during the 5 or so years and had one year with almost 1000” snow.
Another station nearby in the Selkirks with longer term data Mount Fidelity at 6150’ averages ~550 inches and around 350” December to March. Rogers pass below at 4300’ averages around 350” for the entire season. So the Mustang powder lodge probably averages somewhere around 550-600” during a full winter. Mountains in this region get up over 9000’ so the claims of 800-1000” average snowfall in the higher alpine are probably not far fetched at all.
The Columbia Mountain region fascinates me and is tops on my bucket list of destinations. I have read people claim this region averages the most “dry powder” in the world and they always seem to be consistent, it’s not usually feast or famine like the Sierra can be. The amount of quality powder snowfall in this region blows my mind and truly has to be one of the best regions in the world for snowfall and skiing. Hopefully I’ll experience it firsthand one day!
-
 1
1
-
-
31 minutes ago, Froude said:
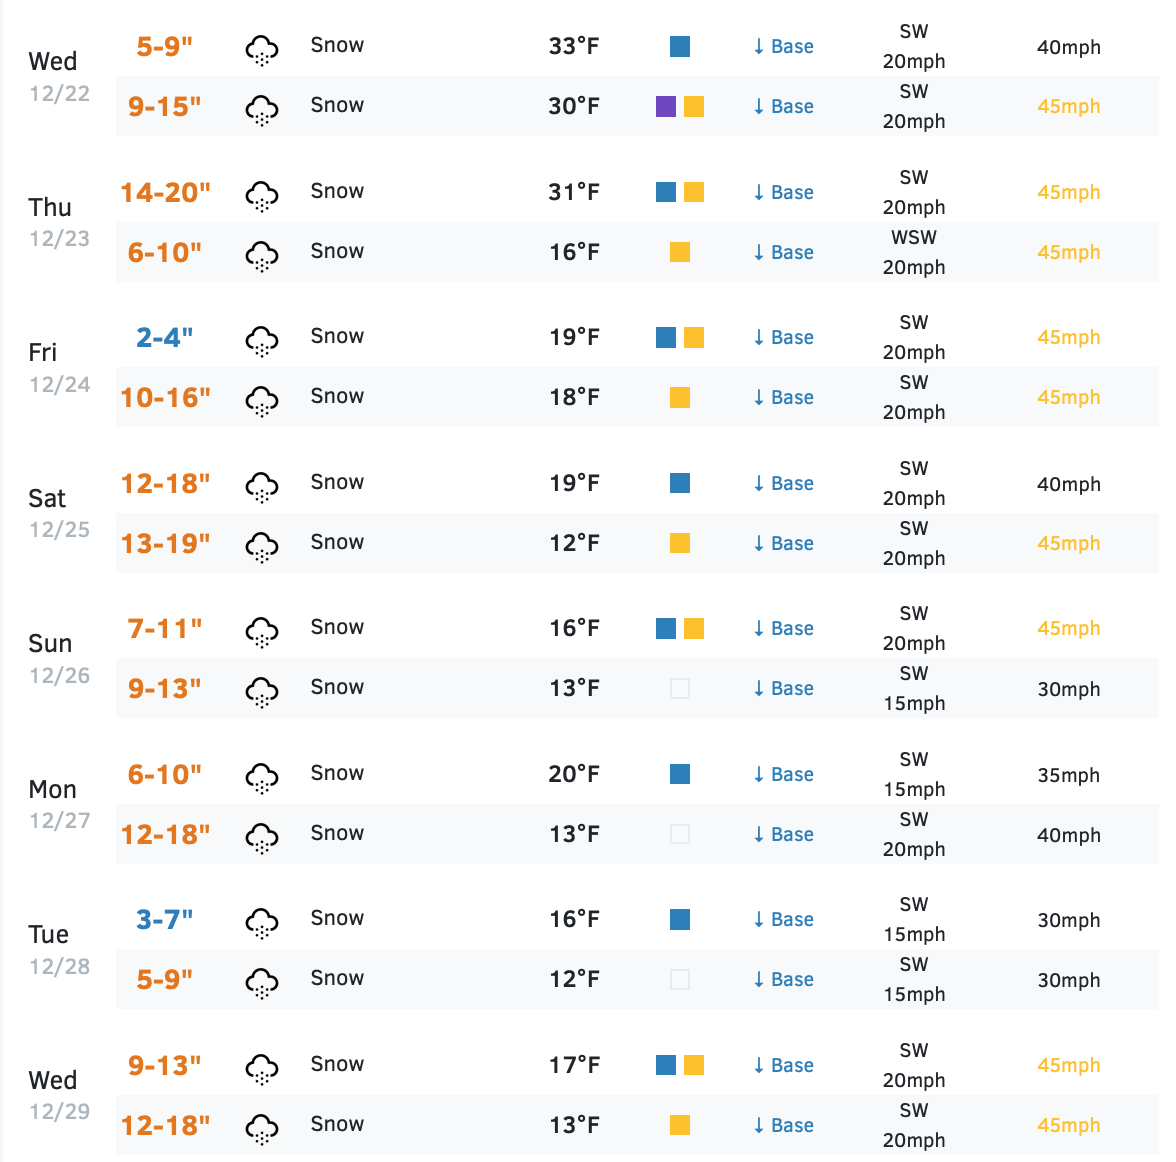
What I wouldn't do to be holed up in the Sierra this week. While we debate inches they're doing it in feet over there. For Kirkwood...
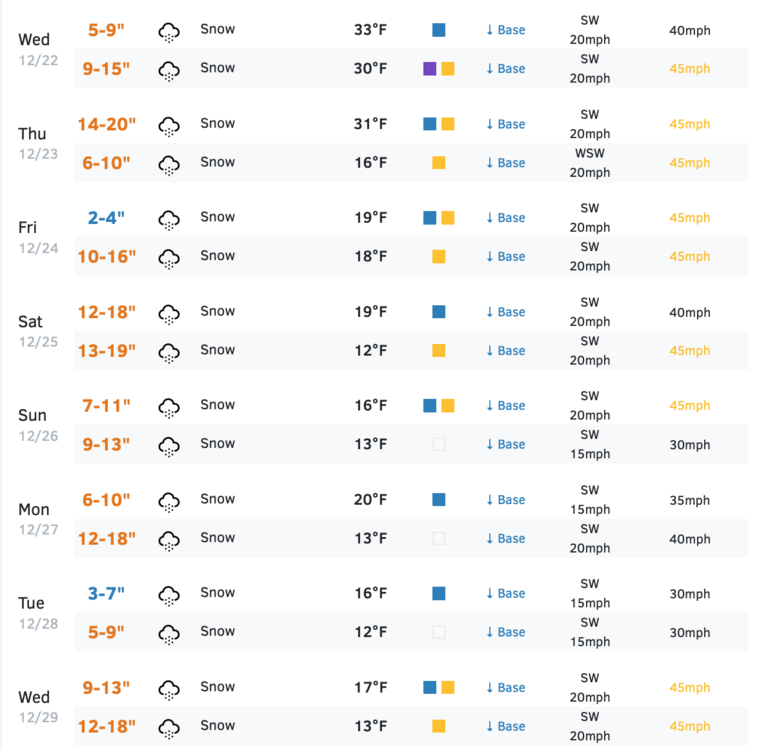
7 days straight of ~30” is just incomprehensible. I’ve never witnessed a 30” storm.
-
28 minutes ago, Froude said:
What I wouldn't do to be holed up in the Sierra this week. While we debate inches they're doing it in feet over there. For Kirkwood...
The latest 0z GFS run for them was biblical. It just spit out a 250” number around Kirkwood. Potentially A nice 20 feet in the next 15 days. They are due for a massive winter and look to be off to an awesome start.
-
From personal experience I think Killington usually has more snow than Okemo. I’d classify Okemo more with Stratton and Mount snow in terms of snowfall and geography. Killington area seems to be the major transition to where the spine sees more upslope snowfall. Okemo rarely gets a big upslope snow but Pico definitely can and I remember it happened last year in January when they jackpotted an event. Killington has a slightly more northern latitude but this area can often be the cutoff for mixing as just seen in this event. It also has a better geographic position for snowfall and about a 1000’ higher summit. They also definitely report their numbers from a good sheltered spot at the tippy top as that’s where their long term data is from. Okemo on the other hand could very well report from mid mountain or lower so I think the large discrepancies on reports can have some validity but have to be taken with a grain of salt. I will say if you look at Killingtons long term data they had some abysmal winters up until the last year or so where it seems they have really put a focus on reporting higher snowfall numbers as they seem to come out near the top on a lot more events. It also bothers me a bit they report identical snowfall at killington and pico even tho I bet there’s slight differences quite often. I know we’ve discussed this before but some resorts just market snowfall better and want to tally every inch like Jay peak versus Gore mountain where they seem to walk outside and estimate with a ruler sometimes. I think Killington has had a combo of lucky storms lately and has become more diligent at marketing their snowfall.
-
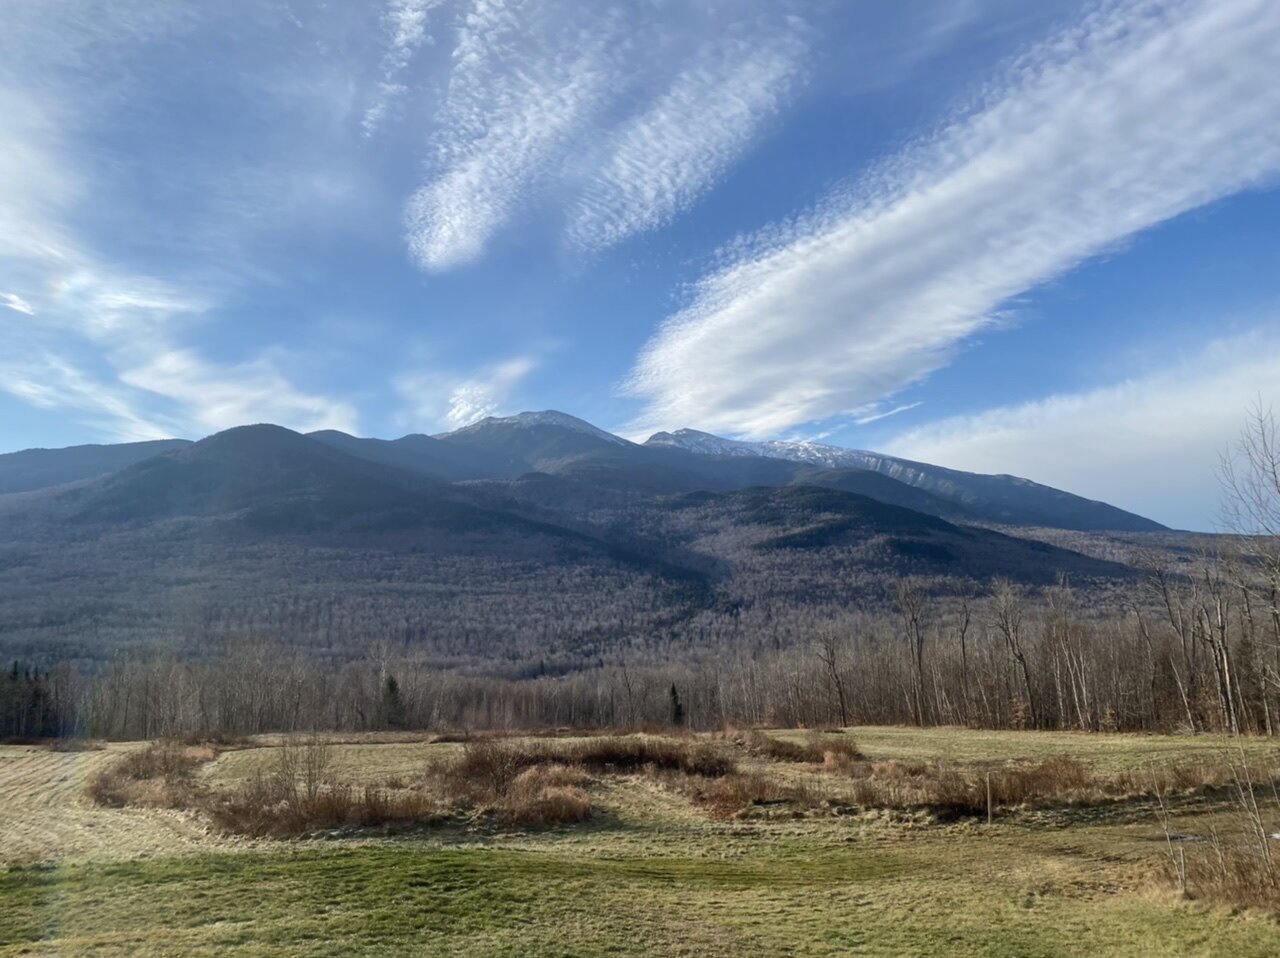
1 hour ago, PhineasC said:
Happy Thanksgiving Everyone!
Awesome picture that view never gets old.
-
1
-
 1
1
-
-
2 hours ago, PhineasC said:
Ended up with another 2" last night, maybe a tad more. 4" last two days is pretty solid given the marginal temps for much of the day yesterday. Mid winter this would been a nice fluffy event of several inches.
Edit: forgot about the inch Sunday. So 5 inches last 3 days in marginal temps is pretty solid.
Looks like Hermit Lake raked up a foot or so based on the 9” depth increase yesterday. Pretty sweet hopefully ski season starts with a bang.
-
1
-
-
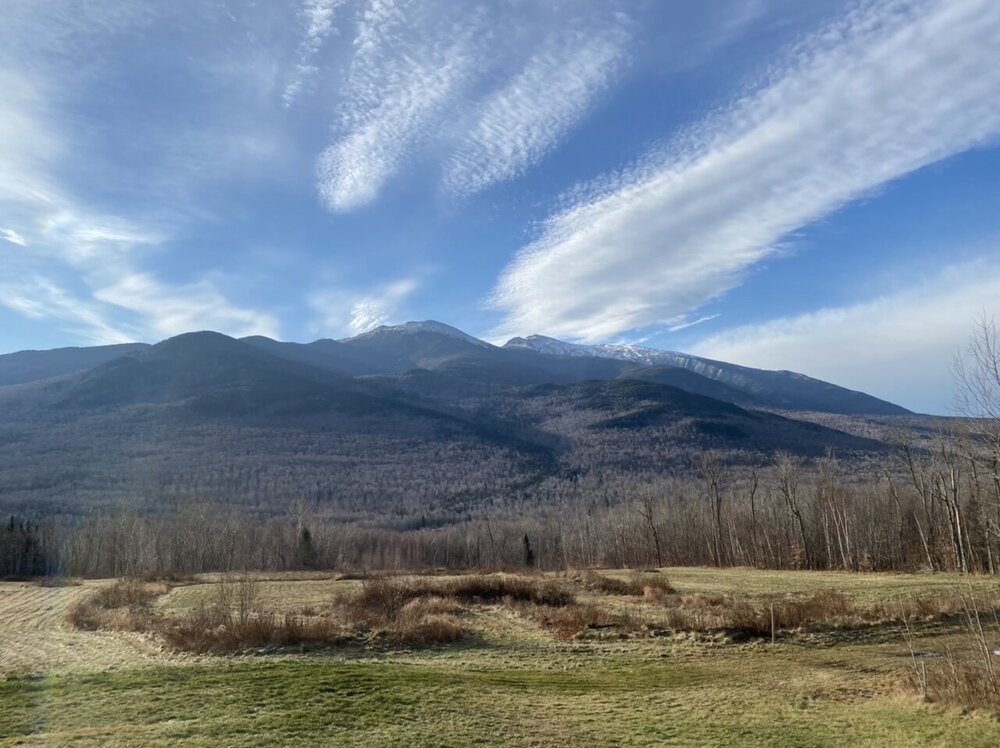
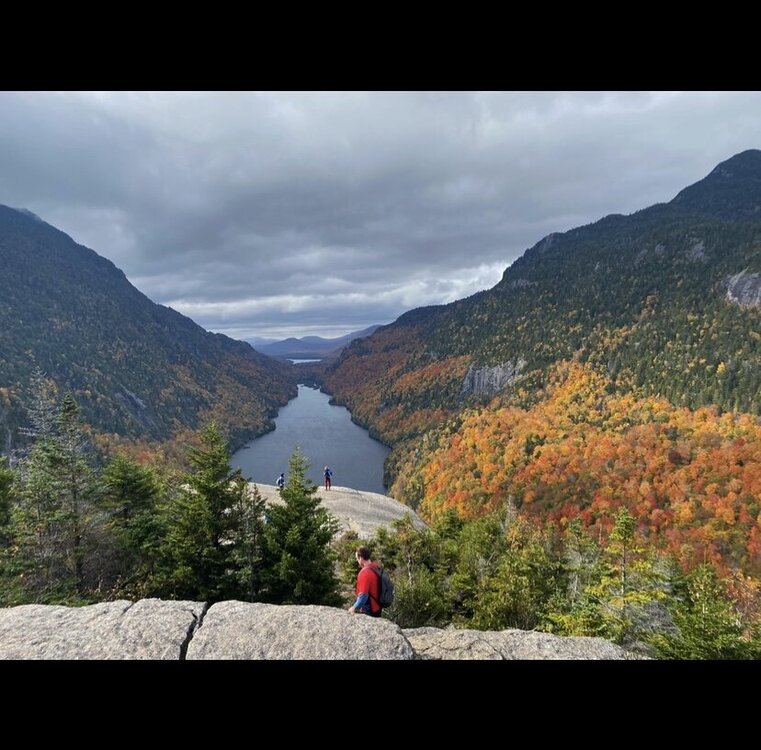
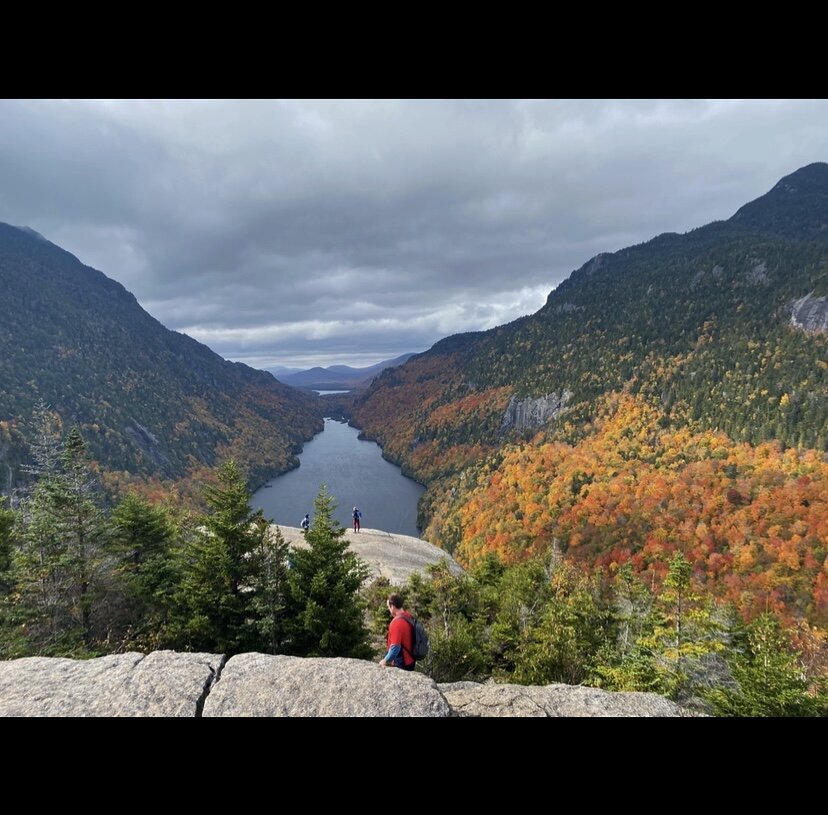
Indian Head was gorgeous yesterday.
-
5
-
-
55 minutes ago, gravitylover said:
^^ Where's that?
Indian Head in the Adirondacks. One of the most picturesque settings on the East Coast in my opinion.
-
Plenty of color today. It really takes off as you go north of Lake George.

-
4
-
-
Getting up early to hike Indian Head in the Adirondacks tomorrow. Expecting beautiful colors. Will post pics.
-
1
-
1
-
-
2 hours ago, IrishRob17 said:
Fantastic! Here’s the view from my sons apartment, the kid is living his best life although there’s some adjusting for him as he’s almost 29 so he had to get used to college students again LOL

Nice right near eddy street it looks like.
-
1
-
-
On 9/21/2021 at 7:34 AM, IrishRob17 said:
Yes but I secured them before my son found out he can get tickets at face value with relative ease. He’s even going to to Chicago this weekend for the Shamrock Series game against Wisconsin, going to see the Cubs on Friday night too.

Hey no way that’s awesome!! I am a Notre Dame Grad as well. Heading out for the Cincy game October 2nd.
-
1
-
-
1 hour ago, powderfreak said:
Pretty cool we are getting towards that time of the year… warm lake waters and cold air above them:
NEAR TERM /THROUGH MONDAY/... As of 710 AM EDT Sunday...Only minor changes to the forecast based on latest observations. Increased cloud cover locally over Burlington and south into Addison County as a lake band has developed downstream of Lake Champlain this morning. Based on NAM3 sounding profiles, temperatures aloft at ~1500ft are around 10C and latest lake ob shows water temps of 68F. This give a delta around 18 degree supporting the development of this cloud. As daytime heating commences the temperature difference should lessen therefore expect this cloud to dissipate within a couple hours.
14 hours ago, powderfreak said:I'm trying not to be a homer, and I have no real direct observations between the two. My first season pass was to Whiteface/Gore back in high school, moved to the VT side during college and never went back for skiing. It feels snowier, though the 'Dacks are cold and hold snowpack very well.
The weird posit is that there is a sweet spot elevation zone in NNE mountains that the true high peaks may be too exposed to capitalize? The Adirondacks and Whites have far more above treeline terrain than the minor amount in the Greens on Mansfield. More wind, turbulence that causing less than ideal crystals too? Higher snowfall in the areas surrounding the big terrain, definitely less mixed.
I do think the Northern Greens are better in NW flow upslope (those conditions exist mostly during strong NE tracking storms) and are further east for coastal synoptic events. That's why this area over through Alex and Phin's area is so snowy. The best overlap of orographic snows and synoptic snows. Some years feature differing amounts of SE vs NW flow events, more mesoscale precip versus larger scale synoptic SE-E flow off the ocean.
The overlapping zones do the best statistically over the course of the winter season.
For what it’s worth hermit lake plot has average 200+ inches I think at like 3900’ over the past 3-4 seasons and I don’t think they’ve even had 1 average winter so who knows up at 5000+. Like you said wind could be a huge factor. I think they had 175 or so counting October and November last year in a pretty abysmal winter for that zone. The early and late season snow really tallies up there. April 2020 was huge there I think.
-
12 hours ago, CoastalWx said:
Random question. Does a place like Whiteface in the Dacks avg similar to Mt Mansfield? Is it snowier or not?
I’ll chime in and say I’m confident Whiteface does not average the same as Stowe. They cash in a few times with decent lake effect but Stowe is almost always getting snow as well when they do. Stowe is better with the uplsope and is positioned better for many of the coastal storms. I think an interesting question is what do the core high peaks around Mount Marcy above 4-5000’ average. I think that could be much closer as I think that area does a bit better than the whiteface basin.
-
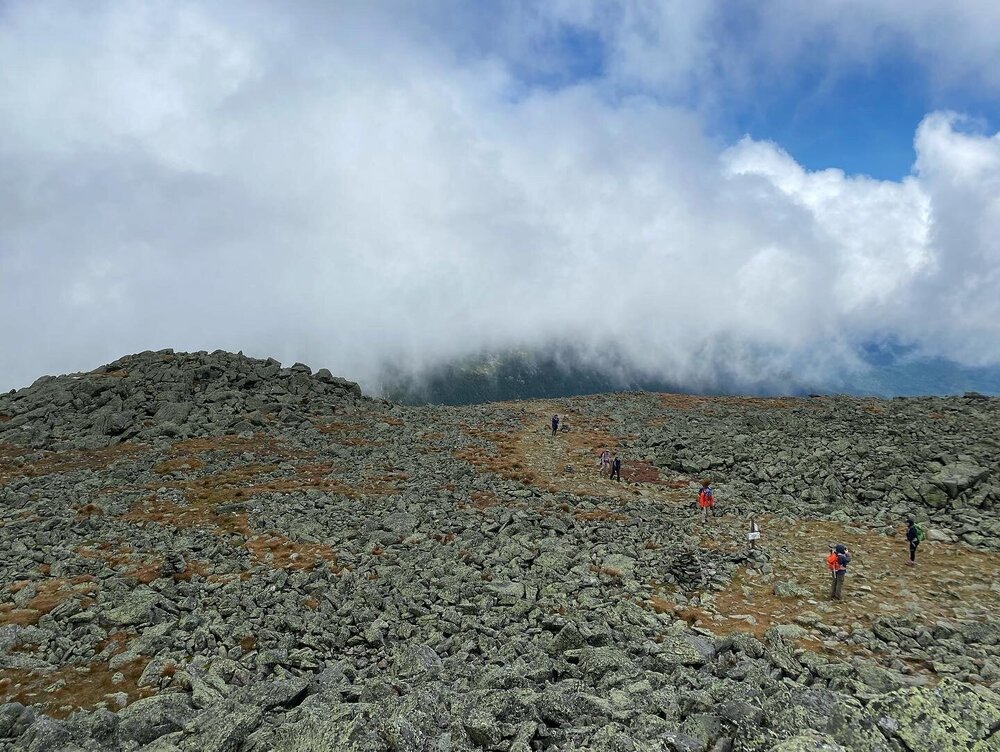
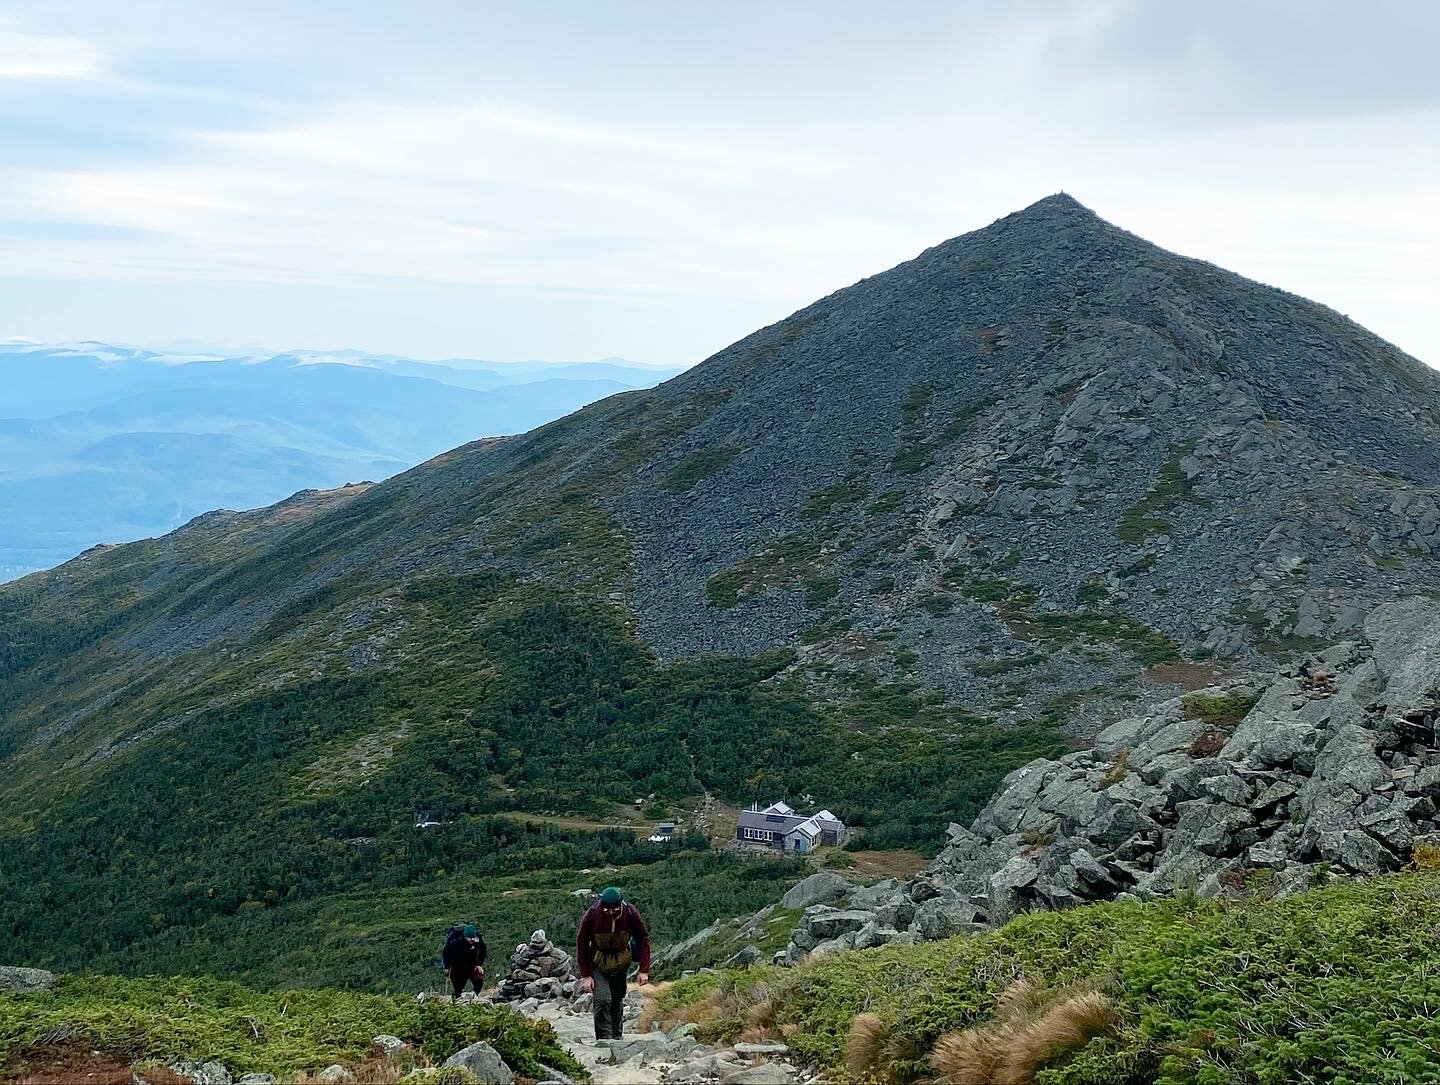
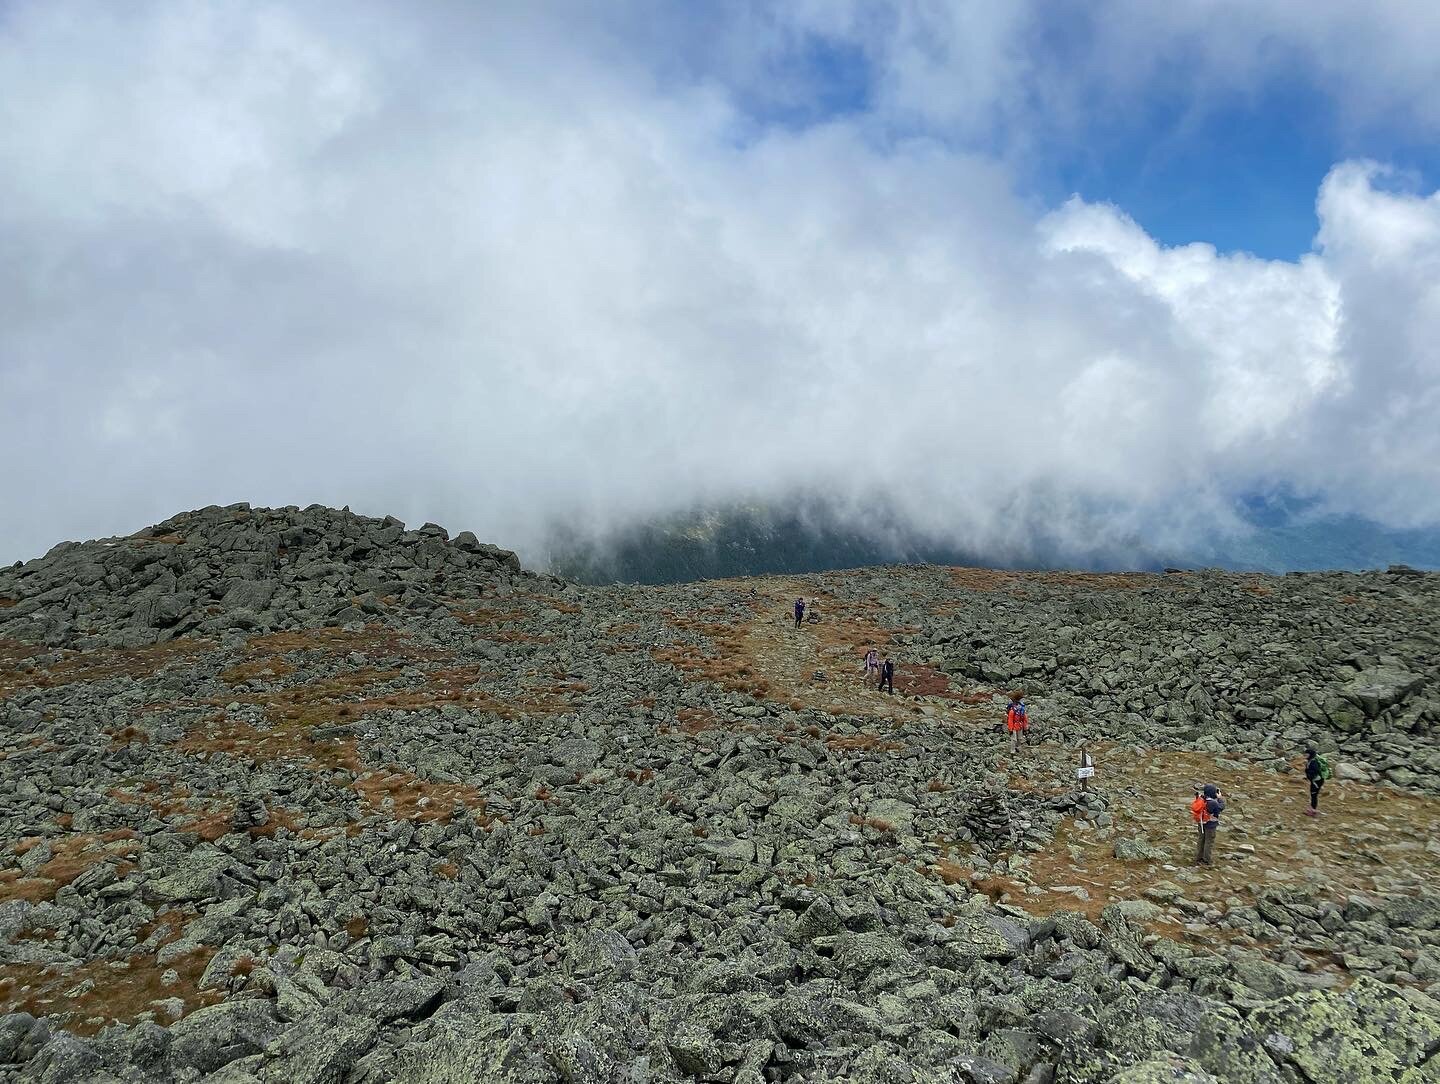
Thought I would share my attempted Presidential Traverse this past Friday and Saturday. We camped out at Crawford Notch Campground Thursday night in the rain. Then woke up at 5am Friday morning dropped one car off at the Highland Center and made our way to the Appalachia Trailhead. Our hike started off with a light mist and 60 degrees at the Appalachia Trailhead in Randolph. We immediately ran into brutal conditions above tree-line on our first summit attempt, Mount Madison. Rain and 50 mph winds with 50 feet of visibility quickly put a damper on our trek. Originally we were hoping to make it all the way across Washington the first day and stay at Lakes of the Clouds hut, then finish the southern part of the traverse Saturday. Winds were only supposed to increase throughout the day Friday into the night so we decided it would be safer to try and bail into the Madison Spring Hut for the night. After summiting Madison we carefully scampered our way down the wet rocks in what felt like 40 degree hurricane conditions. Thankfully the Madison Hut was able to switch our reservation from Lakes and we stayed the night. The wind overnight at Madison hut (4800 feet at tree line) was incredible to hear as I checked and saw Washington was gusting to 90. Wind chills were in the single digits and the hut has no heat so we could easily see our breath. The following morning we realized our traverse attempt would be too much to bite off for one day so we decided on trying to summit Adams and Jefferson. Started the morning in snow pants and a jacket with higher spirits since it was dry but sadly both summits were socked in and still blowing hard. There were some nice views to be had a bit lower down. Made it back to the car where it was a calm 70 and sunny, and headed over to the Omni Resort for some drinks and food. By the time we got there the summits were completely in the clear and even looked like they were giving us a nice middle finger. Lol. All in all it was an experience and the Presidential’s always amaze me every time I visit with the drastic difference in climate in the alpine and sheer size of the mountains. The Madison hut saved our asses and the food was fantastic. I would definitely recommend the hut experience and I can’t wait to give it another go next year!

-
3
-
-
54 minutes ago, Juliancolton said:
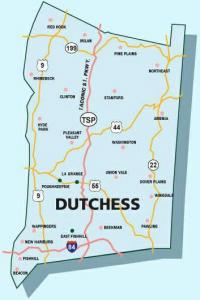
From what I've seen, this was still a couple notches below Tax Day '07 and October '05 in Dutchess, but above Irene. Floyd seemed to impact a lot of different areas that have probably been built up or improved since then.
I was only a kid in October 2005 but I agree. My friend lived in the house across from the overlook drive in back then and his property was flooded even worse then compared to today. I think there were two back to back 8” rainfalls in Dutchess that month?
-
Driving around Dutchess this morning. Freedom Lake and Skidmore area is in rough shape again. Redwing is across velie and Pages near 55 there is a lake of standing water. Area near the Overlook drive in is also flooded badly. Bad flooding with Probably 5-6” rain in Dutchess after a wet summer. Can’t imagine what the 10-12” in a few hours did down in parts of NJ and the City.
-
1
-
 2
2
-
-
7 minutes ago, Juliancolton said:
The homes on Gidley Rd along Sprout Creek must have been just swamped. They got hit hard during Irene, and this was at least as bad as then for our area. A neighbor grew up in my house in the late 60s and early 70s, and he said this was the worst flooding he'd ever seen from my pond. The bank and outflow channel will need some remedial work, but at least it's still a pond, which was in doubt for a while.
I'm told a number of people had to be rescued from stalled cars on Waterbury and Camby last night. How folks manage to get themselves in that situation, I'll never understand
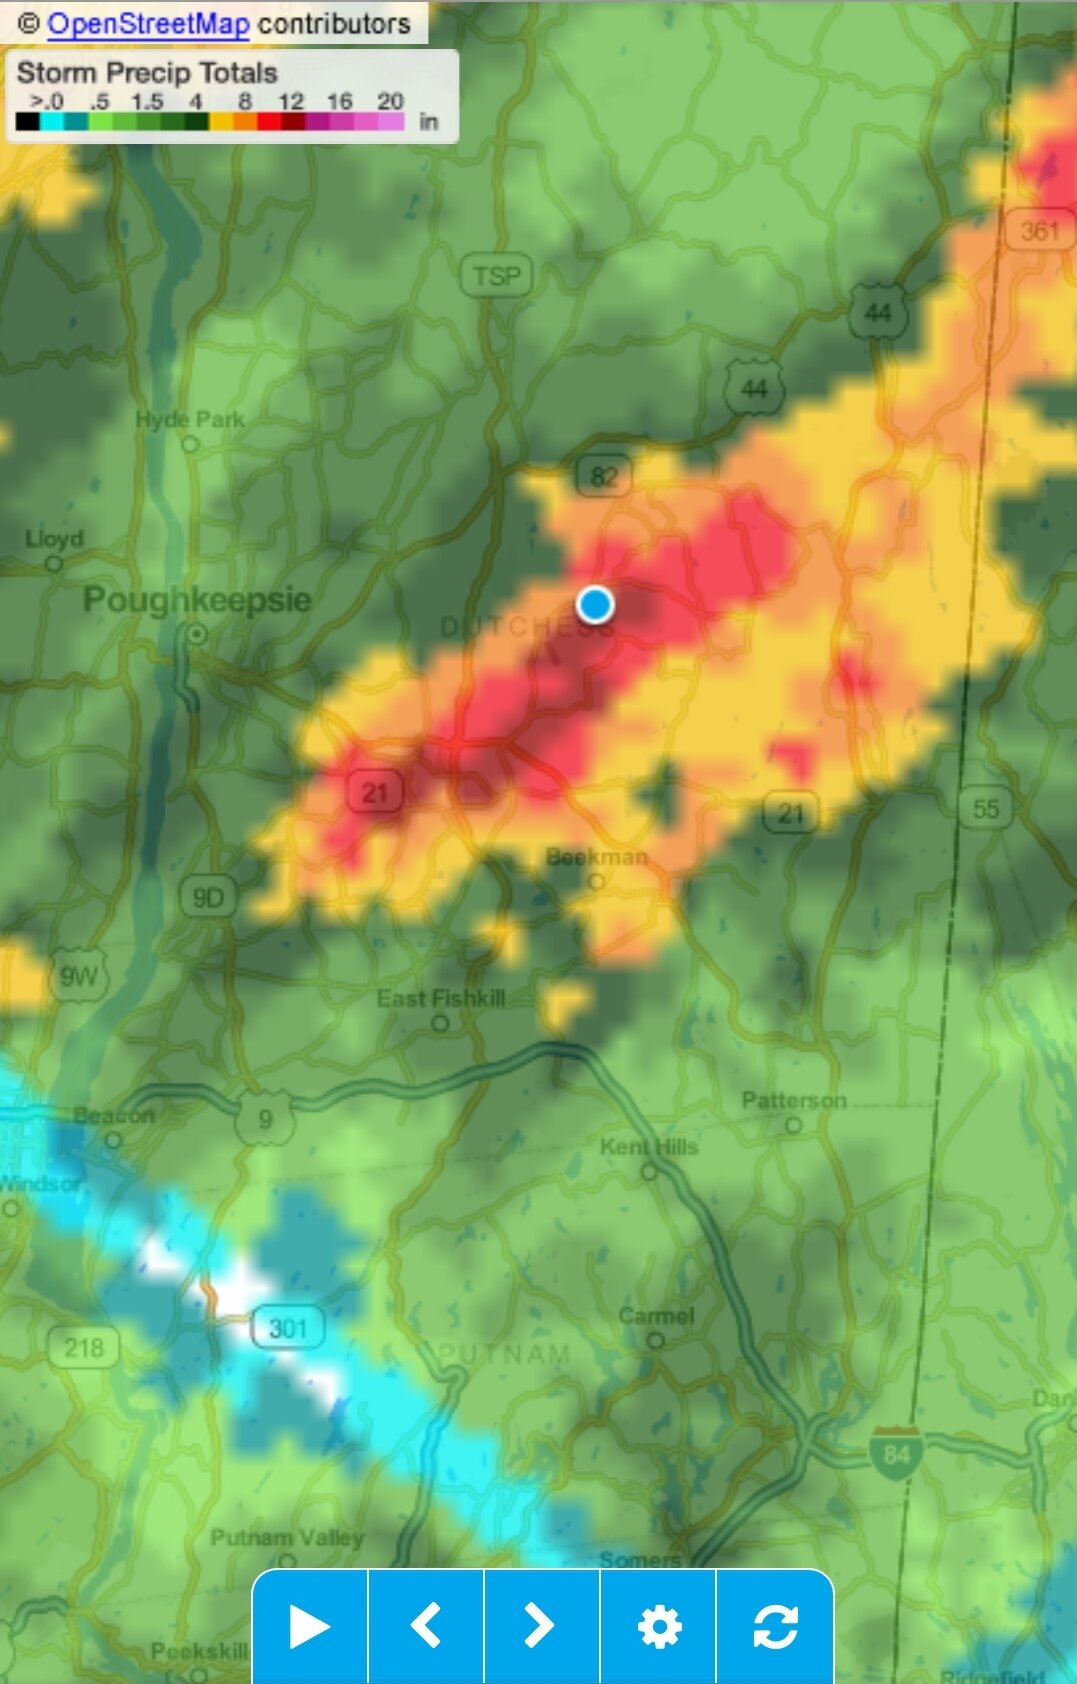
Radar estimated storm total precip from WeatherTap. Totals are almost always inflated, but good for identifying spatial patterns. I finally got around to checking the Stratus - 4.73" for a total, almost all of which fell in 90 minutes.
Nice Weathertap seems great. Based on the flooding I think 4+ inches in that area is definitely reasonable. Some of The PNS reports definitely don’t depict what happened last night. Also the Jaffrey area of NH had 7-8”.
-
3
-
-
Took a drive out to Freedom Park off Skidmore. Flooding is devastating. Red wing lake is overflowing onto Velie road which is currently closed.
-
1
-
-
9 hours ago, Juliancolton said:
The hits keep coming for sure. It doesn't get much more dead-nuts than this:

Absolutely Poured here last night. Also What map/graphic is that?
-
On 7/12/2021 at 10:32 AM, J.Spin said:
Thinking about ways to get at which winter seasons had a tendency to deliver “larger snowstorms” vs. those that didn’t, I’ve made a couple of additional comparisons. Presenting the single largest storm as done in my initial plot above is certainly useful, but the single largest storm could easily be an outlier and not quite portray the tenor the season. Bringing a few more large storms from each season into the picture would temper the effect of those “one hit wonder” types of seasons.
There are still plenty of options to consider with respect to how many storms to select, and whether to use mean and or median values from those storms, but here are two plots I made for now:
1) A clustered column plot that simply contains the snowfall for the five largest snowstorms from each season
2) A column plot that presents the sum of the snowfall from the five largest snowstorms from each season
The first plot below is nice in that it lets one view the totals for the five largest storms of the season. It’s helpful for quickly identifying instances such as you mentioned above, where seasons had >1 storm of 20”+. I don’t think it works all that well for quickly getting at whether or not a season was one that tended to deliver large storms though. There’s enough data there in each set that they all just look like stair steps of data points unless you dive in and examine them closely.
I think the second plot may do a better job of quickly highlighting those “big storm” seasons. Since each point is the sum of the top five storms, a season that consistently brings larger events is likely going to poke its head above the rest of the crowd. The 2016-2017 season is of course bolstered by the big 41” storm, but it’s still up there even when tempered by incorporating the next four storms. In this analysis, 2010-2011 and 2006-2007 also seem to pop up as potential “big storm” seasons. I like that 2006-2007 popped up on that plot, because it did have that “consistent, big storm feel” once it got going with what seemed like a notable storm on each holiday in the spring. Note that one could also plot the averages for the top five storms for each of these seasons and produce the same relative plot, but I think providing the number for total snow from the five storms gives a more immediate sense for the contribution that those top storms made to the season’s snowfall.
While my initial plot of largest storm of the season certainly suggested that this past season was relatively weak with respect to large snowstorms, I think the plot summing the top five storms from each season solidifies that feel. This past season again came in as the second lowest in the data set next to the horrendous 2015-2016, suggesting that it was quite weak in the “big storm” department.


I know I’ve seen you track the number of snowstorms per year which is great data do you also have data on the total number of days with snow each year? I was looking at some places. I believe old forge in lake effect country is around 75 and the johnsweather guy in Pittsburg is around 85. I would guess yours is high as well with all the constant upslope.
-
Just got a short light snow squall down here in the Hudson valley. It was almost 50 degrees out and sunny before the squall and it is now sunny again. Probably the warmest temp snow I’ve ever experienced. Makes me think hard about the times I had mixing at single digit temps in the past.
-
Getting snow here at almost 50 degrees

-
29 minutes ago, J.Spin said:
Below is the north to south listing of available season snowfall totals from the Vermont ski areas:
Jay Peak: 235”
Smuggler’s Notch: 175”
Stowe: 178”
Bolton Valley: 154”
Mad River Glen: 146”
Sugarbush: 132”
Pico: 186”
Killington: 186”
Okemo: 116”
Magic Mountain: 107”
Stratton: 132”
Mount Snow: 143”
The totals will typically go from highest to lowest, right down the spine, so if you see substantial deviations from that trend, that’s something to note.
I don’t think any of the resorts are quite on average snowfall pace at this point, aside from those SVT areas like Stratton and Mount Snow – possibly because they got in on that big banding storm?
In a relative sense, the Killington/Pico area is clearly doing well if they’re ahead of every resort up north except for Jay Peak.
Killington/Pico and Jay Peak are probably close to average pace for snowfall? I still think they’re a bit off of average, but closer than most resorts aside from the SVT ones I mentioned above.
I’m not sure what happened at Magic, except that they must have missed that big banding, and that’s where seasonal snowfall would be for the SVT resorts if they hadn’t gotten in on that?
I think I recall Okemo getting the brunt of some big storm at some point this season? So the fact that they’re reporting only 116” for the season suggests that they have been pretty far off the pace for the most part.
There’s clearly been some disparity between average snowfall in the valleys vs. the mountains this season up here in NVT. We’re a touch ahead of average snowfall pace here at our site, but in general, the resorts of the Northern Greens run just about double our snowfall here. Therefore, they should be running around 270” at this point if they were on track with our site. Even if they were just running at an average snowfall pace, they should be at 240-250” by this point of the season, and none of them, even Jay Peak, has reached that point yet.
All the resorts of the Northern Greens are definitely behind average snowfall pace for this point in the season (the below average depth at the Mt. Mansfield Stake doesn’t prove that, but it’s at least consistent with it). Skiing hasn’t suffered horribly though in the past couple of months around here though for at least a few reasons:
1. We’re above the traditional 40” off piste skiing threshold depth at the Mt. Mansfield Stake, so essentially everything is well covered and in play.
2. There’s plenty of liquid equivalent in the snowpack, even if the depth at the Mt. Mansfield Stake has been running behind average.
3. We’ve gone through many weeks with no thaws, so there haven’t been any losses to the snowpack, and the snow quality has stayed very high. This is a great example of how those sub-300” and even sub-200” snowfall areas out in the Rockies can provide high-quality skiing most of the time.
Great write up. Killington is actually about 15” above average based on the data they have on their website. They claim 170” is average by the end of February. Stratton should average a bit more snow than Mount Snow but they always seem to report pretty conservatively. Both those mountains are probably a bit above average. It is surprising Okemo seems to be below average even after their record 45” storm in December which accounts for almost half their snow on the season which basically disappeared not long after they got it. Seems like The great stretch that was enough to provide excellent skiing conditions wasn’t quite enough to overcome the lackluster start to the first 2.5 months to get places up to their season average to date. I believe The Mansfield stake has always been just below average and hasn’t been able to quite break above the mean line yet. Like you said, a below average winter has still provided one of the better stretches of skiing up there and that really goes to show how much it snows in the northern New England mountains during an average winter. Down here in the Hudson valley, if you get one big storm above 18” and have a sustained period of colder weather it’s an A winter.
I wonder if Sugarbush could be measuring or reporting differently Or if they really did just miss out this winter a bit more than everywhere else? I remember in the past it was rare for them to report less on the season than Mad River Glen and especially rare to have less than Killington let alone 25% less like currently. Usually they were very close to Stowe’s numbers when they used their summit snowfall totals.


The 2021-2022 Ski season thread
in New England
Posted
@MRVexpat Great pics skiing looks fantastic!
@HitmanYea those remote Cat and heli lodges are super cool. Congrats on the trip I’m actually looking into a trip to the OPUS hut near Telluride potentially.