

so_whats_happening
-
Posts
1,059 -
Joined
-
Last visited
Content Type
Profiles
Blogs
Forums
American Weather
Media Demo
Store
Gallery
Posts posted by so_whats_happening
-
-
2 hours ago, GaWx said:
More can kicking regarding the timing on when the SPV gets weaker than normal on the Euro Weeklies. Back on Nov 1st, they had this occur at the start of Dec or ~30 days out:

Today’s run delays it the most yet as it waits til Dec 20th, which is still 30+ days out:

When will the can kicking stop? Is this just a mirage or is it real? Do the Euro Weeklies have a bias toward weakening the SPV too much in Dec?
We need some strong activity in the troposphere to show up before we really start to see changes in the SPV, meaning we need to see some wave producing systems to induce a weakening response. Large deep low pressure systems or some large scale blocking patterns to set up should do the trick. Again the typical timeframe to look anyway is about mid December to mid January to see any discernable activity, before that tends to be really rare situations. You can see a drastic shift occur when models finally start picking up on key signs, it can happen in like a week, although I would rather prefer the winter to already produce before an SSW as they do not always guarantee anything for us.
-
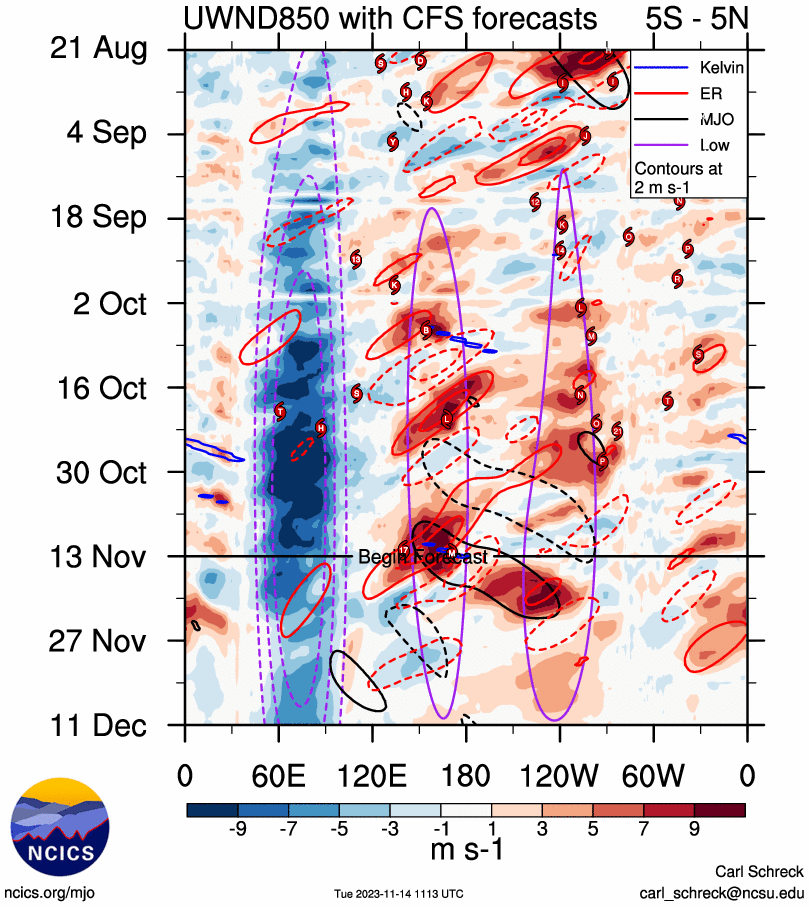
Definitely a nice WWB event though. The first almost full weakening of the trades we have seen thus far. TAO update the cooling in the WPAC continues look at the bite taken out of the 30C region around 160-170E. This will be the last I keep October in the mix since we are halfway through November.

.thumb.gif.c45525b4189ef212a316fc0411301197.gif)
-
 1
1
-
-
13 hours ago, griteater said:
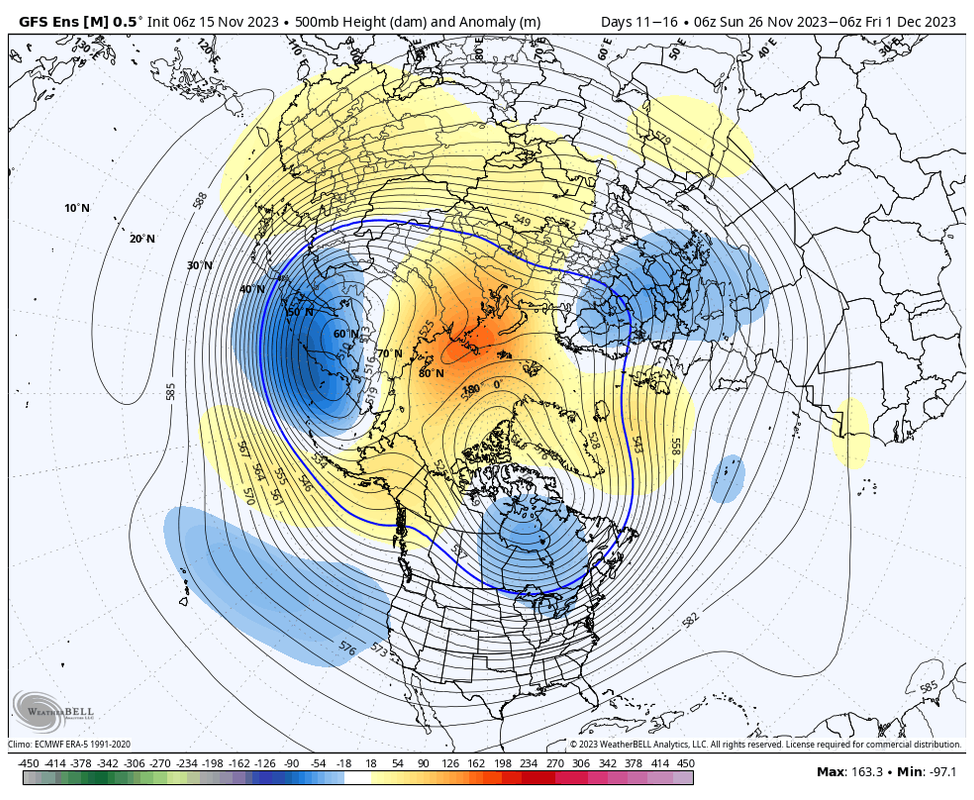
It would probably do us some good to make a subseasonal run thru 3-4-5 in late Nov into early Dec as that may get the Urals ridging activated with downstream low over NE Siberia / Bering Sea - good for Strat PV weakening (end of last GEFS run shows the configuration - 2nd image below). Then follow that up with 8-1-2 Nino forcing later in Dec. Would be a nice 1-2 punch.
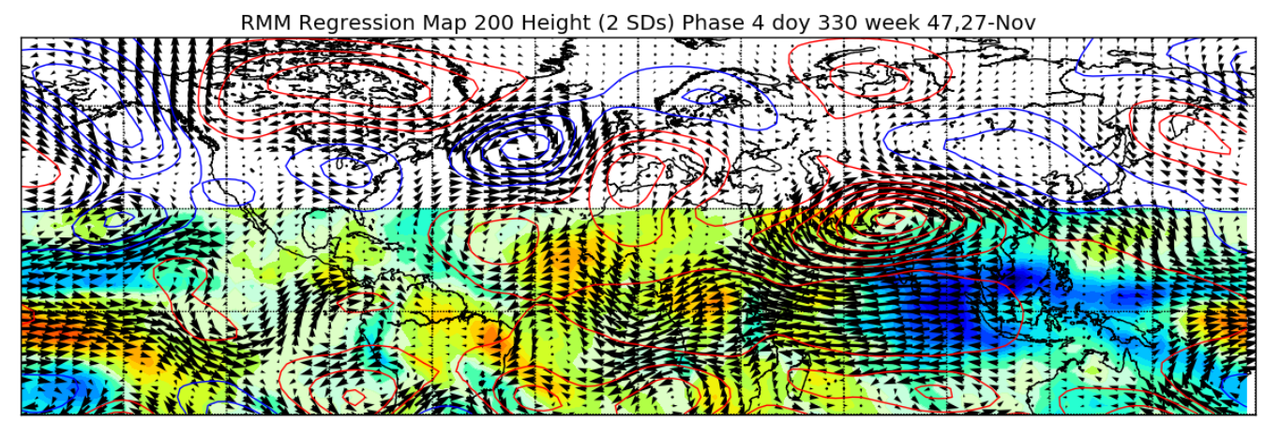
Yep a nice pass through 3-8 is not all that horrible, short term can be rough long term could be a lot of fun. Good read on the MJO to SSW precursor as well as blocking patterns before SSW.
Connection of SSW and MJO.pdf Blocking Precursors to SSW.pdf
-
1
-
 1
1
-
-
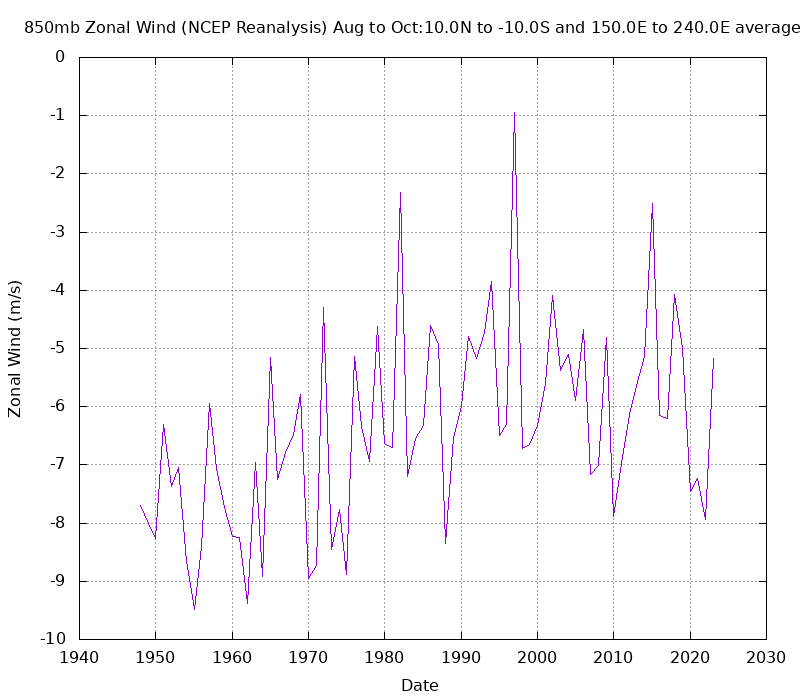
If we didn't already know here is another look at it. WWB activity is not up to par for this year compared to many years. You can see a spike in 1982/97/2015. 1972 was a nice spike but lacked intensity and we are under everyone of them thus far even 2002 and 2009, 1994 was also higher. When we go into a more concentrated timeframe and space the lines become more definitive and show how lackluster these have been thus far.
-
8
-
-
5 minutes ago, griteater said:
This WWB looks to be the most impressive we’ve seen all year in terms of it staying strong and continuing east of the dateline. So, I certainly think this will lead to some warming over the next month


Unfortunately did not save an anomaly during the mid April to mid June timeframe so the best I can provide is total U wind.
-
1
-
-
2 hours ago, griteater said:
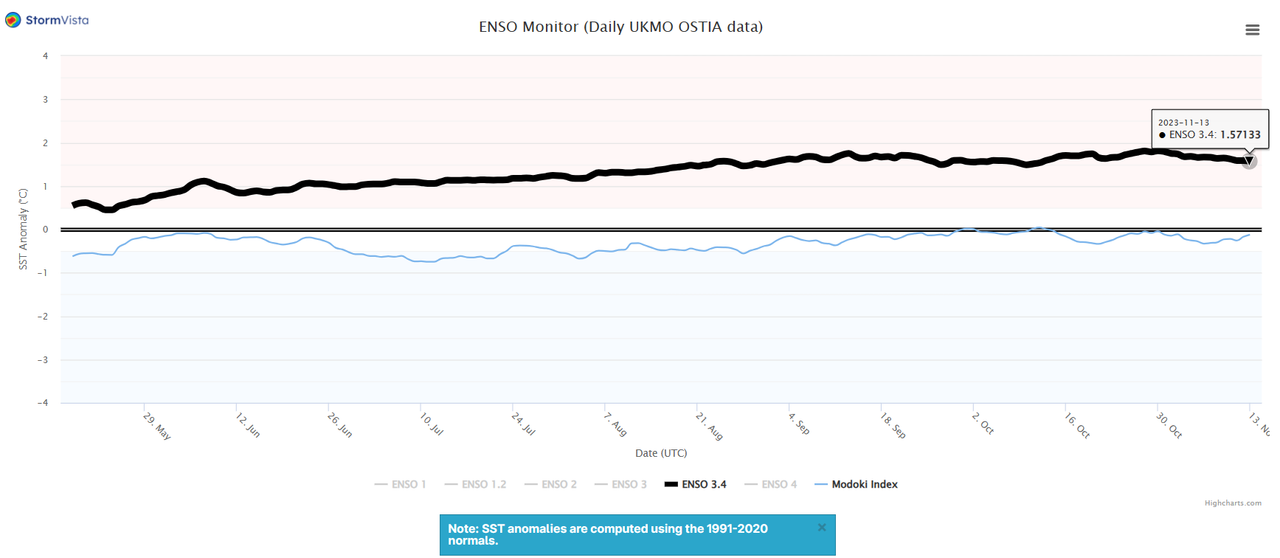
11-13 update for UKMO OSTIA is +1.57 for Nino 3.4
Happen to have the iod by chance?
-
1 hour ago, Terpeast said:
When we get the peak trimonthly average, we will likely see SON or maybe OND at 1.6.
I’m calling this a moderate nino considering other competing factors.
If we hold onto 1.8 for another week via cpc outlook or even bump to 1.9 the average should be just under 1.7 for the trimonthly after that is a big ? The lack of any continual WWB will definitely hurt chances of reaching that super status for a weekly value going forward.
-
2 hours ago, griteater said:
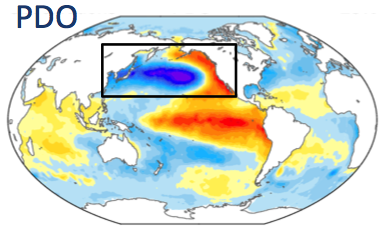
Along with the note from @so_whats_happening, here are the phase maps for both pos and neg PDO.
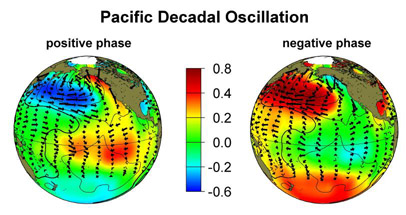
One way to analyze the use of the PDO for this winter would be to look at all El Nino winters that occurred during a negative PDO regime (i.e. a multi-year PDO regime, which is what it looks like we will remain in this winter unless a hard flip occurs) and eliminate the winters in which a rogue -PDO winter occurred within an otherwise +PDO regime. Here is a chart of the -PDO regimes as indicated by the black line.
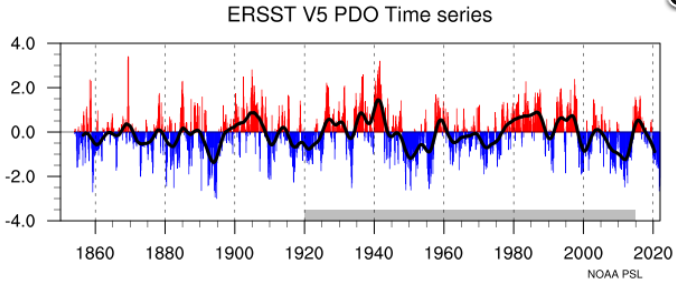
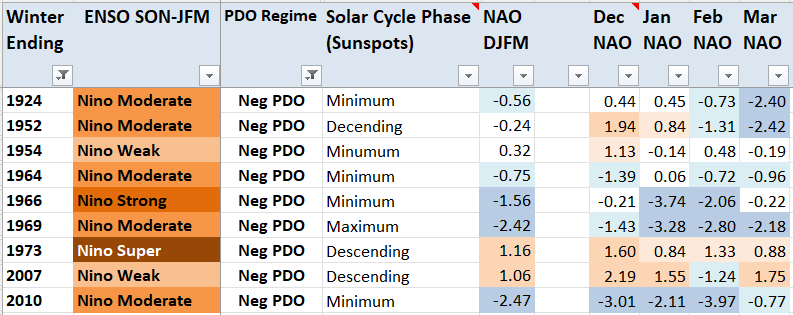
Here I have it in spreadsheet form as well. Note that I didn't give "Neg PDO" regime designation to years that hard a hard flip from Neg to Pos PDO in the Fall/Winter during a Neg PDO regime (e.g. 57-58, 69-70, 76,77) or to years that had a hard flip from Pos to Neg PDO in the Fall/winter during a Pos PDO regime (e.g. 94-95, 04-05 - not shown below)

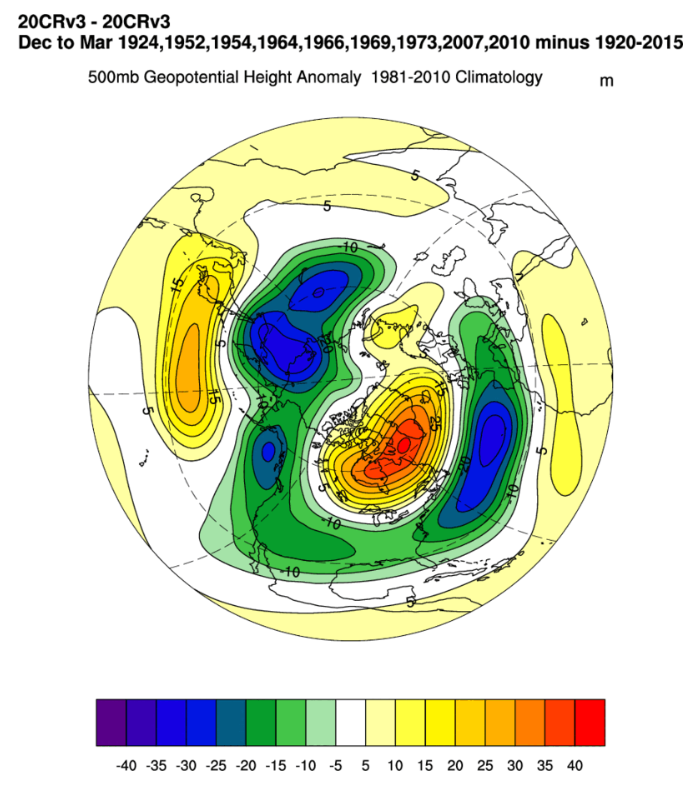
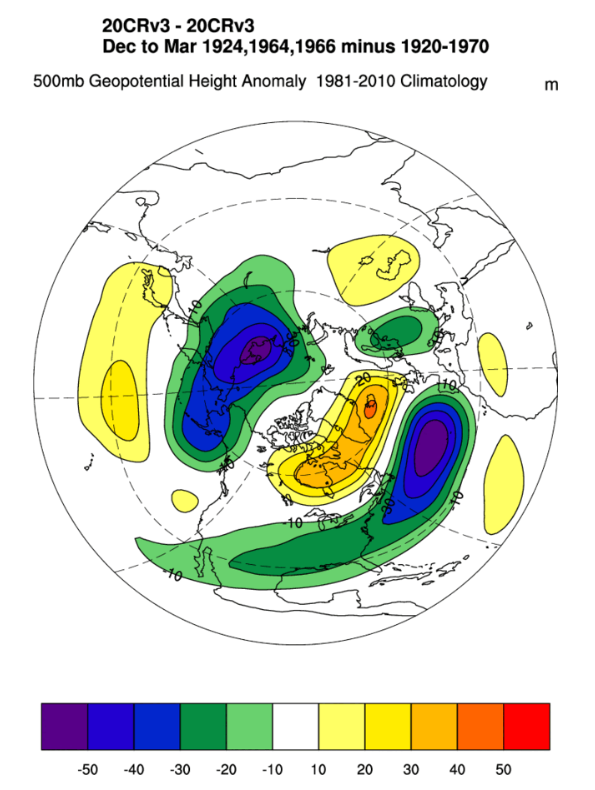
Using this logic, here are all El Ninos that occurred during a -PDO regime, and with the PDO not flipping hard to positive during the Fall/Winter. Note the Central Pacific ridge / West Coast trough.
Same as previous image, but this time I removed all weak and super El Ninos:
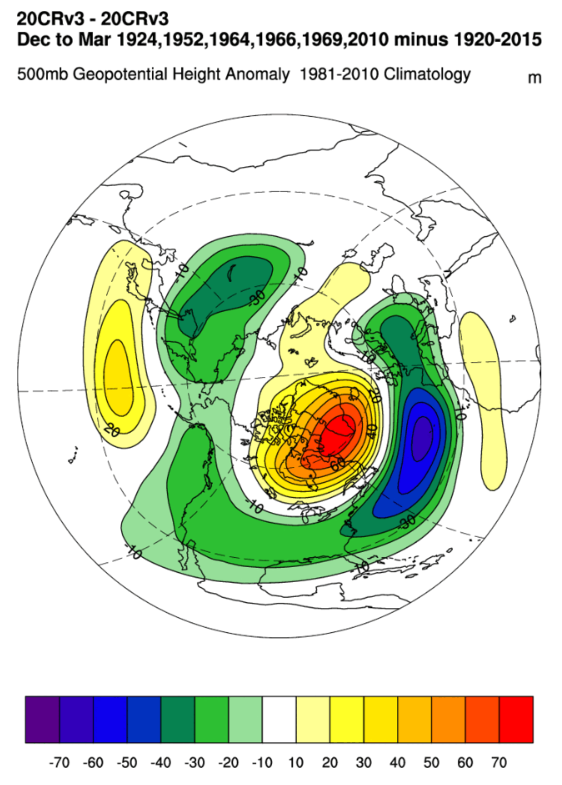
Same as previous image, but this time I removed the 1952 winter due to it being in the descending phase of the solar cycle:
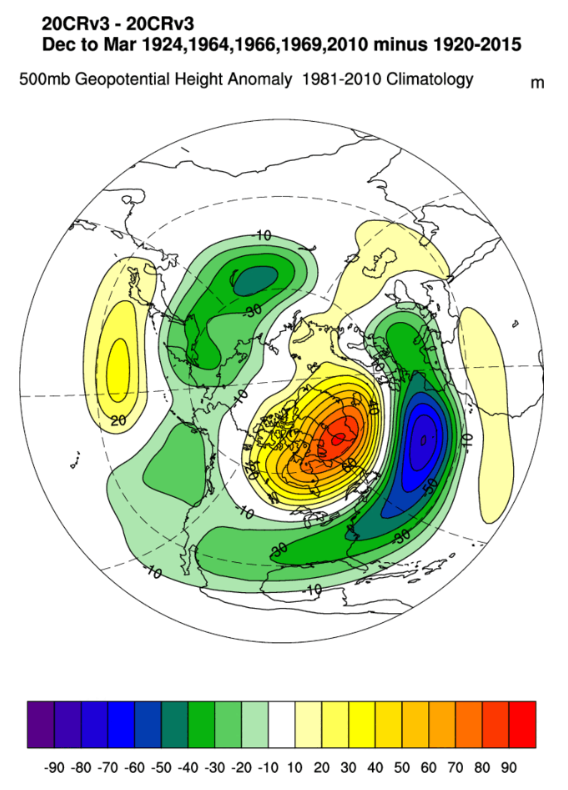
And here in the final one, I removed 68-69 and 09-10 which were extreme -AO/-NAO winters:
Here are all years above in spreadsheet form with various parameters:
Bottom line: Winters occuring during El Nino, -PDO Regime. -PDO, and Solar not in descending phase show a composite pattern of a ridge in the central Pac, trough along the west coast, and split flow across the CONUS underneath west-based -NAO. Assuming the -NAO delivers (-QBO favors it as well), it would be a promising pattern in an enclosed area from the SW states to the S Plains, to the NE, and down to the SE states. Also, after my "ugh" post earlier about the PDO, I am so back for winter based on this analysis. LOLLOL.
I do also enjoy your graphics what site do you use to for those DJFM maps?
I also do the exact same on a spread sheet ever since college that has been my go to setup.
-
1
-
-
12 minutes ago, WxUSAF said:
I’m mostly a novice at this, but seems the -PDO numerical index is mostly driven by the very warm water off Japan, right? The SST map on our side of the dateline looks weakly +PDO to me with slight AN SSTs along the west coast and in the GoA.
Yes with the record waters temps over the summer and the slow fade of them across the Central and West Pacific north of 20 we still have a solid -PDO depiction even with that weakly positive look off the West coast. That weakly positive look should help with flexing of the western ridge with the El Nino state present versus constant troughing when in La Nina but we will have this battle back and forth so long as the warmth near Japan remains constant.
It is nice to see some pockets of cooler waters show up but we need it a bit more widespread to have an impact. Ultimately this could have flipped had we gotten a more robust WPAC tropical season like we typically see in an El Nino year. They would help generate these WWB patterns across the tropics then the models would have been right in there wild predictions early on. The more notable El Nino events all had total tropical activity in the 30+ storm range, I believe we are near 20 or so right now and all have developed relatively close to the Philippines region.
-
4
-
-
Looking at hovmollers we do look to have a nice break in the trades coming up around 4/3.4 in the next week so this should allow the temps to pump up a bit but this only lasts for about 3-5 days before quickly returning to stronger trades as we close out the month. The VP map I don't believe is something we wanna see where it retreats back to the maritime continent again.
The total winds show that the +IOD has probably already peaked and will continue to warm which is a little earlier than other typical IOD peaks but within the timeframe they normally peak so nothing too crazy.
-
3
-
-
Ill also add in the more basin wide look from CPC up to the 9th since it seems to be updating fairly regularly again. In this one you can definitely see the cool pool expand a bit in the WPAC, on the other side of this ongoing WWB.
.thumb.gif.5a20324e08632703f9a658d655ee1cd5.gif)
-
Latest TAO from Oct 15 to current. I will shortly be taking away October as the gifs are becoming long.
.thumb.gif.2ff351035d070e8f87913fc320ff6a18.gif)
-
1
-
-
2 hours ago, griteater said:
It was a good thread from Paul. I asked him a few questions. I mean, I get that the downwelling wave post-WWB will warm both the subsurface and surface as it treks east (and we actually already have one of those ongoing), but IMO, there is a limit to how much this can warm if the westerly anomalies don't sustain themselves or come back in earnest again (not currently shown, but sure, that is out in the future). And with respect to the rainfall / convection moving east, same thoughts, unless this WWB is massive or has follow-up support, I don't see how this event is going to re-configure the base WCell uplift regions which have already established themselves and are well-entrenched. Not to mention, basically every forecast model has them staying put through winter.
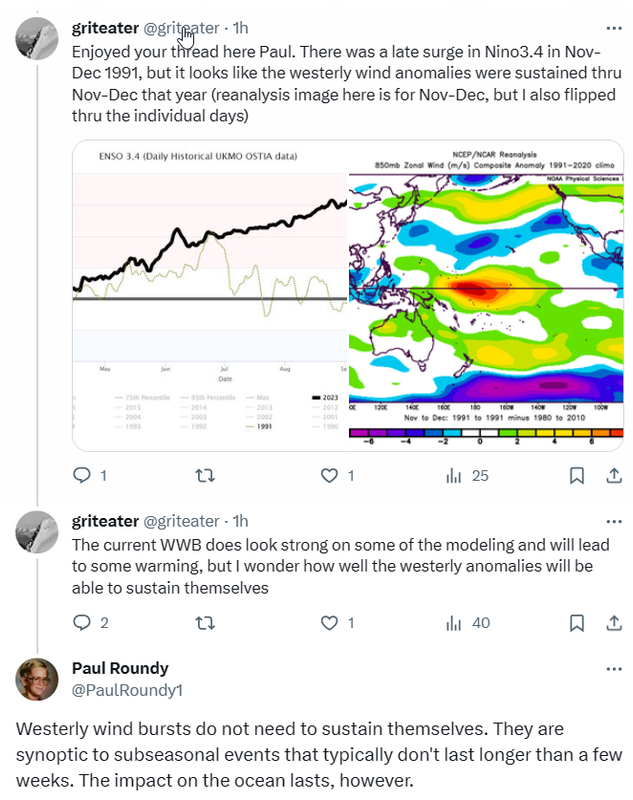
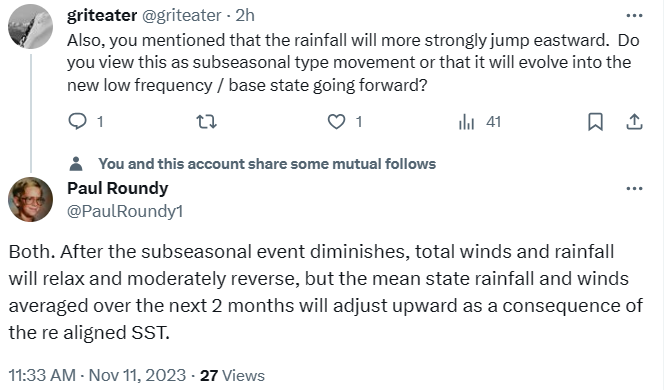
See i dont understand that comment of his with WWBs not needing to sustain themselves. That is exactly what 1997 did so while one WWB event didnt last the whole season it died and another one came right in on its toes to allow this continual warm push eastward.
-
4
-
-
Here is an above look at the averaged 300m anomalies across the globe. You can see the westward shift in OHC and differences in coverage versus max/min points.
-
2
-
1
-
-
8 minutes ago, GaWx said:
I’m not trying to rip TAO at all. I love the TAO site and the ability to graph it with so many options. It is fantastic and I love your animations. Please keep them coming! And I like both the CPC OHC chart and the CPC monthly table. I like it all. When I say they’re not in sync, I’m not saying that to rip any of the datasets. Im just noting it for discussion purposes as we try to figure out whether or not the OHC top is in using the various datasets.
I did email someone with NOAA asking if the monthly table is based on 5N to 5S. I’ll post about it if I get an answer.This was located under the ENSO page in the red writing under subsurface tropical Pacific analysis.
https://www.cpc.ncep.noaa.gov/products/GODAS/
Has a good bit of past data to about 1979-Present, it has a Pentad data and this is what I found for a cross examination between August 26 and Nov 4th of directly at the equator. I can only go back three months as of checking it out now, can dive in more to finding further back dates. If we had more solid anomalies in the eastern Pac with the current DWKW temps I would say we probably would have been near the June highs but the eastern regions continue to cool. This probably gives a better look to OHC from the perspective of CPC because it is from their site. Definitely a book mark worthy site.
This is specifically at the Equator and can not change the domain to be 2 N/S or 5 N/S cross section.
.gif.693a463b4b64bd39dcfc77eaeca17b91.gif)
-
1
-
-
5 minutes ago, GaWx said:
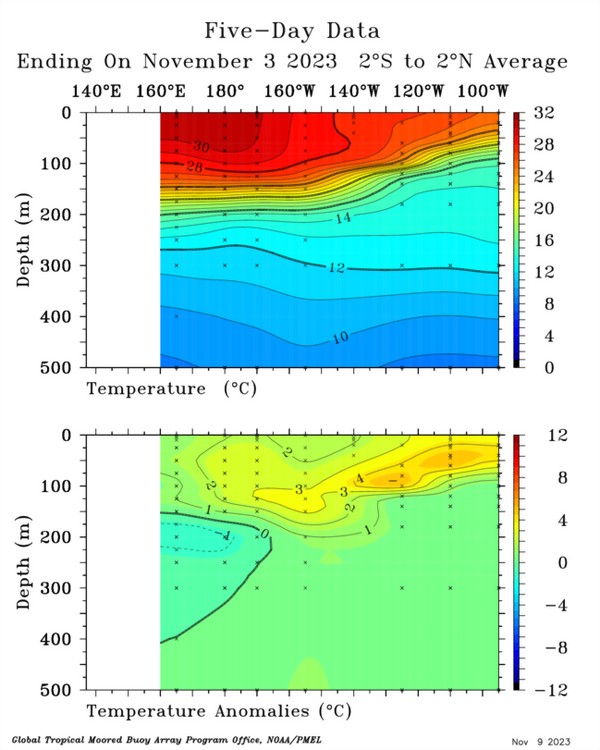
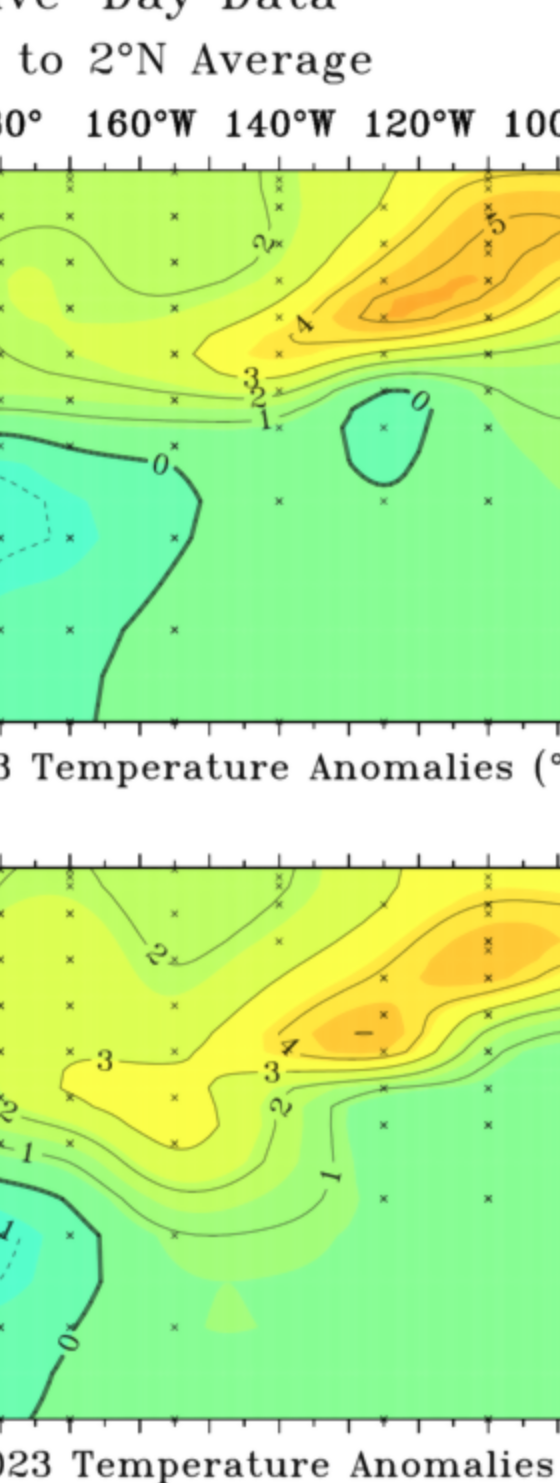
Aug 25th looks a little warmer than June 21st. However, I still have Nov 3rd a decent amount warmer than Aug 25th with most of the W half warmer (some much warmer) and a smaller area colder (mainly eastern 25% within the upper 100 m).
Yeah, I realize that the CPC OHC chart is a bit warmer in late Aug vs 11/3 (+1.25 vs just under +1.20). The comparisons for those two dates for NOAA (warmer) vs TAO (cooler imho) aren’t in sync.Again covering a 5N to 5S will be different than covering a 2N to 2S in a region. I can easily stop posting TAO data if that is what you are hinting at and simply go off an OHC chart.
There are bound to be differences between the two different sources I don't understand the discrepancy here other than the two not in sync which again makes sense since they are not covering the same areas equally. If CPC did in fact cover 2N to 2S then by all means rip apart TAO data but they are not the same in coverage area.
-
Keep expanding those waters and dip the thermocline more and we will match June soon enough. It looks like maybe getting close to +2C anomaly in 3.4 toward the middle to end of month is getting more likely. Again sustainability is in question but if we do get a little burst of a +AAM atmosphere mode like we saw back in March and May it could lead to the positive push that has been talked about. The hope is the Westerlies do not die before then, otherwise it will just be another quick spike.
Here is just a four day difference in GFS modeled Hovmollers you can see the area across Nino regions is opening up a bit which should allow the warming to start up again. The overall WWB is weaker than what was originally forecasted just four days earlier not a thing you wanna see a weakening WWB as we get closer. The IOD region is the one that is far more noticeable in change as we head to the end of the month. Maybe a fluke run but that would be an ending of trades across that region.
.thumb.gif.2790b22a12ec9ea3a1b8dc8f83f6e56f.gif)
.thumb.gif.feb5ceb2796e35d90be7c2703049e7d6.gif)
-
1
-
-
13 minutes ago, GaWx said:
Thanks. Nice! I was trying to do that but couldn’t figure out how.
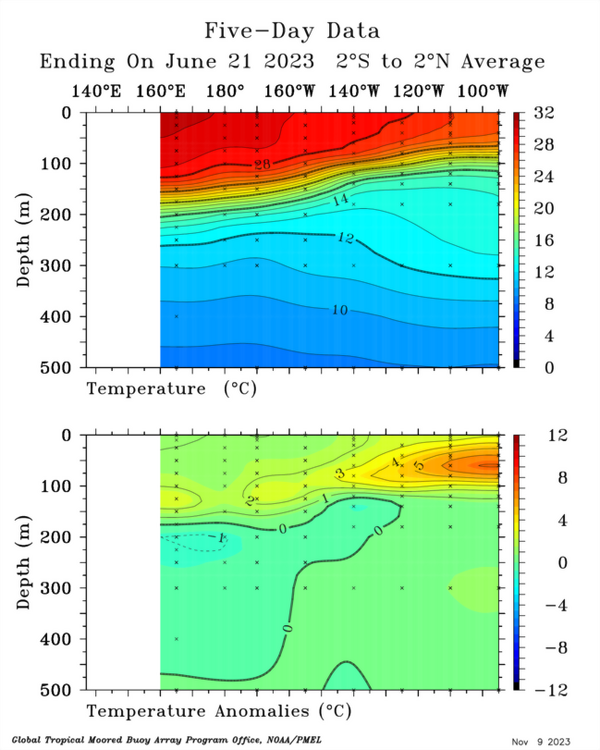
Looking closely at the comparison again, practically the entire volume from 180 to 125W is warmer on Nov 3rd vs June 21st. In much of this volume, it is 1C warmer with a large portion of the volume between 135W and 160W and 100-175m deep 2+ C warmer. That adds up to a lot of water that’s much warmer. OTOH, most of 100-125W between 50m and 125m is colder vs June 21st with it as much as 3.5 colder near 100W within 60-90 m of depth.
So, indeed that E water in a portion of the upper depths is colder with some much colder. But that colder volume is <10% of all of the water vs ~65% (~7 times as much water) that is warmer. So, despite some of the colder anomalies being up to 3.5 colder vs the warmer being no warmer than 2.5 warmer, it isn’t nearly enough to overcome the warmer water. That’s why I feel Nov 3rd is overall significantly warmer than June 21st on TAO.
Again I get where you are coming from but it is not there yet as for overall OHC value when comparing the two June is still higher even with it placed differently. Here is August 25 in comparison to Nov 3 which if using CPC OHC chart end of August peaked at just about 1.25 area which right now we are just under 1.2.
-
1
-
-
On 11/8/2023 at 9:37 AM, griteater said:
Griteater’s Winter Outlook (23-24)
Link to PDF: Griteater's Winter Outlook (23-24).pdf - Google Drive
BTW just got the chance to read your forecast. Good insight and thanks for the MJO plot link. Best of luck on your forecast!
-
1
-
-
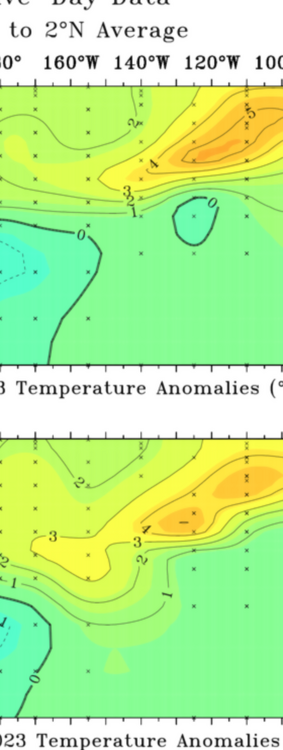
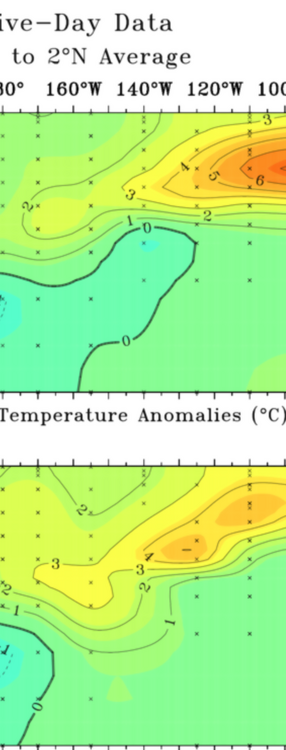
Im not sure if you knew but you can use two dates to compare here is a comparison of the two dates June 21st is the top and Nov 3rd is the bottom. I narrowed it down to only showing 100-180W and only the upper 300m.
-
1
-
1
-
-
7 hours ago, GaWx said:
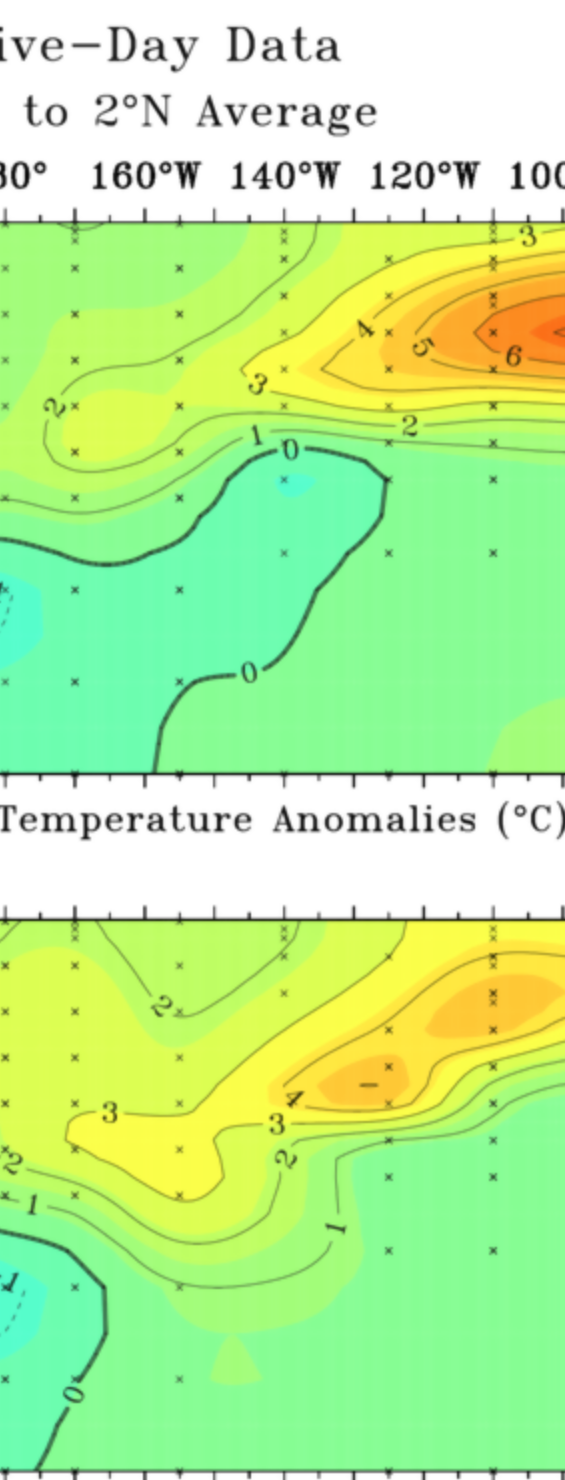
So, we seem to agree that TAO and CPC aren’t in sync. Looking at the 5 day periods you just posted in the portion down to 300m (which is the portion that both the monthly NOAA table and the time series graph both pertain to), Oct 30-Nov 3 is overall warmer than June 17-21. The only portion that is cooler is 100-120W.
Here’s the latest, Nov 4-8. Based on eyeballing estimates, I don’t see how the weighted average of 100-180W, 0-300 m (all of this graph except the leftmost 20 degrees) isn’t at least close to +1.50 per TAO and likely about the warmest yet this El Niño per TAO:
So, if TAO is now at about its warmest for this Nino, is the true OHC now at its warmest this Nino? Shouldn’t that be considered as a realistic possibility? I assume TAO data is credible.
Sure I guess we agree to disagree. I would contact CPC to know more about the formats they use but you have to also remember intensity does help compensate for areal coverage and both together add even more to the values. I wouldn't call this the warmest the event has been but again we can agree to disagree.
In June we were cracking +6 anomalies where we barely have a +5 showing up now but overall more +3 than back then.
To add onto this here was CPC Subsurface from end of June to end of August you can see the areal coverage has overall been about the same but the intensity of these pockets has waxed and waned literally the same thing that was shown on TAO. By the same argument of using the look at it approach shouldn't August have been warmer OHC wise versus June?
Again the best thing to do would be contacting CPC to get a better idea of the domain used for their OHC graph, Im sure they would gladly help you out with that. I could maybe ask the guy I work with but he is in a different department (OPC) so he might not have a solid answer.
-
6 minutes ago, so_whats_happening said:
Why would the TAO be in sync with CPC they are two different sources of data, even though they are observing the same thing. It is just like looking at the differences in OISST to CRW SST's they are different while doing the same thing. If you wanna compare apples to apples use something on CPC, unless CPC has an archive somewhere that I am not aware of this is the closest you will get to what is being portrayed back in time.
As for the differences from a monthly stand point of June to a 5 day average in November maybe it is best left to compare to another 5 day period not a month. If the month for November comes in at 1.4 similar to June then we can compare the monthly average. This is what 1.35 value on CPC page looks like in June for a 5 day average for TAO. This is what around 1.2 looks like to CPC site which updated to Nov 4th. Also a not quite as high peak in late August about 1.25 lets say

This was the CPC update for Nov 4th which is the latest the OHC is likely updated until.
-
2
-
-
1 minute ago, GaWx said:
I’ll come back to comparisons to past El Niños later. But I’m first asking you to compare Nov 3-7 of 2023 to June of 2023, which is what I showed in my post done ~45 minutes ago. The Nov 3-7 depth chart showing 100W to 180 from 0 to 300m is significantly warmer overall than that for June. The only portion that was cooler on the Nov 3-7 is 100-120W in the uppermost 125m, which is only ~10% of the volume. ~70% of the volume is warmer on Nov 3-7. The other ~20% is about the same.
How could the Nov 3-7th depth be so much warmer than June when June is by a good margin the warmest month of 2023 to date per the OHC time series graph? They don’t appear to be in synch, which is the point I’m making.Why would the TAO be in sync with CPC they are two different sources of data, even though they are observing the same thing. It is just like looking at the differences in OISST to CRW SST's they are different while doing the same thing. If you wanna compare apples to apples use something on CPC, unless CPC has an archive somewhere that I am not aware of this is the closest you will get to what is being portrayed back in time.
As for the differences from a monthly stand point of June to a 5 day average in November maybe it is best left to compare to another 5 day period not a month. If the month for November comes in at 1.4 similar to June then we can compare the monthly average. This is what 1.35 value on CPC page looks like in June for a 5 day average for TAO. This is what around 1.2 looks like to CPC site which updated to Nov 4th. Also a not quite as high peak in late August about 1.25 lets say
-
1
-
-
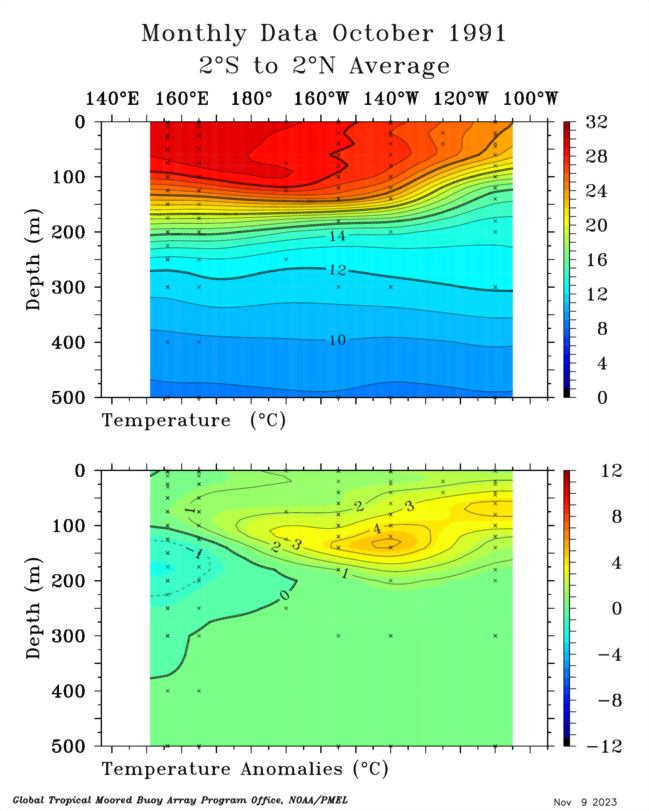
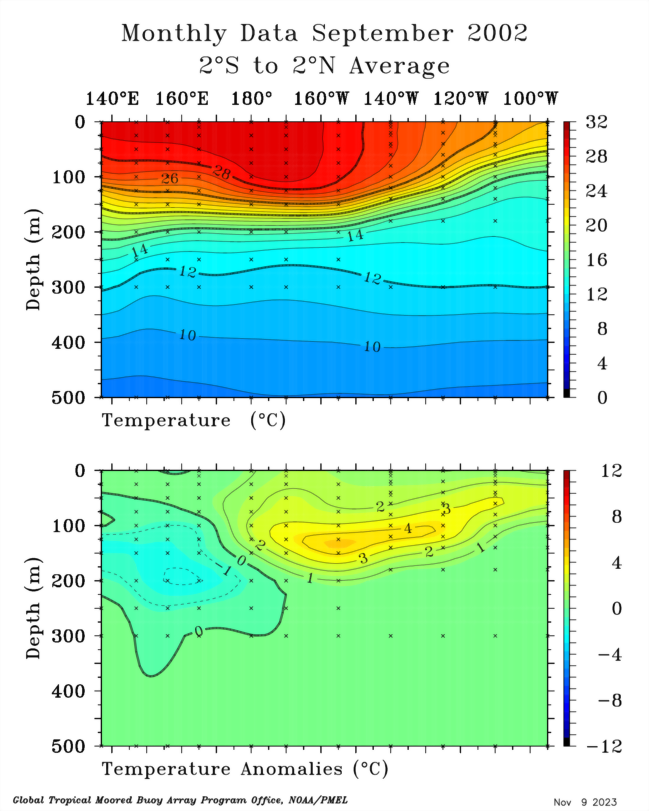
12 minutes ago, GaWx said:
I don’t think you’re seeing what I’m seeing. I would post a gif animation of the two, but it is way too fast when I do it. Do you know how to slow down a gif animation from IPhone gallery still images?
These were a 1.4C anomaly from the same website on October 1991, September 2002. This was the time period at the end of April that had a peak almost exactly where the graph shows for OHC currently.


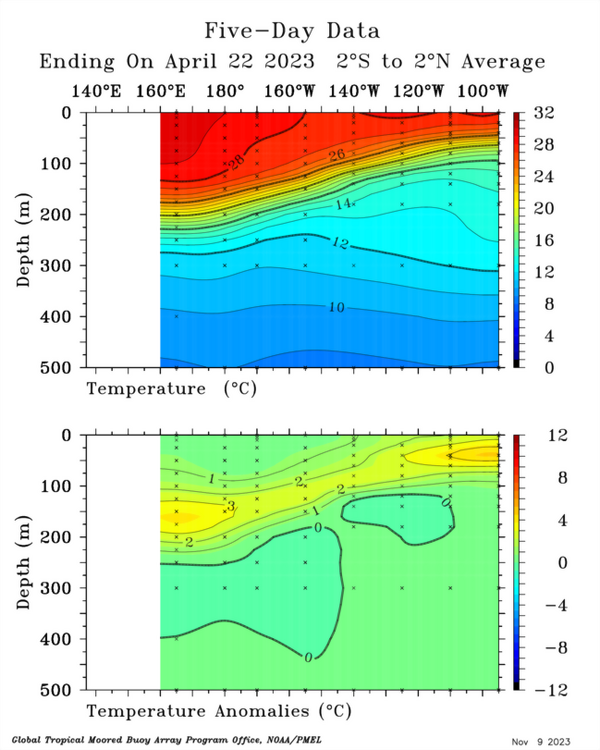
.gif.43ad64c35d4a0a8b10c2240af7882164.gif)


.gif.fe433d354caabe170b17595db8c94527.gif)
.gif.52905effa36d83ee6601bb662ba85eb7.gif)
.gif.7bdc117ad3c902caef5829a5c7d20313.gif)
.gif.e1cc7d49a7e7dc2ac3396ed55ead86f1.gif)


El Nino 2023-2024
in Weather Forecasting and Discussion
Posted
Also definitely some interesting moves taking place in the TAO data.