

so_whats_happening
-
Posts
1,348 -
Joined
-
Last visited
Content Type
Profiles
Blogs
Forums
American Weather
Media Demo
Store
Gallery
Posts posted by so_whats_happening
-
-
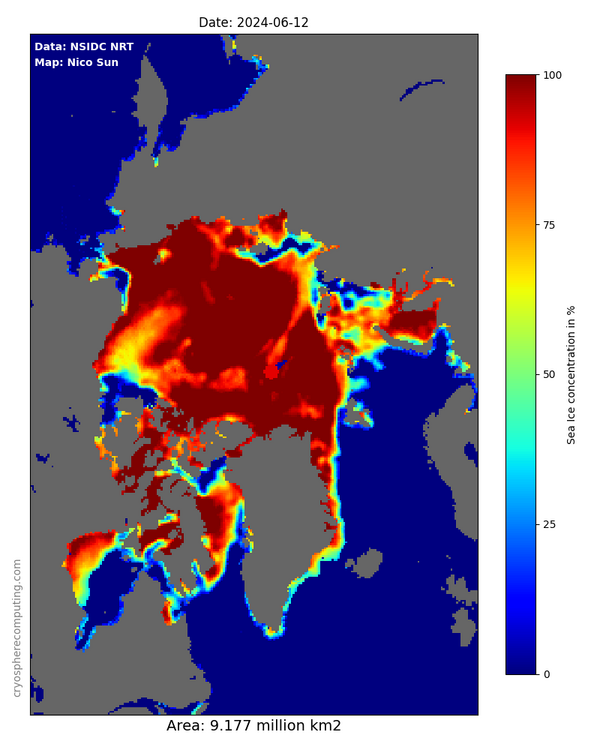
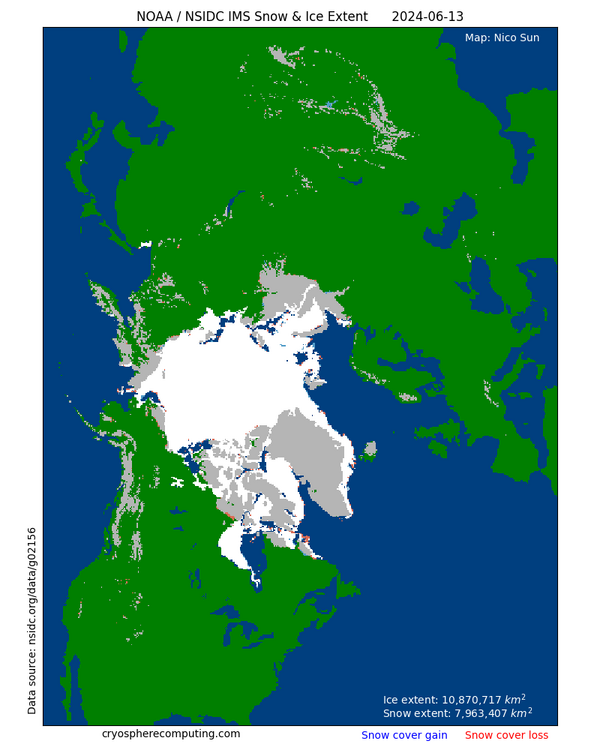
This is a visual/graphical perspective for folks for each region. I am kind of surprised to see the Kara sea region holding a bit more ice than past seasons (at least of recent) for this time of year. One thing for sure that seems to be helping it out is the snow in the surrounding lands has not melted out yet so another visual of how snow impacts the overall health of the ice into summer time. Snow near the Chukchi/ ESS region also holding on a bit.
https://cryospherecomputing.com/regional.html
Things may try to steady out a bit coming up here in the CAA and Beaufort regions maybe leading to less overall decline but that region is looking rather ragged.
Is the Labrador sea grouped in with CAA data?
-
On 6/6/2024 at 5:29 PM, Roger Smith said:
Table of forecasts for June 2024
FORECASTER _____________ DCA _ NYC _ BOS __ ORD _ ATL _ IAH __ DEN _ PHX _ SEA
Scotty Lightning ___________+3.0 _ +2.5 _ +2.0 __ +1.5 _ +2.0 _ +2.0 __ +1.5 _ +1.5 _ +1.0
BKViking ___________________+2.2 _ +2.3 _ +1.7 __ +0.8 _ +2.0 _ +3.0 __ +2.5 _ +1.8 _ +1.0
RJay __________ (-2%) ______+2.0 _ +2.0 _ +2.0 __ +2.0 _ +2.0 _ +2.0 __ +2.0 _ +2.0 _ +2.0
rainsucks __________________ +2.0 _ +1.8 _ +1.7 __ +2.4 _ +1.5 _ +2.0 ___ +2.4 _ +1.8 _ +1.3
Rhino16 ____________________+2.0 _ +1.5 _ +1.8 __ +3.0 _ +3.2 _ +2.1 ___ +5.0 _+5.5 _+1.5
Roger Smith _______________ +1.5 _ +1.6 _ +0.9 __ +2.0 _ +2.3 _ +4.0 __ +3.5 _ +2.5 _+1.2
Tom ________________________+1.2 _ +1.3 _ +1.3 __ +0.9 _ +1.3 _ +1.8 ___ +1.7 _ +1.7 _ +0.6
___ Consensus ____________ +1.0 _ +1.3 _ +1.1 __ +1.0 _ +1.4 _ +2.0 ___+1.8 _ +1.8 _ +1.1
hudsonvalley21 ____________ +0.8 _ +1.2 _ +1.1 __ +0.3 _ +1.6 _ +2.2 __ +2.1 _ +1.4 _ +1.5
so_whats_happening ______ +0.6 _ +0.7 _ +0.9 __ +0.5 _ +1.0 _ +1.2 __ +1.5 _ +1.5 _ +1.0
DonSutherland1 ____________+0.5 _ +1.0 _ +1.0 __ +1.0 _ +0.3 _ +1.0 __ +1.2 _ +1.0 _ +0.5
wxallannj ___________________+0.5 _ +0.7 _ +1.0 __ +1.0 _ +0.5 _ +2.3 __ +1.5 _ +2.1 _ +1.5
RodneyS ____________________ 0.0 _ +1.1 _ +0.3 __ -1.8 _ -0.5 _ +0.9 ___ +1.6 _ +0.6 _ +0.6
StormchaserChuck1 ________ 0.0 _ +0.2 _ -0.3 __ -0.5 _ +0.8 _ +1.0 ___ +1.6 _ +1.8 _ +0.7
___ Normal _________________ 0.0 __ 0.0 __ 0.0 ___ 0.0 __ 0.0 __ 0.0 ____0.0 __ 0.0 __ 0.0
wxdude64 __________________-0.8 _-0.2 _ +0.7 __ -0.3 _ -0.4 _ +0.5 ___ +2.1 _ +1.7 _ +2.1
________________________
warmest and coldest forecasts color coded, Normal is colder than all forecasts for IAH, DEN, PHX and SEA
==============
Seasonal max contest
FORECASTER ____________ DCA _ NYC _ BOS __ORD _ATL _IAH __ DEN _PHX _SEA
Scotty Lightning __________ 103 _ 100 __ 98 ____96 __ 104 _ 118 ____ 100 _ 121 __ 92
wxdude64 ________________ 102 _ 102 _ 102 ___ 101 __ 101 _ 106 ____ 104 _ 118 __ 98
Roger Smith _______________102 _ 100 _ 100 ____101 __ 101 _ 109 ____ 104 _ 119 __ 97
rainsucks __________________102 _ 100 __ 99 ___ 104 __ 102 _ 107 ____ 104 _ 120 __99
hudsonvalley21 ___________ 101 _ 101 __ 99 ____ 95 ___ 98 _ 103 ____ 100 _ 119 __ 98
Rhino16 ____________________101 _ 100 __ 99 ___ 102 __ 102 _ 106 ____ 100 _ 115 __ 98
___ Consensus ___________ 101 _ 100 __ 99 ____99 __ 101 _ 106 ____ 100 _ 119 __ 97
DonSutherland1 ___________ 101 _ 100 __ 98 ____ 96 ___ 97 _ 104 ____ 101 _ 118 __ 97
Tom _______________________ 101 __ 98 __ 98 ____ 99 ___102 _ 106 _____ 99 _ 118 __ 96
RJay _______________________100 __ 98 _ 100 ___ 100 __ 101 _ 105 ____ 100 _ 119 __ 95
so_whats_happening ______100 __ 98 __ 97 ____ 95 ___ 99 _ 102 ______98 _ 119 __ 97
RodneyS ___________________99 __ 99 __ 97 _____ 96 ___ 97 _ 102 _____ 99 _ 118 __ 97
wxallannj __________________ 98 __ 98 __ 96 _____ 99 ___ 97 _ 102 ____ 101 _ 120 __ 95
(not entered yet? you can post seasonal max to June 15 _ any of above can also be edited to June 15)
Will add final consensus values June 16
Going to bump Boston to 100 instead of 97 and ORD to 97 instead of 95 if I read the little note correctly.
-
 1
1
-
-
On 11/11/2020 at 5:46 PM, Winter Wizard said:
I know this is an old thread (and unfortunately not a ton has changed over the past decade), but my two cents is if you're going to get a degree in Meteorology, it is important to supplement it with another marketable skill. Those include programming, GIS, business/finance, etc. depending on the path you choose. There is a lot of talk about how bad starting salaries are in this field and yes, there is a lot of truth to that, but you can do well if you look into the right places and are willing to expand your horizons.
If you want to go on TV, you are looking at salaries in the 20s or low 30s to start and will likely have to move to a small town in a different part of the country. There are opportunities to move up, but those jobs are highly competitive, so you will really have to hustle. Ultimately, due to low wages and station politics, many end up leaving this sector after a few years. If you end up in broadcast, I would recommend not getting fixated on market size; rather, focus on where you can get the most on-air experience. That will help you eventually move up.
The next main sector is operational forecasting and I'm bearish about long-term prospects here. Salaries are about the same or slightly higher than broadcast, but in many cases barely a livable wage and laughable for the work put in for the degree. You will be required to work overnights and weekends at most companies and this can take a major physical and mental toll. Not much upward mobility. NWS is a similar deal, however, the pay and benefits are much better and increase over time. To get in, you will likely need a couple years of experience in a private sector job or a Master's. Additionally, with automation becoming more and more prevalent, the demand for a large team of human forecasters is likely to decline, although there will still be a need. Overall, operational forecasting is a good way to get into the industry, but probably best to leave after a couple years.
What has changed in the past 10 years is the emergence of the Weather Risk sector. This is a program only offered at a few schools; Penn State pioneered the program and others have recently added it. Weather risk involves sectors including catastrophe modeling, travel risk management, energy and commodities, insurance, reinsurance, etc. In these sectors, the salaries are much higher (can easily pull six figures) and demand will continue to increase as businesses are forced to adapt to climate change. Overall, if you are planning on getting a degree in Meteorology, this is definitely the most fruitful path, BUT it is highly competitive.
Long story short, I would say reconsider majoring in Meteorology if it forces you into tens of thousands of dollars into student debt and you end up in a sector with little-to-no upward mobility. The Math, Physics, Chem, Programming, Stats, and Business (in weather risk) classes you are required to take gives you a variety of skills that can easily be applied to other fields outside of Meteorology. If you do go through with the major, please consider the various sectors above and do what you can to network, get internships, and become involved in extracurricular activities in college so you can be a strong candidate once you graduate.Sound advice and looking back after being out of school for nearly 9 years I can say I don't regret it one bit but it is tough out there trying to push into certain sectors. I would say don't be afraid to look outside the box so to speak as you may find something you never would have thought to be fruitful but has treated you well through the years.
The bold is by far the most important thing I would ever recommend to anyone pursuing the degree. About to start in a program for my masters and hope to be able to get the next leg up needed to push further into Meteorology.
Network, Network, Network!
-
 1
1
-
-
10 hours ago, bluewave said:
I think the concept of what qualifies as a good or great La Niña winter has been diminishing over time as the winters have been steadily warming. For the posters around NYC Metro 95-96 was the gold standard in terms of wall to wall cold and snow from November into early April. This was followed by our first global temperature spike in 98. So while 10-11 was still an amazing winter, the snow cut off about a month too early to challenge 95-96 around NYC. Not as cold as 95-96 was from November into April but no complaints due to the epic snowfall from late December to late January. Then the next big global temperature spike in 15 and our next multiyear La Niña in 16-17 and 17-18. The 17-18 winter was very snowy but not up to the levels we saw back in 10-11 around NYC. March was really special though especially out east on Long Island. This was the first time we had an 80° reading in February around NYC and the record warmth allowed the decent cold anomaly from after Christmas into early January to essentially get erased. Our better La Niña winter in 20-21 featured the best snowfall outcome of the 2020s so far. But it was also our warmest winter around NYC with so many -AO days along with a -5 or daily AO reading. So even with such great blocking which could be likened to a weaker reflection of 10-11, we still finished a little above normal against an already warmest new 91-20 climate normals period. Plus we had the very warm Christmas flood cutter and flash melt which damaged the ski resorts.
The warmer La Niña winter pattern began to emerge in 05-06. Great snowfall outcome around NYC but the January warmth was so strong the winter finished above normal. This was followed by the milder 07-08 La Niña and less snow but not so bad by modern day poor La Niña standards. Then the 11-12 La Niña winter with a combination of lack of snow and warmth. But still not bad as 22-23 for warmth and lack of snow. 16-17 had great blizzards but was still near a 40° winter around NYC. 21-22 was split with a good January for snow and cold in an otherwise sea of warm.
So the better La Niña winters have been warming since 95-96 with a decline in snowfall. The poorest outcome La Ninas have also been warming and loosing snowfall. So 22-23 was about as bad as we have seen for both warmth and lack of snow. We have never seen any winter with a December -AO averaging under -2.000 put up such poor metrics for snow and cold.
Now that we have seen another big global temperature spike and the 3rd since the late 90s, I am not sure what a good La Niña winter will look like after the most recent temperature spike. But I am also concerned what a poor outcome winter La Niña outcome will look like in the against this new higher global temperature baseline with the record global 23-24 global temperature rise.
I would be happy if any of the potential La Niña winters in this new grouping put up better snowfall numbers than 22-23 did. But don’t have much expectation that the record 9 consecutive warmer winter streak in the Northeast will end based off of anything I am seeing now in regard to the La Niña and -PDO early development. Will check in after October to see if we get some early snowfall MJO clues based on past La Niña Octobers.
I do remember this winter, was the first winter I remember having severe weather in February (actually had nickel size hail falling and accumulate on the ground) to getting a 18" snowstorm a month later. Was definitely a roller coaster and that seems to be the case going forward at least in terms of what happens around the mid atlantic. We have really really warm periods or really really cold periods (nothing seems too sustained) and really snowy periods or nothing at all and flooded by rainstorm after rainstorm.
Again looking locally only, we do not seem to be able to properly keep the ground frozen for a long period of time anymore. We do get a hard freeze but when temps in the middle of winter don't have a sustained low below 20* for more than a few days it becomes rather hard to keep a solid frozen ground. This rather warm low also makes it a bit difficult sometimes with these systems that have us right along the boundary. What use to be the rain/snow line around 95 has definitely pushed back further NW compared to say just 15 years ago. Much more in the way of mixing situations around my locale when we would manage just to be able to squeak out an all snow event. Just a few things I have noticed more so over the last probably 10 or so years. This is not to say we have never experienced this just that it seems to be happening of more frequency.
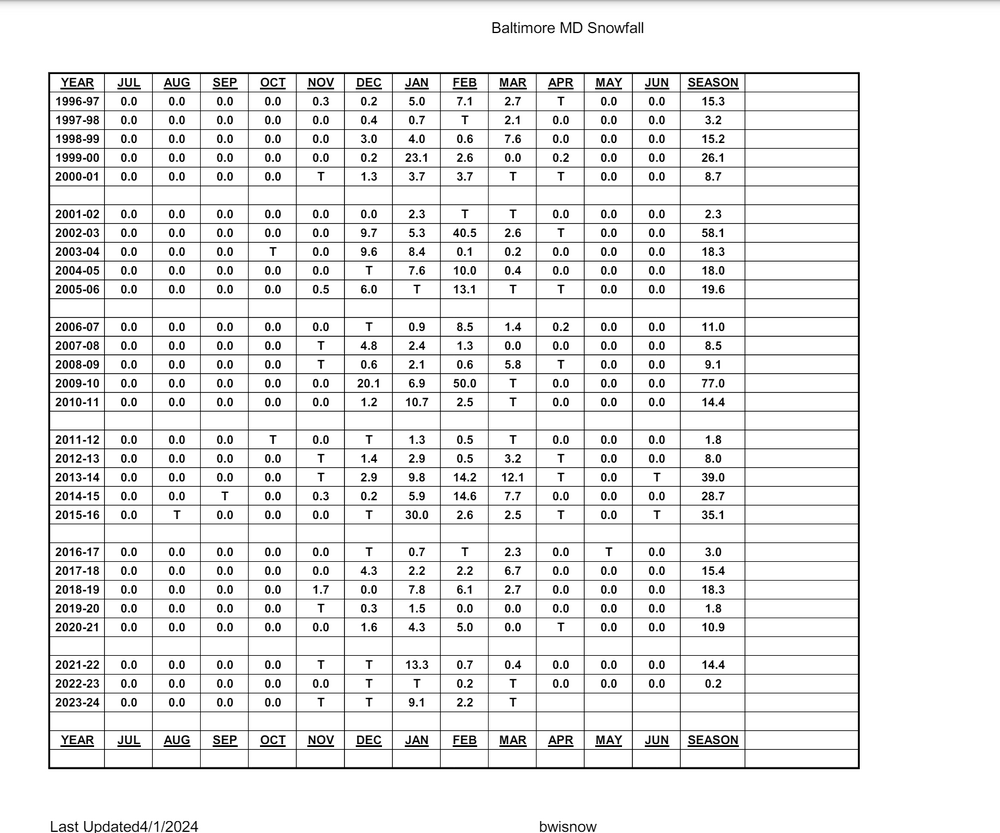
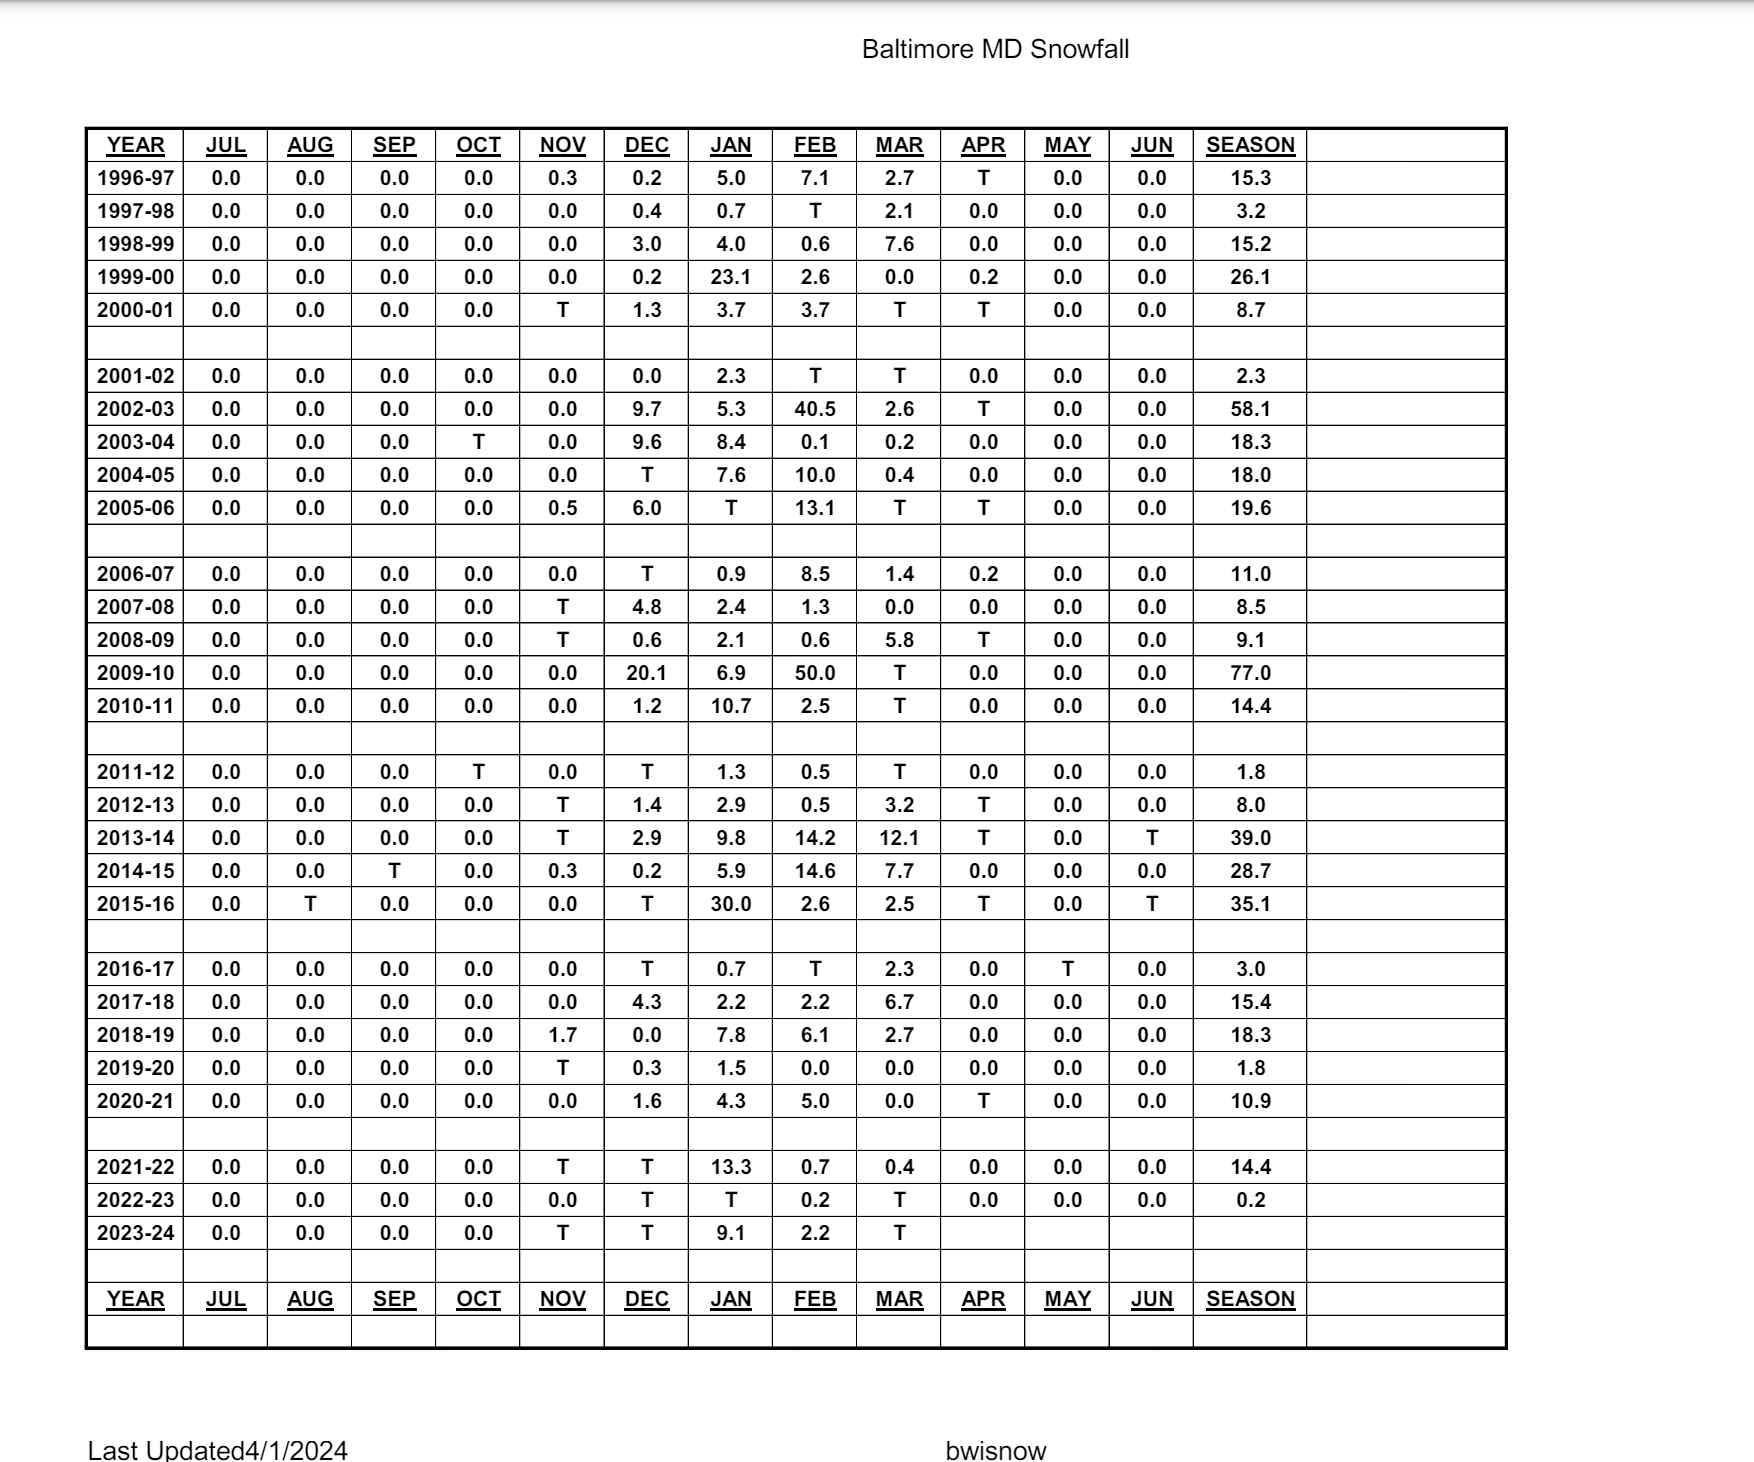
Working at BWI for almost the last 9 years we have had pretty bad snowfall ever since the 15-16 winter and the only reason we got something decent then was because of that monster snowstorm in January of 2016. The last close to average snowfall was 2018-19 with 18.3". We have had quite a few extremely low snowfall years of recent (from about 2000 area on) when they would occur maybe once a decade before.
There does tend to be a noticeable decline in snowfall after these heat spikes have occurred, but unfortunately snowfall can have rather wild swings down here.
https://www.weather.gov/media/lwx/climate/bwisnow.pdf
-
10 hours ago, 40/70 Benchmark said:
I wonder why they haven't update the MEI since April...annoying. If they do that this fall I will lose my shit. lol
Seems like they still are having some data not come in properly. I hope as well this gets straightened out by end of summer.
-
5 hours ago, snowman19 said:
Yea you typically dont have a cooling in the EPAC and the Atlantic. I wonder if this has to do with the ever resilient warmth around the maritime throwing things off a bit.
From looking at some of the past Nina/Nino episodes typically you have a warming EPAC with a cooling WPAC and Atlantic and vice versa when entering Nina state. Since the WPAC just has not cooled maybe we are starting to see a different setup take place? As always a bit too early to tell what will come about.
-
1
-
-
1 minute ago, so_whats_happening said:
That is some impressive forecasted movement to say the least.

Cant post the loop of the Euro because of the file size being just too big, results are fairly similar.
-
That is some impressive forecasted movement to say the least.
-
Anyway here is a little update on the subsurface for the developing La Nina. Just about a months worth of visuals spanning about 4 days in between images. Ill continue this as we go into fall and sporadically update.
Also a look a hovmollers with finally a weak moving MJO wave.
.thumb.gif.64cfe09f65ce5c96793b5cb94ed43921.gif)

-
2
-
-
Is it possible the reduction of sulfur based fuels are finally coming home to roost? China stopped using heavily sulfur based fuels back in 2017 so it is very possible it will start to play catch up to the extreme levels we have seen in the Atlantic and continually grow with time. Time will tell of course.
This will largely create even more disconnect between the tropics and subtropics over time and could very well start to show a lower overall named storm/ hurricane/typhoon count as we go through time as the atmosphere tries to rebalance itself out in this new regime. Just some food for thought while things are still kind of early for the season.
-
DCA _ NYC _ BOS __ ORD _ ATL _ IAH __ DEN _ PHX _ SEA
+.6 +.7 +.9 +.5 +1 +1.2 +1.5 +1.5 +1
100 98 97 95 99 102 99 117 95
-
Just for comparison sake 97-98 compared to 23-24. Winter 500mb seemed pretty spot on as far as placement with key features of course intensities varied spring however does have some similarities thus far but not all the same. Should be interesting to see how we continue into summer.
.gif.6be5a2b5a1b2343d07e32e3e5339dd55.gif)
.gif.21b9490802d7665b95e3ad0e81996cfe.gif)
.gif.0e4a00f5fbf4c53d7f13c2e0d07de292.gif)
.gif.1006b07f995ba1252918ac8d1c8b0cd2.gif)
-
1
-
-
Here was the 500mb pattern from 2/28-5/28
Here is the preceding 3 month period when we were in full swing Nino territory (11/28-2/28)
Changes but notably the ridging has indeed pushed further east into the north Pacific so we may start to see a cooling in time of the WPAC? Especially if we do have a decent typhoon season but yet to be seen as of now. Which I would guess we eek out a typical WPAC season given we are transitioning to La Nina status.
-
Here is the 90 day SST bonkers amount of warm anomalies showing up just south of the Aleutians. This will change over time since there is a 12mb file limit on posts.
-
1
-
-
On 5/29/2024 at 8:43 AM, bluewave said:
It actually seemed to work the opposite way in 2015. That year featured 462 ACE points in the WPAC for the 4th most active typhoon season on record. This was followed by the record WPAC warm pool for a super El Niño in 15-16 and historic December +13 and record MJO 4-6 for such a strong El Niño. So the WPAC has had no difficulty recharging its heat content. We even saw this in recent years with how rapidly the warm pool near Indonesia rebounded following the fall +IOD patterns. At this point I am not even sure what it would take to cool that region for more than a few months at a time.
Accumulated cyclone energy - Pacific typhoon hide Season ACE TS TY STY Classification 1997 570.4 29 23 11 Extremely active 2004 480.6 31 20 6 Extremely active 1992 470.1 31 21 4 Extremely active 2015 462.9 26 20 9 Extremely active Yea the idea should be that an extremely active typhoon season should start to cool these waters but the waters only cooled for about a 2-3 month period (if that) before rebounding quite substantially. I also do not know what it will take for this to break and even more surprising was the fact we were near super levels for an El Nino typically we should have had an above average if not extremely active season, we had what was more of a typical average season if not even a more below average season for the WPAC. One thing of note was that we did not have a lot of strong recurving typhoons last year most were weak when they did recurve so maybe that played a role?
In fact we just had our first system form a couple days ago which is close to the later start timeframes we have seen for the WPAC typhoon season. Surprisingly most after some of the extremely active season of strong/super El Ninos.
1st- 1983 June 8th
2nd- 1984 June 7th
3rd- 1998 May 28th
4th- 2016 May 25th
5th- 2024 May 22nd
-
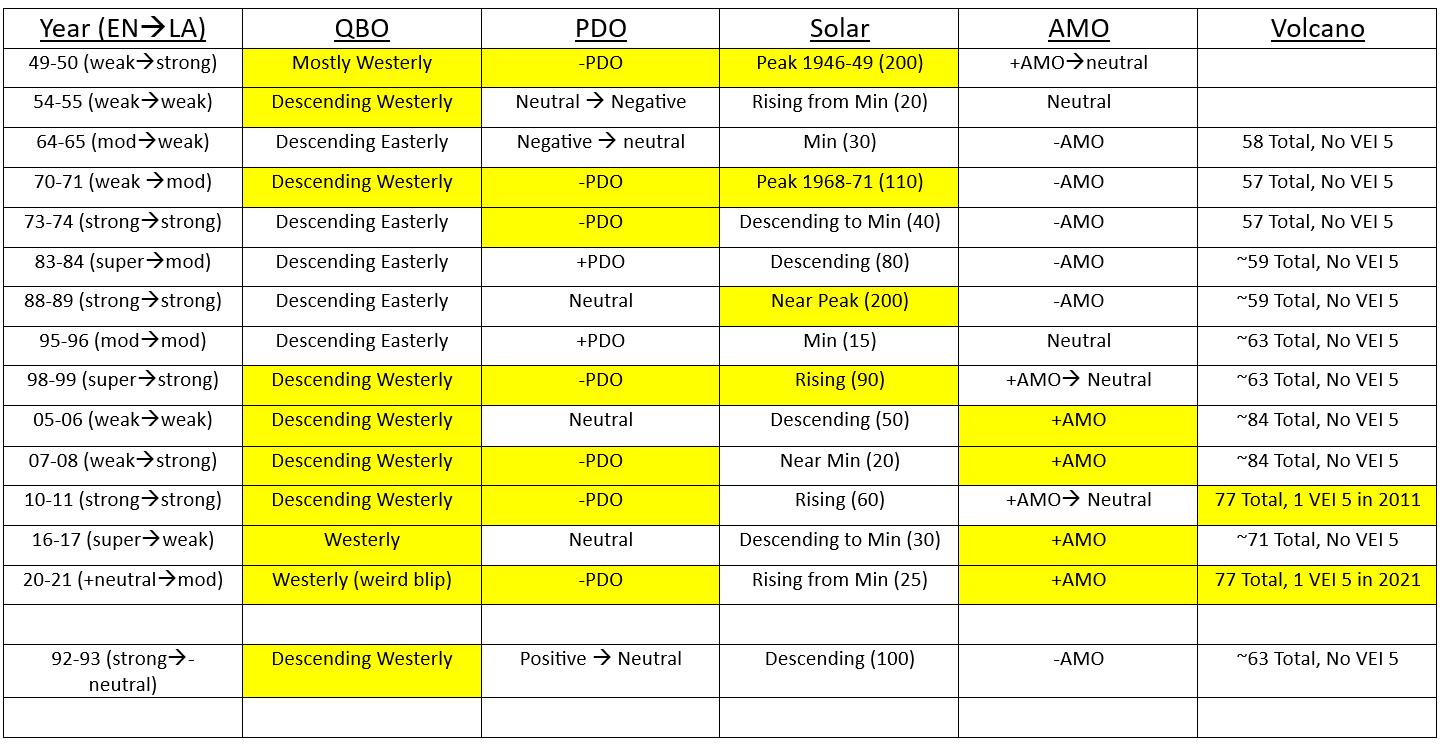
23 hours ago, so_whats_happening said:
Sorry for the delay, yesterday ended up being a lot busier than I expected.
So here is the chart I created for all years going from El Nino to La Nina. I highlighted the years that best fit the request of Westerly QBO, -PDO, High Solar (just noticed 83-84 and 92-93 should be highlighted yellow as they are still rather active years) , +AMO, and Volcanic activity ( a lot of years had a VEI 5 a year or two before the listed ranges). 49-50 QBO was a bit of a guess following the typical ~18 month span of QBO transition, data only went to 1953 for what I have.
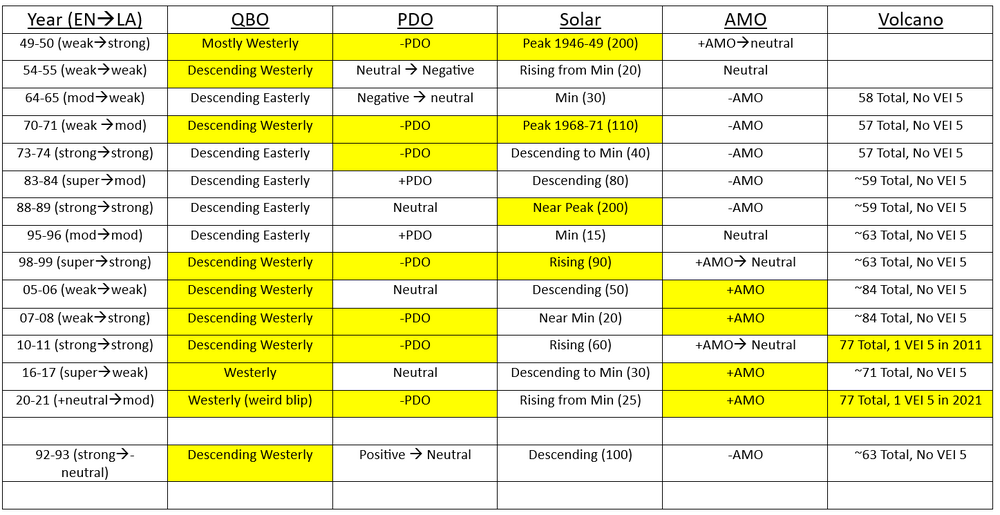
Here are the sites used to help create this table.
Volcano Data - https://volcano.si.edu/faq/index.cfm?question=eruptionsbyyear
ENSO Data - https://origin.cpc.ncep.noaa.gov/products/analysis_monitoring/ensostuff/ONI_v5.php
https://www.webberweather.com/ensemble-oceanic-nino-index.html
AMO Data - https://psl.noaa.gov/data/correlation/amon.us.long.data
PDO Data - https://www.ncei.noaa.gov/access/monitoring/pdo/
Solar Cycle Data - https://www.swpc.noaa.gov/products/solar-cycle-progression
QBO Data - https://www.geo.fu-berlin.de/met/ag/strat/produkte/qbo/qbo.dat
Since ACE has been brought up quite a bit figured I would add this as well: (Named/ Hurricanes/ Major)
https://tropical.atmos.colostate.edu/Realtime/index.php?arch&loc=northatlantic
1949: 16/7/2 96 ACE
1954: 16/7/3 104 ACE
1964: 13/7/5 153 ACE
1970: 10/5/2 40 ACE
1973: 8/4/1 48 ACE
1983: 4/3/1 17 ACE
1988: 12/5/3 103 ACE
1992: 7/4/1 76 ACE
1995: 19/11/5 227 ACE
1998: 14/10/3 182 ACE
2005: 28/15/7 245 ACE
2007: 15/6/2 74 ACE
2010: 19/12/5 165 ACE
2016: 15/7/4 141 ACE
2020: 30/13/6 179 ACE
You can click on each year too to see the tracking map to see what years had solid landfalls. It is interesting to note 1970-71 had a solid cold spill into the US even with low ACE but high solar. 2010-11 had nice cold across the country but large blocking low solar and high ACE. There are definitely odd ball years that arise.
-
1
-
-
2 hours ago, PhiEaglesfan712 said:
For starters, I think we can throw out 1949-50. That one came after several enso neutral seasons (1946-47 is the only one in the previous 5 years that resembled an el nino, but that was very weak and very short). 1949-50 is the last first year la nina that didn't result from an el nino transition.
I don't like the 2020-21 analog either. The preceding el nino (which started in 2018) was weak, and 2019-20 was a unicorn season that hovered around 0.4 or 0.5 until it dissipated (this hasn't happened in over 75; the aforementioned 1946-47 comes the closest).
1970-71 and 2007-08 can be okay analogs. The only thing is the el nino of those preceding years was weak. I guess 1970-71 could pass if you consider the first year of the preceding el nino (1968-69) was moderate.
This leaves 1998-99 and 2010-11 as the best of the six analogs on the list.
I'd replace 1949-50 and 2020-21 with 1973-74 and 1988-89.
My list of six best analogs, at this point, would be 1970-71, 1973-74, 1988-89, 1998-99, 2007-08, and 2010-11.
Agree on 1949-50, just had a completely different subsurface going on than any of these other years. 20-21 wasn't too bad of a year think the low solar really helped that year out a lot. If we are strictly going off the idea of a stronger Nino to a mod/strong Nina we take out 1970-71 and 2007-08 as while they did go to mod/strong Nina status they came off relatively weak Nino states just like 20/21 and 1949-50 did.
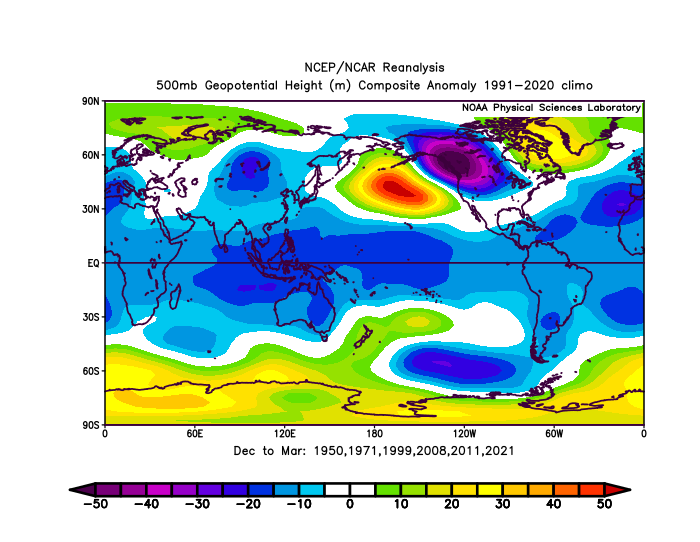
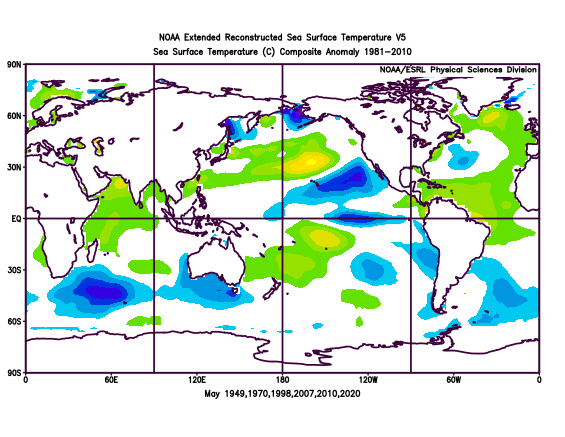
Here is what the overall 500mb pattern looked like placement overall was still relatively similar of course the most notable difference is the Atlantic pattern as we did have a couple low solar years tossed in there (07-08,20-21). I also got a SST reconstruction for each set of years for may conditions leading into those winters. Not making conclusions which will turn out better as they both seem pretty similar just wanted to present the data with them.
The one with the warmer equatorial pacific matches with the years coming off strong Ninos to strong Ninas.
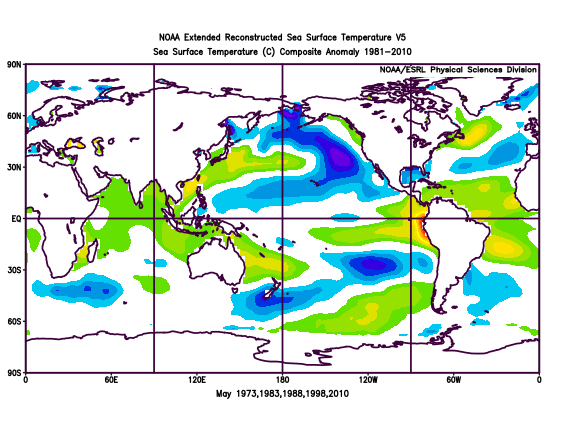
The cooler pacific was the group of years I had used in the previous post.
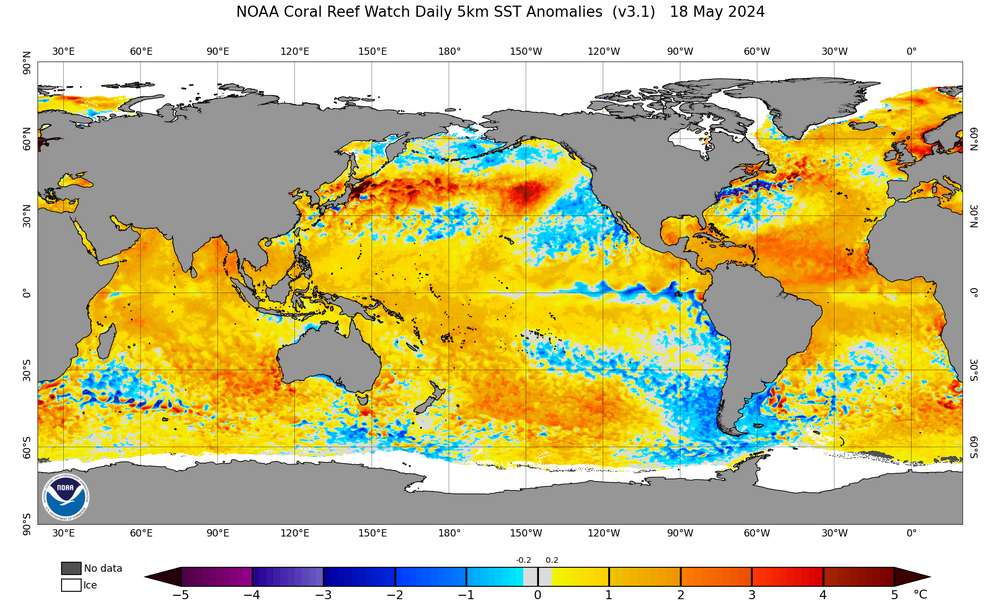
Here is the current daily SST anomaly.
-
Again sorry for all the posts but one final one. If we combined all the years mentioned above we get not a bad look to what may be to come. Maybe warm it by about a degree?


-
3
-
-
Whoops just realized I left out 2007-08 so six years (1949-1950, 1970-1971, 1998-1999, 2010-2011, and 2020-2021)
-
Just now, so_whats_happening said:
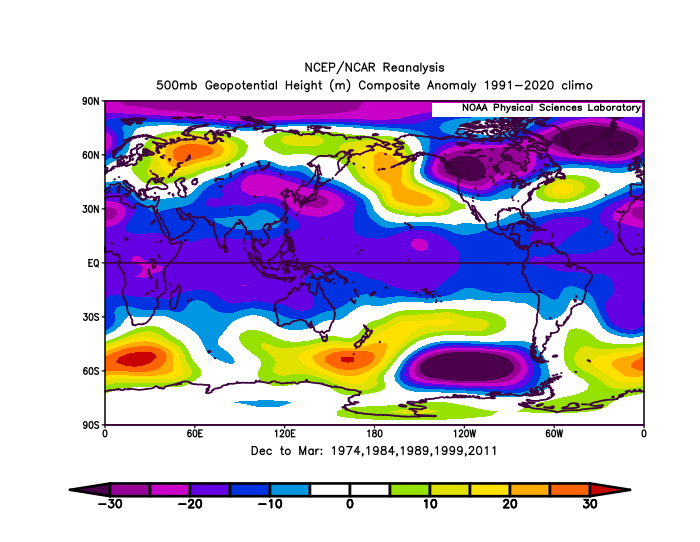
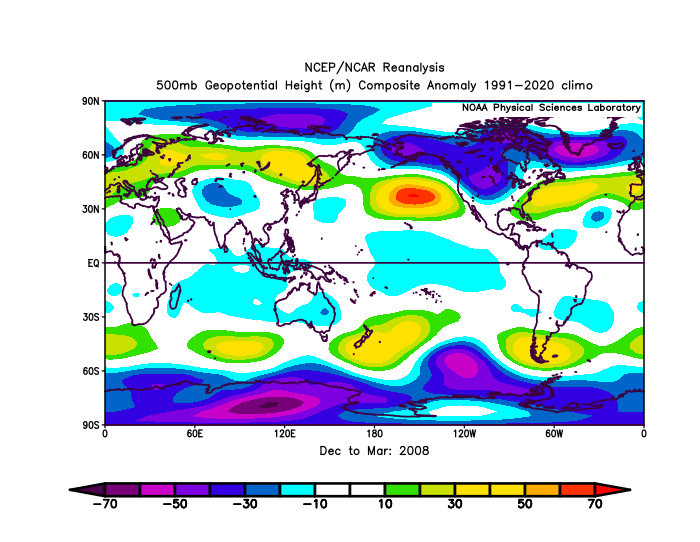
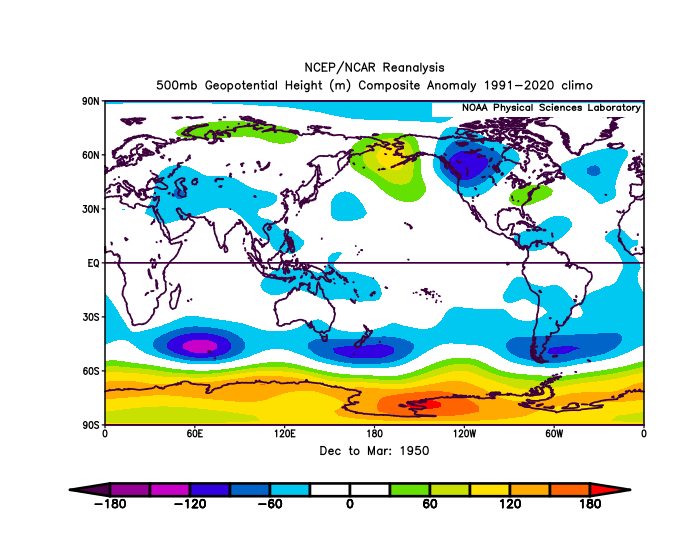
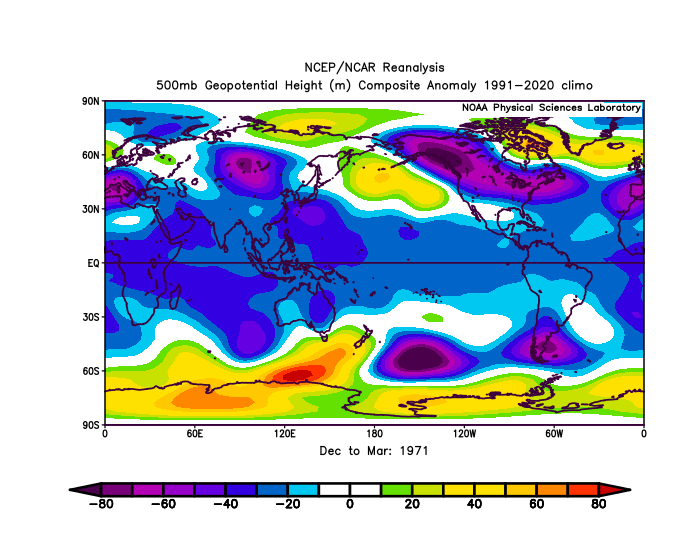
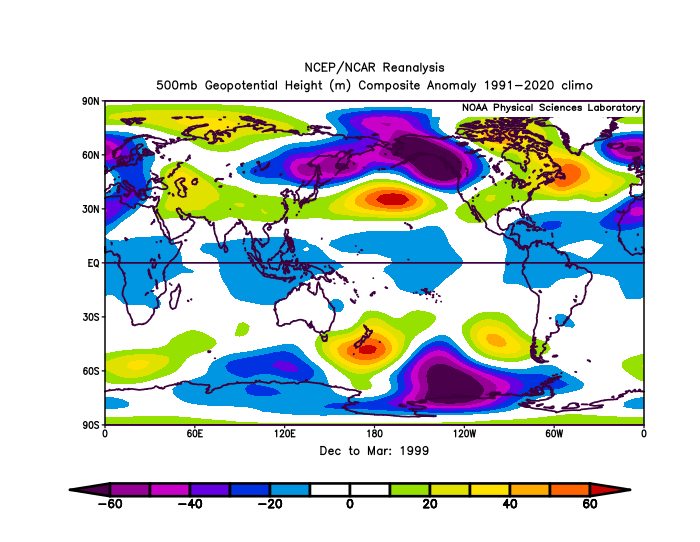
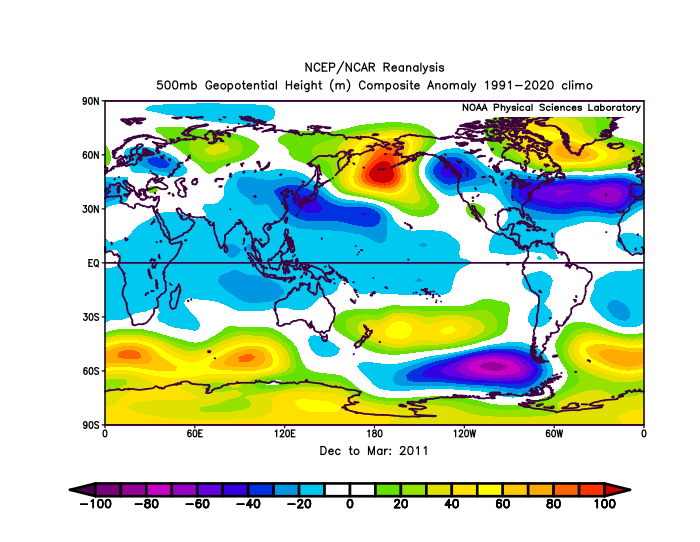
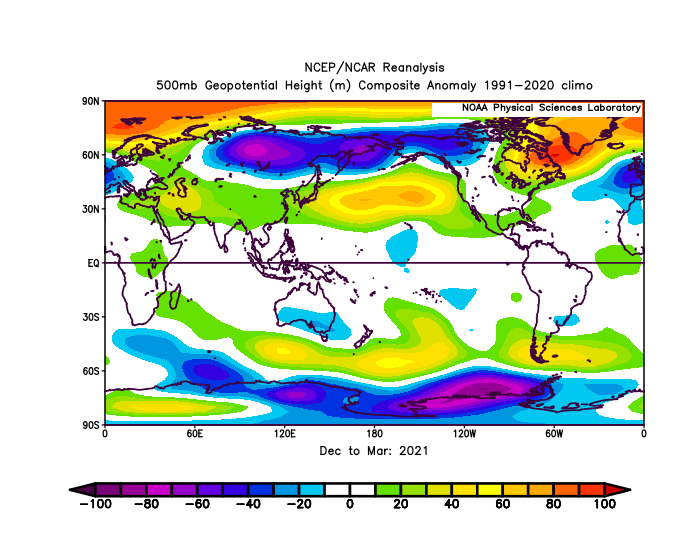
Going off the idea that 3 or more fit the idea of what maybe coming the best years shown are 1949-1950, 1970-1971, 1998-1999, 2010-2011, and 2020-2021. These five had more things combined that would lead me to believe if we do indeed go into moderate to strong Nina status these may be the years to use. Here are the subsurface looks for each year. Some are just flat out not in-line with where we are but Ill leave that for folks to decide. I do have the other years if folks are interested in specific years.

Of the years posted this is what the Dec- Mar 500mb pattern resulted in.
-
1
-
-
Just now, so_whats_happening said:
Sorry for the delay, yesterday ended up being a lot busier than I expected.
So here is the chart I created for all years going from El Nino to La Nina. I highlighted the years that best fit the request of Westerly QBO, -PDO, High Solar (just noticed 83-84 and 92-93 should be highlighted yellow as they are still rather active years) , +AMO, and Volcanic activity ( a lot of years had a VEI 5 a year or two before the listed ranges). 49-50 QBO was a bit of a guess following the typical ~18 month span of QBO transition, data only went to 1953 for what I have.
Here are the sites used to help create this table.
Volcano Data - https://volcano.si.edu/faq/index.cfm?question=eruptionsbyyear
ENSO Data - https://origin.cpc.ncep.noaa.gov/products/analysis_monitoring/ensostuff/ONI_v5.php
https://www.webberweather.com/ensemble-oceanic-nino-index.html
AMO Data - https://psl.noaa.gov/data/correlation/amon.us.long.data
PDO Data - https://www.ncei.noaa.gov/access/monitoring/pdo/
Solar Cycle Data - https://www.swpc.noaa.gov/products/solar-cycle-progression
QBO Data - https://www.geo.fu-berlin.de/met/ag/strat/produkte/qbo/qbo.dat
Going off the idea that 3 or more fit the idea of what maybe coming the best years shown are 1949-1950, 1970-1971, 1998-1999, 2010-2011, and 2020-2021. These five had more things combined that would lead me to believe if we do indeed go into moderate to strong Nina status these may be the years to use. Here are the subsurface looks for each year. Some are just flat out not in-line with where we are but Ill leave that for folks to decide. I do have the other years if folks are interested in specific years.
-
Sorry for the delay, yesterday ended up being a lot busier than I expected.
So here is the chart I created for all years going from El Nino to La Nina. I highlighted the years that best fit the request of Westerly QBO, -PDO, High Solar (just noticed 83-84 and 92-93 should be highlighted yellow as they are still rather active years) , +AMO, and Volcanic activity ( a lot of years had a VEI 5 a year or two before the listed ranges). 49-50 QBO was a bit of a guess following the typical ~18 month span of QBO transition, data only went to 1953 for what I have.
Here are the sites used to help create this table.
Volcano Data - https://volcano.si.edu/faq/index.cfm?question=eruptionsbyyear
ENSO Data - https://origin.cpc.ncep.noaa.gov/products/analysis_monitoring/ensostuff/ONI_v5.php
https://www.webberweather.com/ensemble-oceanic-nino-index.html
AMO Data - https://psl.noaa.gov/data/correlation/amon.us.long.data
PDO Data - https://www.ncei.noaa.gov/access/monitoring/pdo/
Solar Cycle Data - https://www.swpc.noaa.gov/products/solar-cycle-progression
QBO Data - https://www.geo.fu-berlin.de/met/ag/strat/produkte/qbo/qbo.dat
-
6
-
3
-
-
Ill take a look into it tonight/tomorrow what subsurface looked like coming off these years 72-73,87-88,94-95, 97-98. 09-10, heck ill even throw in 91-92 and make a gif just to see where we are potentially aligning with going forward. If any others years are wanted just let me know.
-
2
-
-
8 hours ago, snowman19 said:
This makes sense looking back at data in the early 90s (91/92) we peaked hard on yearly temps around the PA/Philly region and dropped dramatically afterward. We also were coming off an El Nino (strong) to neutral stance and we were also in a solar max situation. huh
-
1
-


.gif.5ebc6cea7ad045c4b060f2aff9d9eacc.gif)

Arctic Sea Ice Extent, Area, and Volume
in Climate Change
Posted
Thanks that is where I meant, Baffin Bay. For some reason that completely slipped my mind, appreciate the correction.