

so_whats_happening
-
Posts
1,348 -
Joined
-
Last visited
Content Type
Profiles
Blogs
Forums
American Weather
Media Demo
Store
Gallery
Posts posted by so_whats_happening
-
-
8 minutes ago, thunderbolt said:
Yea not some typical Nina like response. Has happened off an on over the past couple months with minor WWB events and models seemed to have forecasted the Easterlies a bit to strong at times.
-
9 hours ago, snowman19 said:
@so_whats_happening Anything new on the MEI updating? Dying to see an update. My guess is that it’s a much different MEI landscape from last year, since everything is coupled much better atmospherically (PDO/PMM) with the developing Niña….
Nah they seem to not have an alternative for the OLR data they used for MEI. NOAA has been having some pretty bad outages over the past couple of weeks so this is probably not on the top of their list, unfortunately.
RONI may be reasonable thing to use for Fall and Winter at this point.
-
 3
3
-
-
2 hours ago, snowman19 said:
The EURO has been on again, off again since 18z last night. The GFS on the other hand, wants nothing at all to do with itIm cautious with the GFS it has in fact pushed a more Euro like scenario as we move through time, so caution to the wind. It is a pretty potent wave coming off Africa right now and will be tough to see if it can develop for several days but the better environment is creeping slowly into the Atlantic as we move into August.
I do expect at least one EPAC system to form though (potentially rather weak?) before we get things going into the Atlantic. I believe after the first weekend of August we should get the ball rolling a bit but that is almost 2 weeks out.
-
1
-
-
7 hours ago, FPizz said:
Are these reconstructed or were we actually measuring back in 1954? If not, when was the reconstructed data done?
I believe reconstructed but never really dove into it too much as they are fairly accurate for many of the years in the satellite era. Here is the site if you wanna dive more into it.
https://ds.data.jma.go.jp/gmd/tcc/tcc/products/elnino/ocean/t-eq_tcc.html
8 minutes ago, Stormchaserchuck1 said:We did have an "El Nino pattern" that June with a +PNA and warm anomaly over the Arctic

Do you have a link to those older subsurface maps?
https://ds.data.jma.go.jp/gmd/tcc/tcc/products/elnino/ocean/t-eq_tcc.html
This goes to ~1947
-
2
-
-
37 minutes ago, PhiEaglesfan712 said:
The 1954 one may have been a weak la nina the first year, but it eventually peaked as a strong la nina in the second (1955-56). That transition was years in the making. The preceding el nino technically peaked as a moderate in 1951-52, before becoming disjointed in 1952-54.
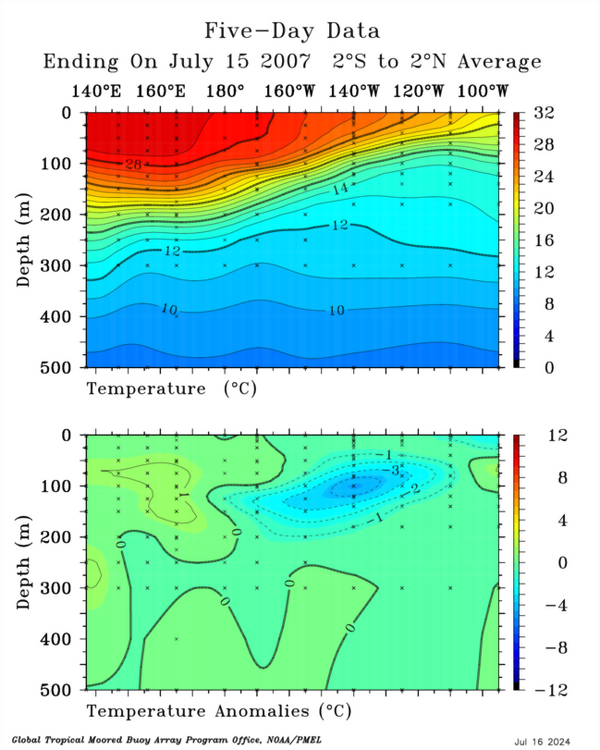
I wonder what the subsurface looked like in summer 1954, and if it had that cool pool that is present in both 2007 and this summer.
-
1
-
 1
1
-
-
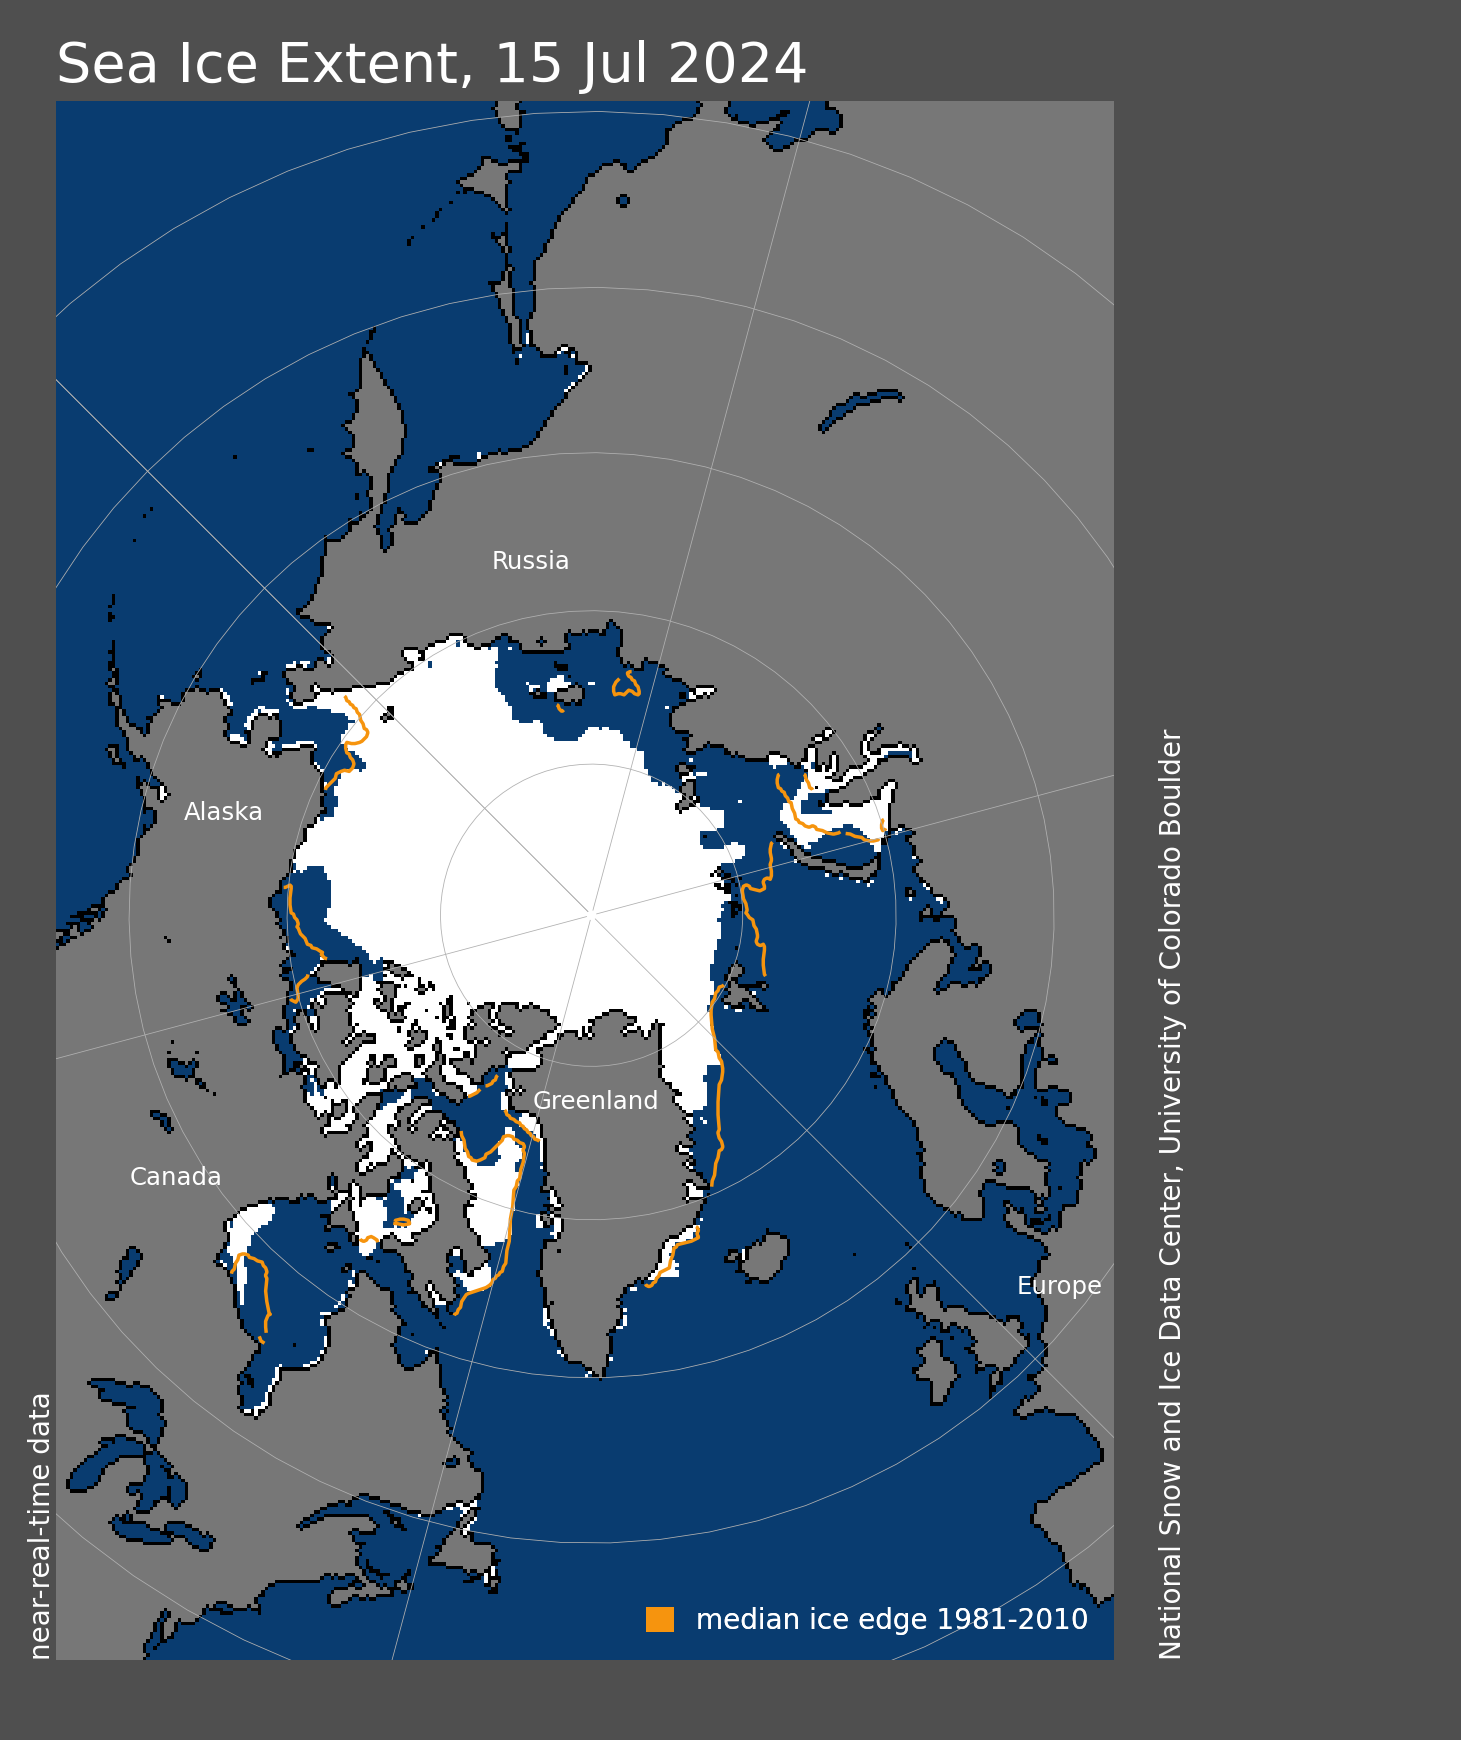
Latest extent map but man sea ice thickness has seemingly taken a hit this year. I couldnt get a date to match as there were many many gaps in last years data from the navy site.
-
1
-
-
2 hours ago, PhiEaglesfan712 said:
At some point, it's time to let go of the hyperactive hurricane season forecast. If there was truly going to be one, like in 2005 or 2020, we wouldn't be stuck in this extended lull, and outside of Beryl, we've been quiet for much of the season.
2005 got the late start like this year, but it was active for 4-5 months straight.
I would be cautious in that thought for now. Let us see how we do between now and mid August before those call can be made. If forecasts for MJO come anywhere close to phase 1-3 the Atlantic could ventilate rather well, I don't expect much until about the end of the first week of August as we rotate through the EPAC should start to fire off a storm or two as we close out the month.
-
1
-
-
Little battle between the GFS and Euro/JMA as to the handling of the MJO progression coming up. GFS wants to swing this through 5-6-7 while Euro and JMA stop in 5 and move over toward null and eventually 8-1 (weak through 6-7) by the end of the month. This will be pretty important for potential Tropical activity going forward.
They seem to be hitting the idea of a 5 pattern pretty well going into the last week or so of July with maybe a touch of 6 briefly. I used La Nada because we are largely still at this even with a decent subsurface look.
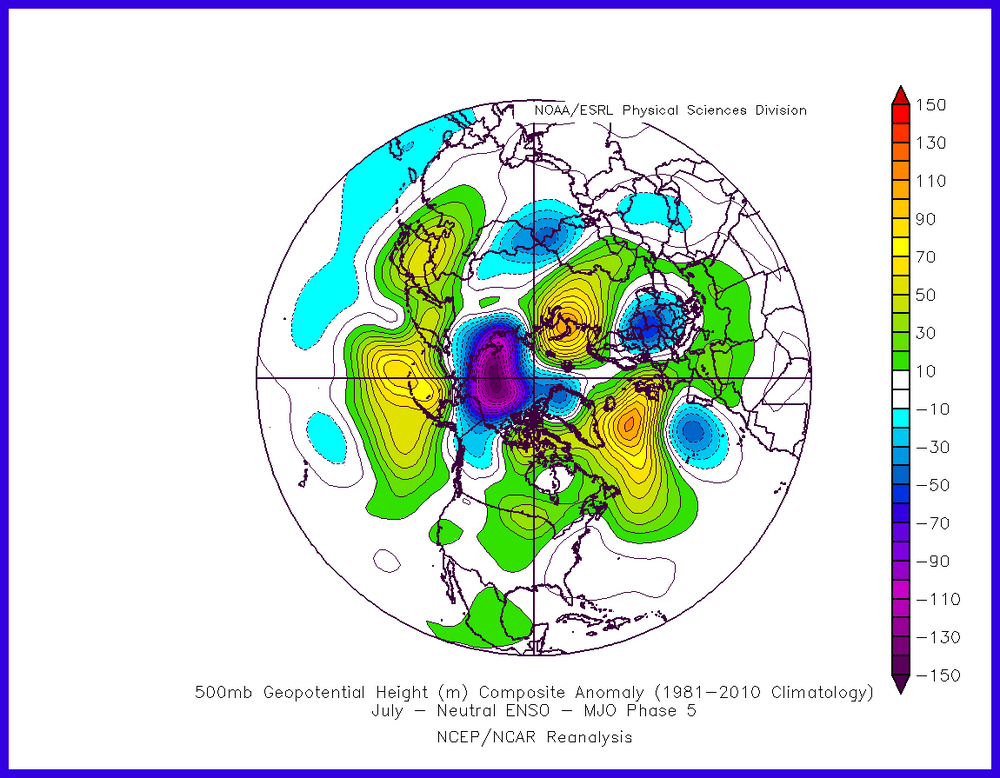
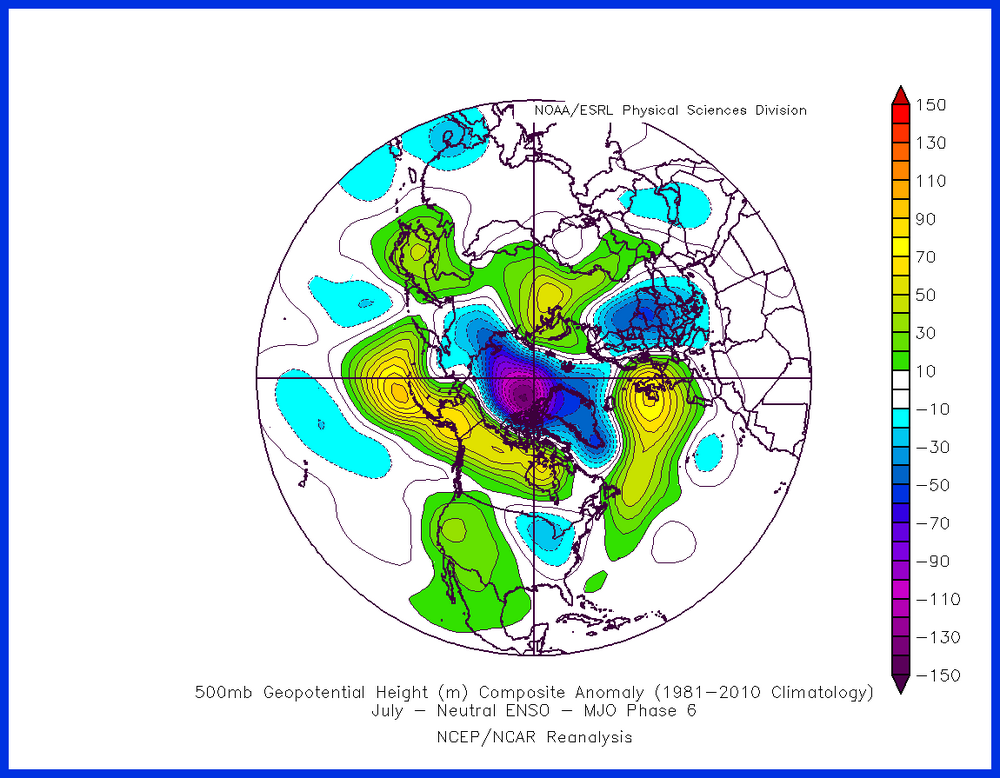
This should help us a bit with a more stormy pattern into the ohio valley mid atlantic regions coming up. Of course depending on the upcoming weeks form will determine what happens as we go into August but would suspect if the Euro was right we see very little 7 influence and some 8-1 into August with probably still largely La Nada conditions.
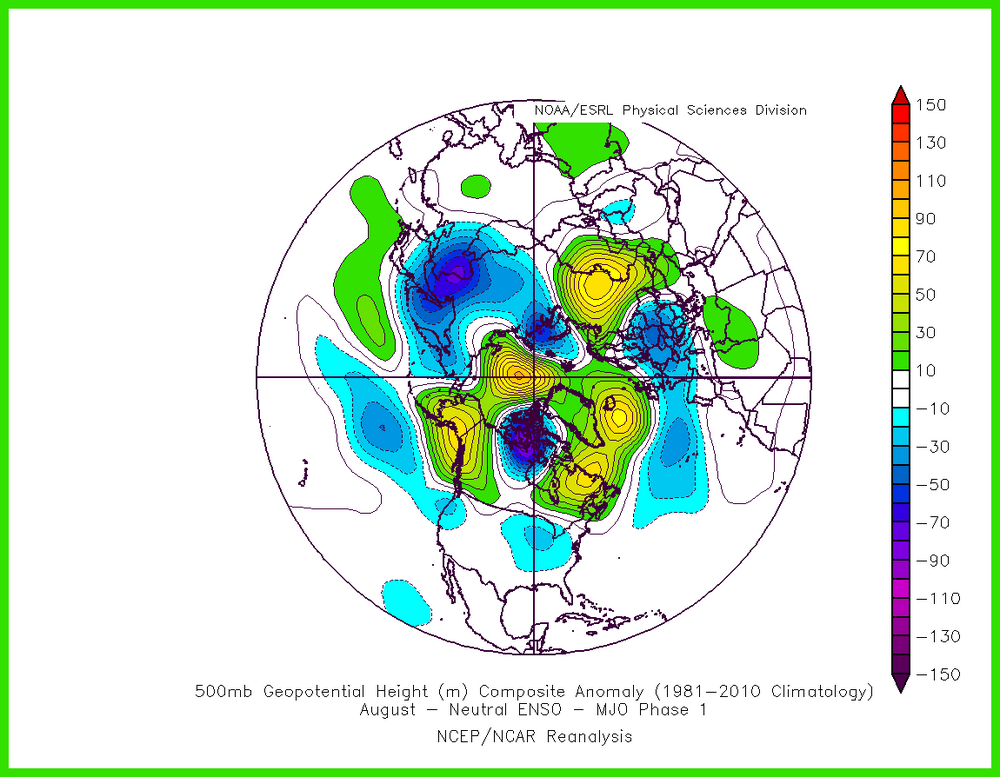
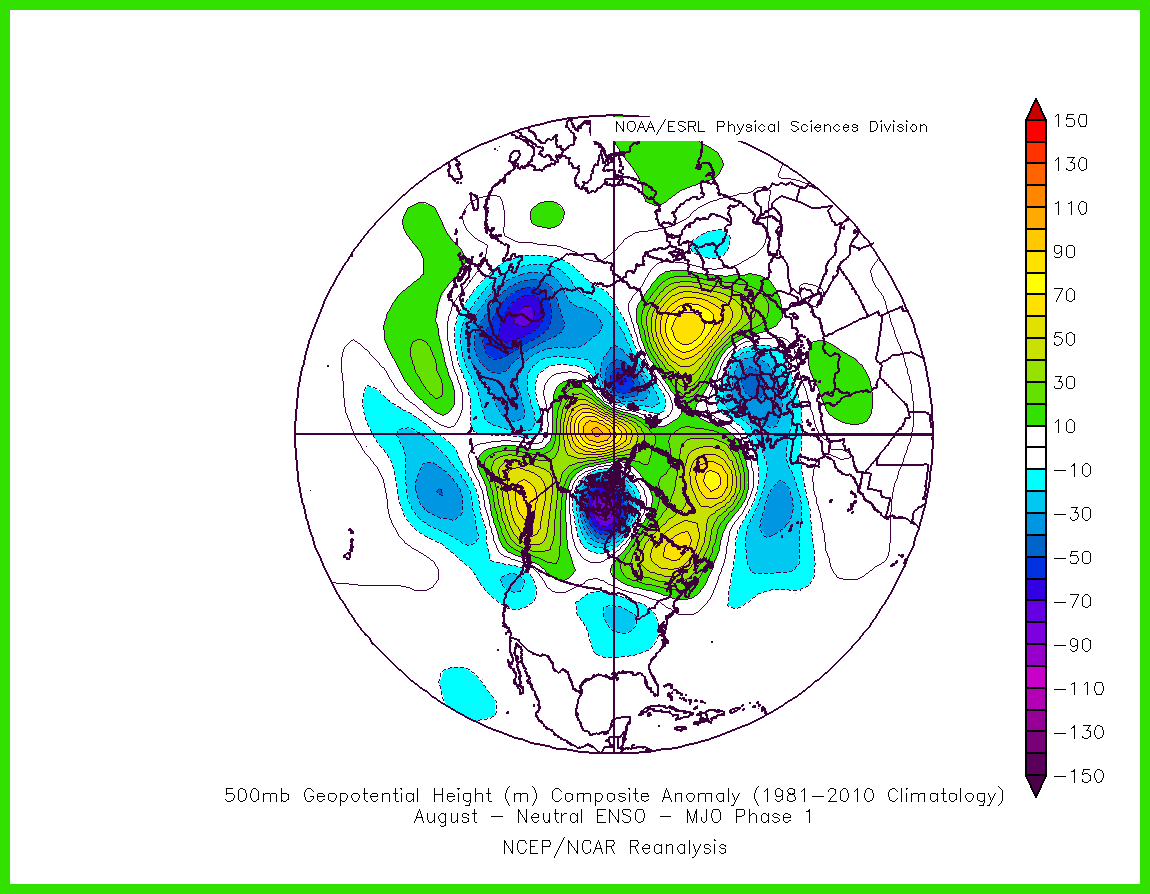
There doesn't seem to be a whole lot of data for an 8 passage in Nada conditions but if a phase 1 is any indication we see a weakness in the East and high latitude blocking occur.
-
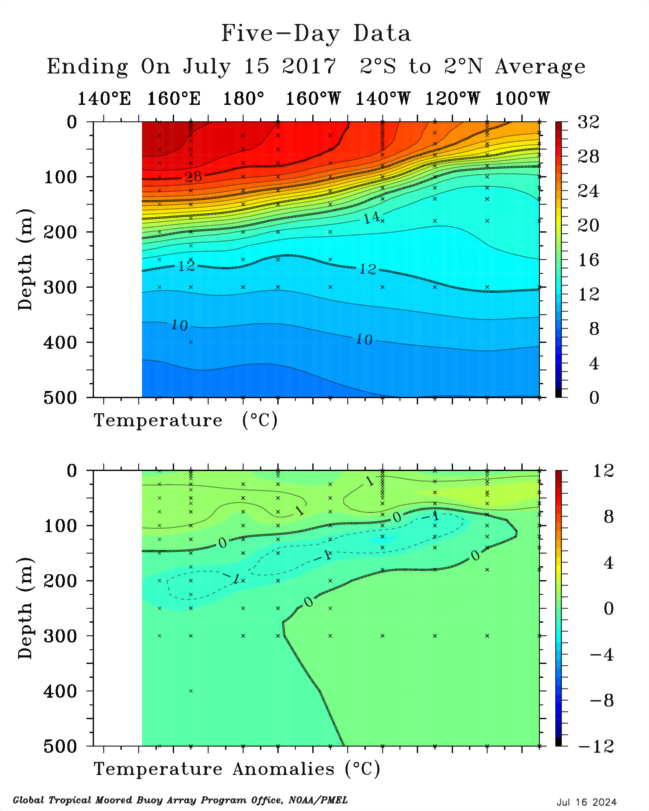
28 minutes ago, GaWx said:
The above animation clearly shows that the top ~100m is solidly holding as a warm layer.
Yea a 5N-5S approach shows we are still relatively weak even with the easterlies a blowin' right now. Should see some results before the end of the month, at least expansion westward of the cold neutral anomalies.
-
1
-
-
1 minute ago, so_whats_happening said:
Here is the latest subsurface from beginning of June to the current date. Also added Hovmoller forecasts for the next 2 weeks.
.thumb.gif.f2e1ab9719b20a40f6d4d6422b543012.gif)
Here is 2007 and 2017 in comparison.

-
1
-
-
Here is the latest subsurface from beginning of June to the current date. Also added Hovmoller forecasts for the next 2 weeks.
-
1
-
-
1 hour ago, michsnowfreak said:
"I don't remember" is a dangerous word to use in weather haha
 . Looking up the actual data can really surprise you. Not an encyclopedia of weather knowledge for Boston as I am for Detroit...and I do know east coast winters have warmed a bit more than here (I've found that fall/winter warming is much slower than spring/summer here)....but when you actually look at data you might be surprised. Using just our memories is how the tales "when I was a kid" start. Since the beginning of climate record there have been eye popping warm months, out-of-season warm temps at any time of year, and multi-year cycles of unusually warm weather. They just happened less frequently back then (how much less depends on location).
Yea the biggest change by far has been overnight temps in all seasons. The biggest changes of course have been in winter but in summer we are feeling it a bit over this way. Average night temp is around 68 here at BWI we have steadily been around 72-75 with spikes of around 76-80 with this heat of recent. In the last month alone we have gone below 67-68 area about 4 times all the while being in a D1 drought. Hopefully it breaks for a bit coming up here the house is way too hot with no central air.
-
1
-
-
7 hours ago, snowman19 said:
Another crazy stat and it’s not even at the climatological lowest point of the year. My guess is this is related to the marine heat waves:
You should check out the Sea Ice thread good read in there, although it doesn't get much activity. We have surprisingly not set a record since 2012 we came rather close in 2020 though. Mush ice may create a different state and act differently on the surrounding environment than many had envisioned playing out. Certainly will keep watching as we go through the rest of this decade we maybe in that flatline area before the next step down. Coming up we may actually have a profound period of lower melt although having SLP around 980-985mb doesn't really help all too much.
-
1
-
-
2 hours ago, Stormchaserchuck1 said:
I think you guys are overestimating hurricanes.. the thermocline is where real value is, for pattern effect. That lies 100-250meters below the surface, and hurricanes rarely reach that far in depth of spinning up the oceans.
It is well known that hurricanes affect only the upper maybe 20m of oceanic temp but repeated action over a particular area will actually cause changes in the thermocline over time. Speed and strength as well as overall size play into these factors. I do not believe it is enough to cause massive changes but a change in the pattern is a change in the pattern to which longwave can start to take over. Look at what happened west of Bermuda this past year one solid system in September (Franklin) started a rather decent chain reaction to a more consistent troughing pattern as we went into fall and winter over the region.
So it is not out of the realm of possibilities to note that this is an important factor. It is not perfect as we know many things in weather tend not to be so it doesn't always portend to a situation but it makes me think there is actually something to it.
-
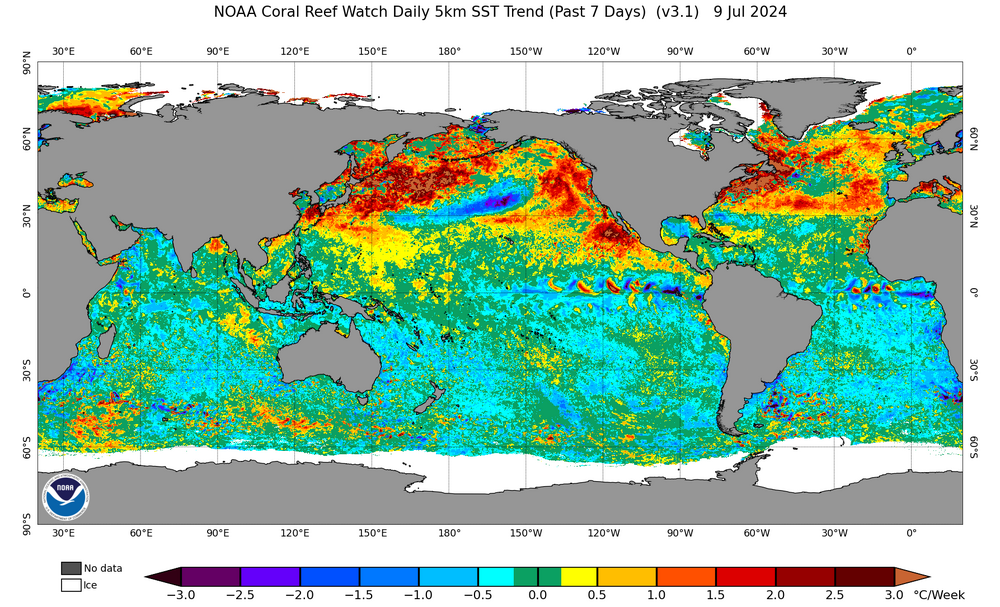
7 hours ago, bluewave said:
Yeah, on top of that there has been a near record low number of typhoons so subsidence continues to warm this seas.
I had brought it up a while back, but the guy I work with and I were discussing the lack of typhoons and hurricanes over the last couple years. So there still has to be energy transfer that occurs but this seems to be occurring in ways with less overall activity and stronger storms. With overall activity down there seems to be a situation of how does the energy become used in the more northern latitudes and one way that seems to be popping up is more prolific rainfall events. I believe you have posted the increase in anomalous rainfall events over the past decade or so. Definitely something to continue to watch if these SST profiles continue on their path. That temp gradient is just not there right now as much as it use to but we can still spin off storms occasionally.
I know many are going for a hyper active season but ACE wise this could get there without needing 30 storms in a season.
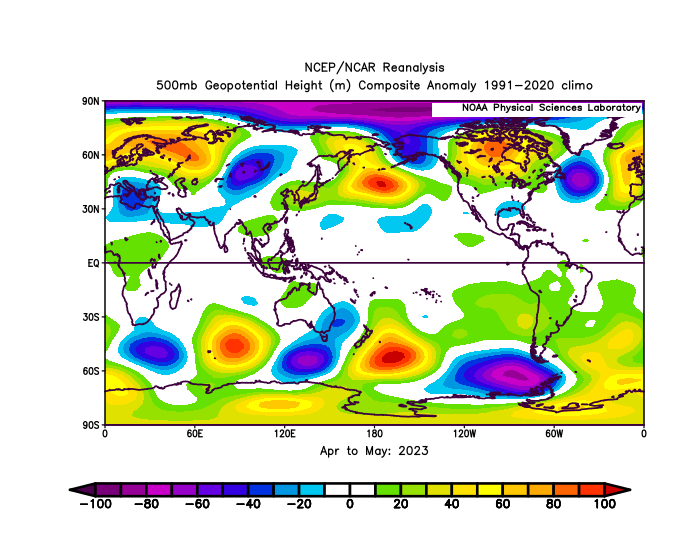
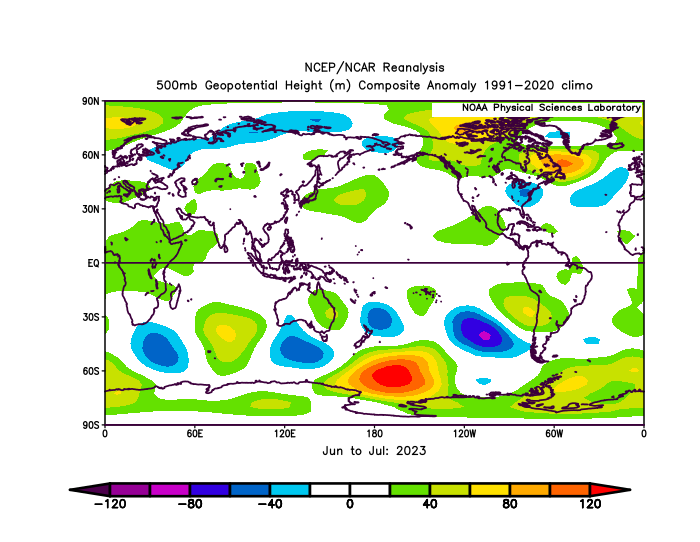
6 hours ago, bluewave said:Parts of Australia have been the only region of the Pacific basin to have experienced colder temperatures recently and now they are getting a rare SSW over Antarctica.
I thought I saw some funkiness when looking at the 500mb world map view last night. Good to see it being confirmed
-
1
-
-
16 hours ago, bluewave said:
I think the upper ocean heat content is so high that hurricanes and typhoons won’t really shift the surface SSTs as much as they did in the past with lower upper ocean heat content. Remember several years ago how we had one of the most active typhoon seasons on record followed by one of the strongest marine heatwaves during the following winter. The reserve of deep warmth in the WPAC was so strong in the fall of 2019 into 2020 that the record IOD cooling near Indonesia was reversed to record warmth in under 2 months.
It is possible that is the case it seems as though when these waters have cooled in the NW PAC and NW Atlantic the surface has been the only thing affected basically the first ~15-25m (I feel this is even being generous). It seems to have not had a dent into the thermocline which when the pattern bounces back it is able to quickly allow the warmth to rebuild. So that does make sense to me, I do not believe ocean heat depth is measured outside the tropics? Please correct me if I am wrong on that.
Here is a great example where last spring into summer along the east coast to NFL region actually was rather cool in surface based anomalies we rapidly changed that as we went into June and July fairly similar to this year. The feedback when the pattern came back roasting the oceans just kept building on itself into the NW Atlantic and NW Pacific in August and September. Even when we got Franklin last year it managed to make a solid below average stripe off the east coast but failed to actively stay strong into the NFL region to make a solid dent in the SST, though the 500mb did change up shortly after that occurred. So whether it was the hurricane or seasonality is always up for discussion.
I feel if we consistently are able to get strong storms in the area between Bermuda and east coast and have several large hurricanes recurve we could start to make dents but that has yet to be seen. One storm ain't gonna do it. Especially if we get landfalling hurricanes that may only fuel the ridge pattern over the Atlantic like Beryl seemingly is doing in the Atlantic right now. I feel Beryl was moving just way too fast to cause a large wake and actually was a rather tiny storm overall even though the impacts it had were intense to land. You will have to let me know which year you are referencing for the WPAC. Would love to check out the tracks that year in comparison to where the SST distribution set up.
-
1
-
-
I would imagine if we even start to see a semblance of an average typhoon season we could start to show a nice cool tongue across the pacific as we get toward fall but there is a lot of work to be done. I do still find it weird we have this dual basin cold equator look that is not typical in El Nino or La Nina years (last year we also had a warm tongue through the Atlantic with a strong/super Nino). I would be curious if there is an ongoing study about this phenomena.
-
37 minutes ago, PhiEaglesfan712 said:
Wasn't the record set last year with Hurricane Adrian?
Anyways, this EPAC season is going to set some record low activity.
That formed on June 27th
-
We are starting to see some changes in the far north pacific waters and this Aleutian ridging pattern will only help enhance it. Less Gulf of Alaska low action will allow warming into the NE Pacific over time. I think it is possible we start to actually tame down the -PDO as we head toward winter. Especially if the ridge persists much further east compared to around mainland China to Japan.
BTW this is the latest start to the EPAC hurricane season July 2nd was the latest if my numbers are correct.

-
2
-
-
Latest update Ill stop adding in May after this one. You can see the surface region cool again properly with the latest easterly trades. We should start to have the early June look again around mid month from there it just depends on how things keep going.
.thumb.gif.7697e3d148616a13eae7ced72763f8c5.gif)
.thumb.gif.05196b8ed4b8c74b23908b35d27f5489.gif)
-
1
-
-
16 hours ago, bluewave said:
We can use the ESRL data as a proxy for the RMM plots. This year had the most convection for such a strong El Niño in the WPAC with the warmest SSTs in that region. It resulted in much stronger forcing in the WPAC than usual for such a strong El Niño. Also notice how much stronger the Aleutian ridge was than in the other El Niños. The heights were also higher than average over Mexico. So this was more of a hybrid ENSO event made up of a borderline super El Niño and Niña-Like -PDO and MJO forcing.


Thanks finally figured out I had to go through some massive amounts of attachments over the years should be good for a little now.
Honestly the biggest misalignment Im seeing is the lack of properly placed 850mb. This would have allowed convection further east, VP also to be further east, cooling into the west pac, actual typhoon action in the WPAC, and overall a much more proper 500mb pattern closer to those years. But yes hybrid is probably the best way to describe it.
Looking at strictly years with similar SST and -PDO patterns you can even see we were way off. Also looking at past years with strong western leaning forcing still showed we were way off. Im actually kind of amazed we were even able to get a proper +IOD with such misplaced VP. Guess the only way to see if this continues or was a just a fluke incident is to look toward next +ENSO event.
-
15 minutes ago, 40/70 Benchmark said:
No, I agree with this....I think the MEI was a bit wonky and not reflective at 1.1 or 1.2....I think the RONI peaked at around 1.5 and the was a good proxy for ENSO intensity IMO.
If you look at just surface temp anomalies you would undoubtedly presume this was a super event it matched almost perfect. So it had flairs of super within a strong Nino state atmospherically. Again I need to say this I don't dismiss RONI for what it is but I do not find it reflective what the atmospheric state shows via RONI. Until we start to see that I still have to go with ONI as the base stat in these situations.
This is why I believe it may end up being more useful in these weak and neutral events to help determine that atmospheric mode, but we will get to that in time and see how it handles in the upcoming years.
-
1
-
-
1 hour ago, 40/70 Benchmark said:
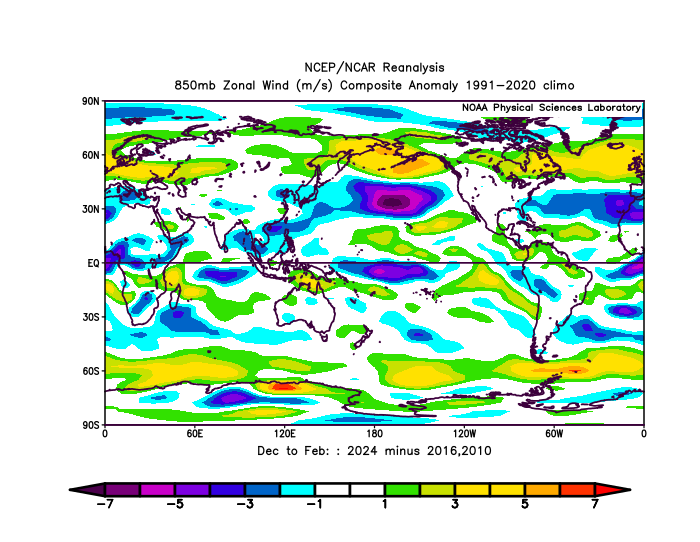
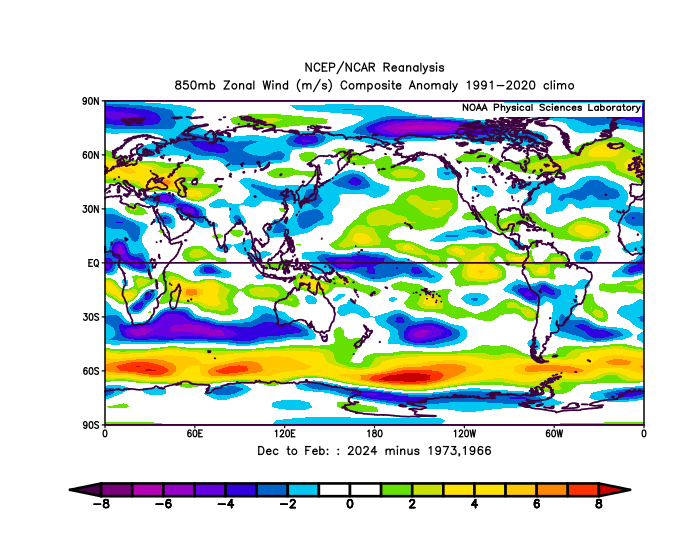
Look at all of the other super El Niños......you had the strong west-east dipole across the Pacific in terms of SSTs and pressure, which produced much stronger WWBs. That whole system was much less pronounced last year, which is reflective of a more moderate event.
1972-73 had very strong WWBs per 850mb wind zonal anomaly. I think location of these WWBs is the most important factor in cooling the west pacific. The intensity certainly plays a role but placement is probably the bigger factor. 2024 had WWB anomalies much further east than 1965-66, 1972-73, 1982-83, 1997-98, 2015-16. Allowing these years to cool down in the WPAC comparatively where 2015-16 was the odd ball because of just how warm the ONI got in comparison.
For SLP comparison yea 2024 was a bit lackluster in that department compared to these years that was probably a solid result of the lack of cooling in the WPAC.
As for the 1994-95 and 06-07 comparison, yea I guess you could make the claim they were in a similar-ish PDO state RONI would have had 1994 right at ONI values of 1.1 and 06-07 actually sitting at around .5-.6 (barely ENSO weak status) so im not sure these years can be compared in that sense.
Look I get where you are coming from in stating that this was not your traditional Super El Nino but this was not your typical moderate El Nino either. Strong is probably the most befitting and atmospherically it was pretty darn close to strong status.
Again wish I could post pics of all this, I did contact stormtracker to see what is up with that.
-
1
-
-
7 minutes ago, 40/70 Benchmark said:
Yep....1994 and 2006 weren't too dissimilar, either.
I really wish I could post pictures right now to show these years comparatively to 2023-24. Also I believe you meant 2006-07 season.


.gif.1f54cf41b62931125d63124cd5f121cb.gif)


.gif.5e44fbb4b88b16f31e07c5ec3808d7c1.gif)
.gif.8147d9ce7b5840c69ab093f13f852566.gif)
2024-2025 La Nina
in Weather Forecasting and Discussion
Posted
The last typhoon in the WPAC actually had a pretty significant cooling of waters around the Philippines and Taiwan.