

so_whats_happening
-
Posts
1,059 -
Joined
-
Last visited
Content Type
Profiles
Blogs
Forums
American Weather
Media Demo
Store
Gallery
Posts posted by so_whats_happening
-
-
Well MEI data will no longer be updated...
-
 1
1
-
-
6 hours ago, chubbs said:
From Kris Karnauskas twitter, tropical mean SST anomaly averaged on latitude bands. Shows the impact of long-term warming and enso on tropical and sub-tropical SST. Ninos warm the tropics and sub-tropics while La Nina cooling is more focused on the tropics with less impact on the sub-tropics. The subtropics haven't been the same since the 15/16 nino. We'll see what the aftermath of this nino is.
edit: Added a plot showing trends for the east and west Pacific. Of course the east Pacific has the biggest enso effects.
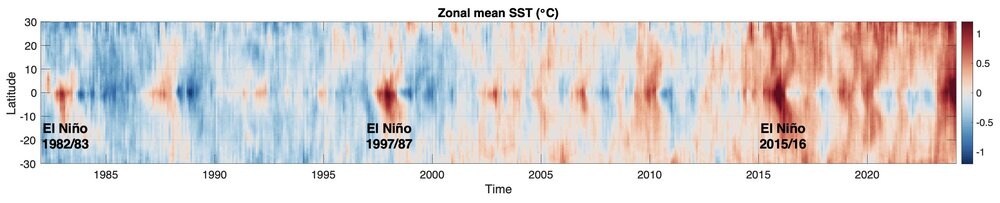
Very cool. You can see from your first picture we took a step up in the early 2000s and something just went nuts around the 15/16 Nino. Is it possible that in order to keep as close to balance as it can be that we see a multi decadal -PDO state and potentially more La Ninas to try and 'revert' things?
Edit: Also wanted to add it is interesting to note that the La Nina SST anomaly seems to be not nearly as intense over time even with impacts still being almost as potent as they were 30-40 years ago. I wonder if this is due to the warming of the surrounding oceans having an impact on the overall SST anomaly yet when the background is still La Nina we still feel the episodes regardless of ONI values. Example being we hit barely moderate level on the third year La Nina yet the MEI would suggest we were near super Nina levels of impact. 2010-11 gave us near strong Nina levels via ONI and MEI but this was also before things changed with the 15/16 Nino.
-
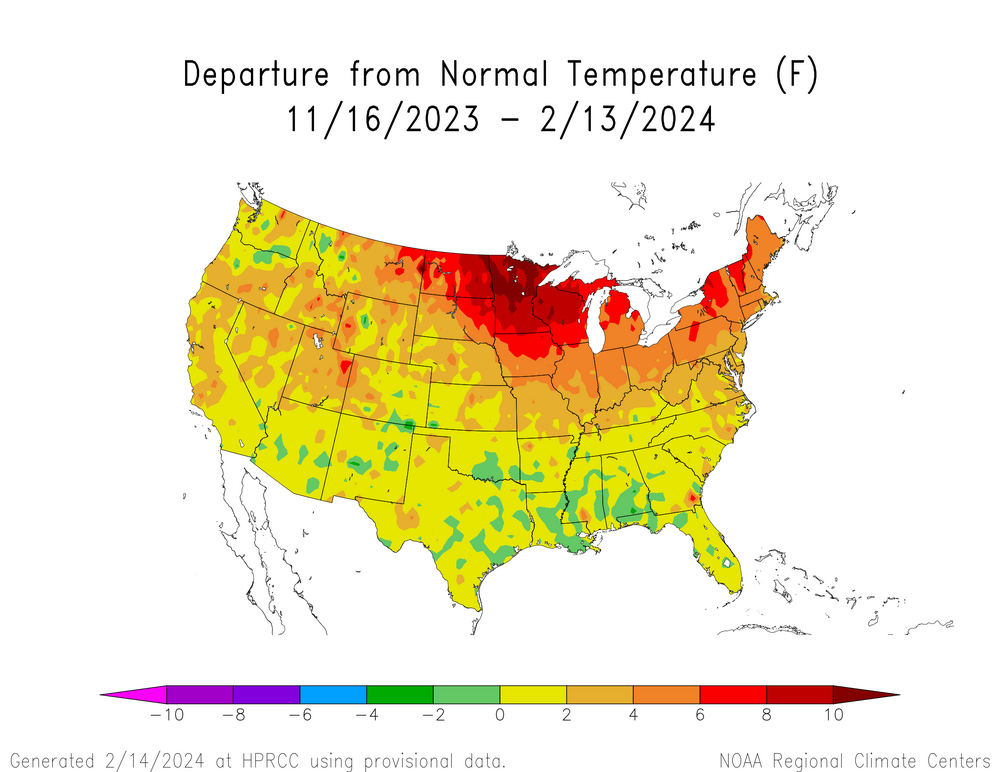
10 hours ago, michsnowfreak said:
Regardless, Id have to imagine this year is rock bottom for the east.
We havent been doing as widespread poorly in the midwest/Lakes for the most part, but this winter has to be rock bottom for the upper midwest especially. Even though they have had good snow years recently (just last year in fact), this winter is so unlike anything Ive ever seen for those places. To unseat the historic warm winter of 1877-78 (also a strong Nino) as many did is crazy. And I have NEVER seen a winter with near bare ground in northern MI in Feb.
This year while in many areas wasn't great at all, there was one spot that managed to do well. PA was the hot spot for average to above average snowfall this year and at that a rather localized area from about Scranton to Allentown and back to about Harrisburg/ State College area. We managed about 18-19" on the winter which is below average on our 26" yearly snowfall. This was not a bad winter for our neck of the woods but last winter was horrific (0.9" for the entire winter). 2020/21 was our last above average winter (~34") and that came with a nice storm in February and a nice event from the huge storm that pummeled BGM back in December 2020.
At this point im rooting for a neutral event, while one year I would love to have a revisit of 09-10 pop up im on the lets get to average train at this point.
I have been noticing though when we do get these marginal events things are just a bit too warm for us anymore when we used to be able to manage to stay slightly on the cooler side of things. I do wonder if the warm Atlantic is causing this issue. That hurts us immensely on those quick pickups of 2-4" that would help get to near average.
-
 2
2
-
-
DCA _ NYC _ BOS __ ORD _ ATL _ IAH __ DEN _ PHX _ SEA
2.1 2.8 3 4.4 .8 1 -.8 -2.3 -.6
-
 1
1
-
-
On 2/12/2024 at 7:04 AM, LibertyBell said:
Question is can anything happen to the Gulf of Mexico to stop the Gulf Stream? And can climate change eventually affect the earth's rotation somehow-- or would we need an even bigger disaster, like a meteorite/asteroid strike or big earthquake or tsunami to alter it?
Probably nothing to actually stop it as it is a wind driven current but what could potentially slow it down would be lessening that temperature within the origination spot, GOM. It would need to be mass amounts of heat removal or tons of fresh water input both of which are rather hard to achieve in a timespan to consistently happen. So you get ebbs and flows where some seasons are warmer and some seasons cooler so there is some regulation of overall gulf stream motion but not full stoppage.
If we have giant asteroid/ meteor or the earth stops spinning we would much bigger issues to worry about. I do find it interesting though that the gulf stream would take a more southerly route if AMOC shuts off I guess this does make sense though as there would be nothing really to help 'finish' the current around Iceland if there is little to no sinking occurring in this region. Would mean the Atlantic waters south of 50N would warm rather drastically over years.
Interestingly enough there doesn't seem to be much of a Labrador current or a Canary current over the last few years. Maybe we start to see a more pronounced current in these regions again instead of this highly weakened state?
-
1
-
-
2 hours ago, GaWx said:
Tropical systems bring excessive heat from the tropics and move it to higher latitudes. With the Arctic warming much more strongly than lower latitudes due to AGW, there's less heat imbalance. Shouldn't that factor alone lead to reductions rather than increases in overall tropical activity?
This has been a topic of discussion between me and another colleague. Tropical activity is the balancer to bring heat and moisture to high latitudes but with that temp increase in the northern oceans it is not nearly as imbalanced. He mentioned one thing that has increased dramatically over the last decade or so are heavy rain events. So in other words the Earth seems to be trying to rebalance itself in a different way than what it used to through tropical activity due to this gradient not being nearly as prolific. How it plays out going forward is really anyone's guess. It probably still does lead to stronger storms when they do form cause of the amount of fuel but overall less tropical activity may be the way to go or we see one basin just go bonkers while the others stay silent instead of spreading out the activity over the basins.
There is no reason the WPAC should have had nearly half the typical amount of tropical activity in an El Nino year. The southern hemisphere has been on a decline for quite some time with overall tropical activity as well. There should not have been as active of a year in the EPAC at the tail end of a triple dip La Nina. Something just seems off right now with how it 'should be'.
That is not to say this year won't have an above average hurricane season in the Atlantic though. While it is not all too uncommon we did have quite a few storms more than we typically would see in an El Nino year in the Atlantic, even with them following a similar path to a typical El Nino year (north and OTS). The Atlantic is right back up to levels we saw last year when it was extremely warm and for it to be at this time of year is a little worrisome to see as temps should only go up from here on. It looks like a decent tri-pole setup as well, so it should be rather interesting to see what comes of this.
-
1
-
4
-
-
On 2/17/2024 at 6:00 PM, mitchnick said:
Anybody still watching the 10mb for SSW? Today EPS show it happening in a few days, recovering briefly, then switching direction again for an extended period. That's crazy.
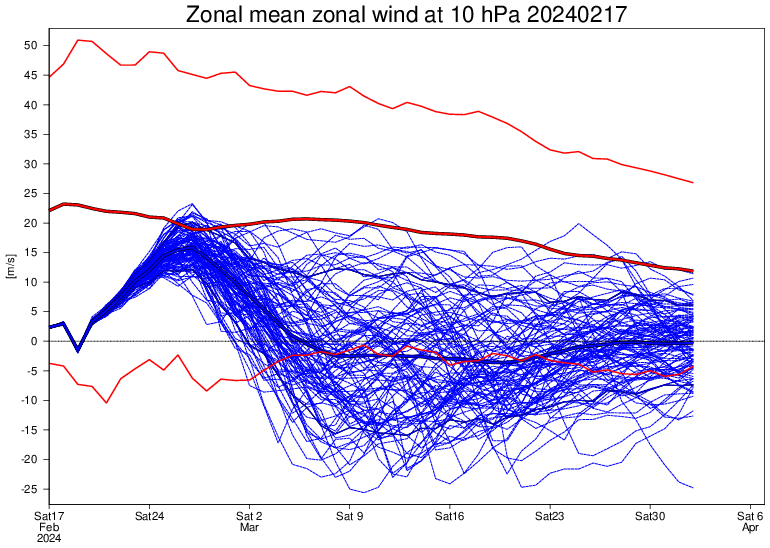
We are nearing the typical final warming and destruction of the SPV so that makes sense. If I remember correctly it takes place around mid march to mid April some years earlier some later. Although im not sure this bout toward mid march will do all too much later on we should see a brief cooling take place the first week of March from the current weakening. Maybe we can pull out a last minute surprise?? but im banking on most for about 40N southward being virtually done with winter besides a cold shot.
-
2
-
-
1 hour ago, Terpeast said:
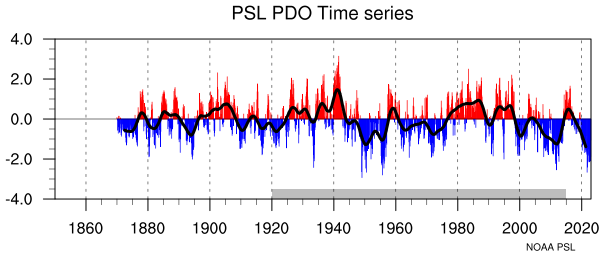
I’d want to see wholesale changes in the pacific and for those marine heatwaves to cease before thinking anyone east of the rockies get a snowy winter. At least the PDO has been less negative recently, but I’d want to see it firmly in positive territory.
Increase in WPAC tropical activity would definitely help in taking out that persistent warmth around Japan, unfortunately it probably means a record year or strong typhoon after strong typhoon to really churn up those waters.
-
I would love to see shipping lanes overlayed on SST anomaly maps in both the Atlantic and Pacific to see if that reduction in sulfur really is playing a large role in these regions. Also bathymetry is tough subject but I am curious if there is indeed something in the subsurface in these regions helping to enhance the oceanic heatwaves more than just stuck patterns.
-
On 2/11/2024 at 9:21 AM, bowtie` said:
I do not see any spaghetti lines anywhere near where we are right now.
It is no wonder with a look like this
-
 1
1
-
-
I haven't looked much into this yet but will be interesting to see what happens. I do find it weird we haven't had much in the way of neutral years, 2019-20 being a failed Nino allowed us to have a warm neutral year. Im one for rooting for a neutral year in between these Nina/Nino episodes especially going from a triple year La Nina to strong/super Nino the last time this sort of remotely happened was in the 70s so it is not unheard of just rare to see.
A tell tale sign for sure will be how this spring into summer transition will we get more plains severe weather outbreaks? will we get a warm SE coming up in early spring? will the hurricane season be above normal with activity actually reaching the US? I would assume the gulf and Caribbean will be much more active/conducive this year for landfall potential.
-
1
-
-
Harrisburg is all snow. York should be close to if not all snow. Lancaster needs just a bit until the heavier precip gets in but should go all snow.
-
R/S line really pushing south now as the heavier precip moves in. This was about a half hour ago too
-
1
-
-
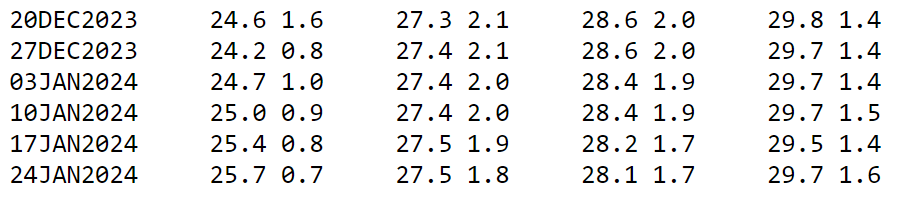
41 minutes ago, GaWx said:
The DJ MEI came in at only +0.7 vs the +1.1 peak of ND.
Wow I was certainly expecting it to hold steady but that is much weaker.
-
On 2/3/2024 at 4:01 PM, GaWx said:
This is about as good as it gets per his monthlies and getting the unrounded peak exactly and thus I think should be the winner! However, he messed up his perfection by “not playing by the rules” (as he stated) since his definition of super is 2.0+, not >2.0 (with which I agree). Thus he voted >2.0 even though he predicted +1.97 unrounded/+2.0 rounded. I still say he wins. Congrats!
By far the best forecast hands down.
-
2
-
-
DCA _ NYC _ BOS __ ORD _ ATL _ IAH __ DEN _ PHX _ SEA
+1.4 +1.5 +1.8 +5 -.5 -1 +1.9 -1.3 +2
Going to a go a little more extreme than I typically do in a few locations and see how it fairs.
-
4 hours ago, GaWx said:
That last (“at the buzzer” ) warm burst for all anyone knows MIGHT be enough to barely attain a +2.00 for the unrounded NDJ ONI, but it could still go either way. (Rounded +2.0 NDJ in the table remains a near certainty.) A lot for the unrounded is riding on the relationship this month between OISST and ERSST. The Aug-Dec ERSST anomaly averaged 0.08 warmer than OISST.
Before anyone asks, whether or not the unrounded turns out to be +2.00+ will have no impact on Feb wx prospects. This is just for fun, documentation, bragging rights, and the contest.
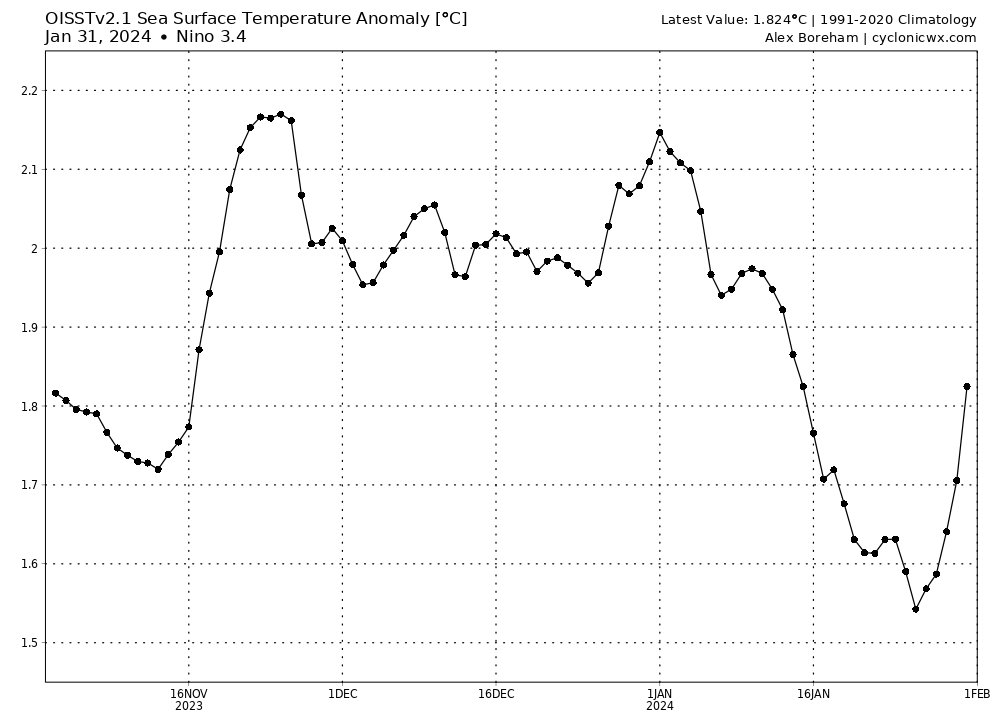
What I do find interesting here and this was just a quick look but something seems off. The OISST charts from cyclonic wx don't quite match up with the weekly numbers shown from this site.
https://www.cpc.ncep.noaa.gov/data/indices/wksst9120.for
It is very possible I have it labeled wrong but I'm pretty certain that this is the site for OISST weekly values. You can see from the graph which was much higher than weekly readouts would suggest. (3rd column is 3.4) From cyclonicwx it should be around 2.1 as a weekly value for the time period ending on January 3rd. Is it possible the graphs are reading it a bit too high compared to what the data prints out?
Anyway just wanted to throw it out there if we take the 4 weeks thus far (ill even include the end of December (January 3rd number) because well it was warm before and no drastic changes occurred during that time. Also an estimate on the last week ending on the 31st of about 1.7.
1.9+1.9+1.7+1.7+1.7=8.9/5= 1.78 (rough estimate for the monthly value) and assuming the relationship still holds true between the two should get us to 1.983333 (2.02+2.07+~1.86) for NDJ so rounding would take it to officially a 2 per the graph we use. Again all very rough estimates but I am curious what you think the reasoning is for the lower value on the weekly versus the chart. If that is the case the last week comes in colder than I thought even with the quick spike.
-
2
-
-
It looks like we should see a leveling off in region 3 coming up toward the end of the month and maybe even a rise again in 1+2 as the last little bit of warmth moves east. Subsurface cooling quite drastically this month really hope we don't push right back into Nina conditions by summer, hopefully can get a neutral year to show up.
.thumb.gif.adba8b2607a08e7af161ad9fd9cf2fa4.gif)
-
1
-
-
On 1/23/2024 at 11:39 AM, GaWx said:
I’m roughly estimating that the Jan 2024 SOI will end up in the +3 to +5 range. How would that compare to other strong+ Ninos? I count 18 of them going back to 1877-8. Out of these 18, 17 had a -SOI in Jan. The only one that didn’t was 1931’s +6. So, Jan of 2024 is headed toward easily having the 2nd most +SOI of 19 strong+ Ninos and not far behind 1931. Unlike 2023-4, 1930-1 was unusually dry in the E US for El Niño.
Regarding just the 6 super Ninos, their Jan SOI range was from the -4 of 1973 to the -31 of 1983.
We may set the record here unless we have some large negative values coming up, maybe the last day of the month can offer a large negative spike?
-
1
-
-
Not really but it also wouldnt be at that it would be flirting with 1.94-1.96 range and rounding would take it there.
There actually isnt an official source that desiginates these thresholds like there is for EP and CP events, just folks trying to classify it against other ENSO events. Pretty sure CPC and BOM only mention weak, moderate, strong events which each threshold seems to be .5-1, 1-1.5, 1.5+ respectively.
This has not acted like your canonical super enso event ( honestly i even question if there is a typical super nino event as we only have like 3-4 to go off of), strong may not even represent it properly. All ill say is it is nice to be above average on precip again. Sitting at about 9-10" of snow on the year so we are doing wildly better than the last 2 winters with still a month left. Just really hope we dont go into mid march with this but...
-
1
-
-
There were a few days mixed in there with some buoy issues but yo get the idea.
.thumb.gif.6233f4a3d4b624c32bb3e58d72499c9d.gif)
-
2
-
-
17 minutes ago, Bubbler86 said:
For those that see the end coming, which it does appear that way right now on radar, HRRR has backfilling taking place as the coastal takes over. Jackpot still well to our south but snow not ending this early either per the HRRR.
already looking like it is along the PA/MD border. Just north of DC to just south of Harrisburg keep an eye out for the next couple hours.
-
1
-
-
28 minutes ago, Superstorm said:
I had stated that ratios would be 20:1 and many did not believe.
High ratio stuff coming.
.We will probably verify a little lower but yea kinda surprised myself it managed to get this high great snow growth with temps aloft near perfect.
-
1
-
-
It looks like ratios are sitting between 15 and 20:1 right now.
-
1
-


.gif.d5abd7c1b209feb23a7e51c91cc24776.gif)
.gif.73cecf8909e4ec64d06cfd3808644027.gif)
2024-2025 La Nina
in Weather Forecasting and Discussion
Posted
Gotta say it was pretty cool to see this happen. Im not sure if it is connected somehow but watch off Panama and then a few days later west of the Galapagos.