

so_whats_happening
-
Posts
1,059 -
Joined
-
Last visited
Content Type
Profiles
Blogs
Forums
American Weather
Media Demo
Store
Gallery
Posts posted by so_whats_happening
-
-
Down here at BWI until my shift ends have about 1.5" so far back and forth between moderate to heavy snow.
-
 2
2
-
-
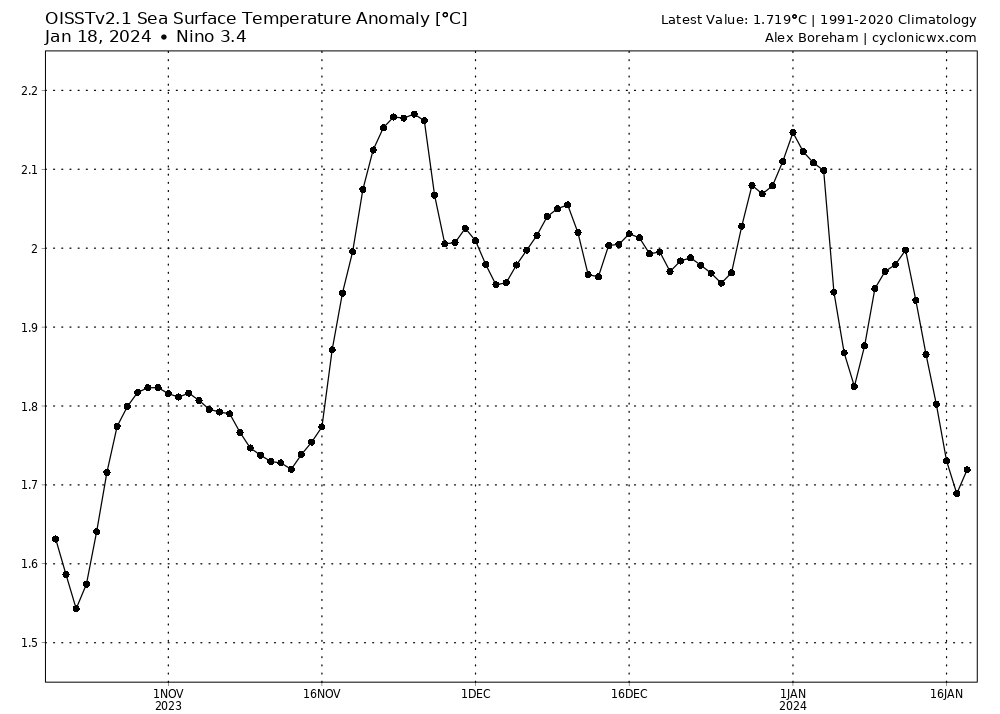
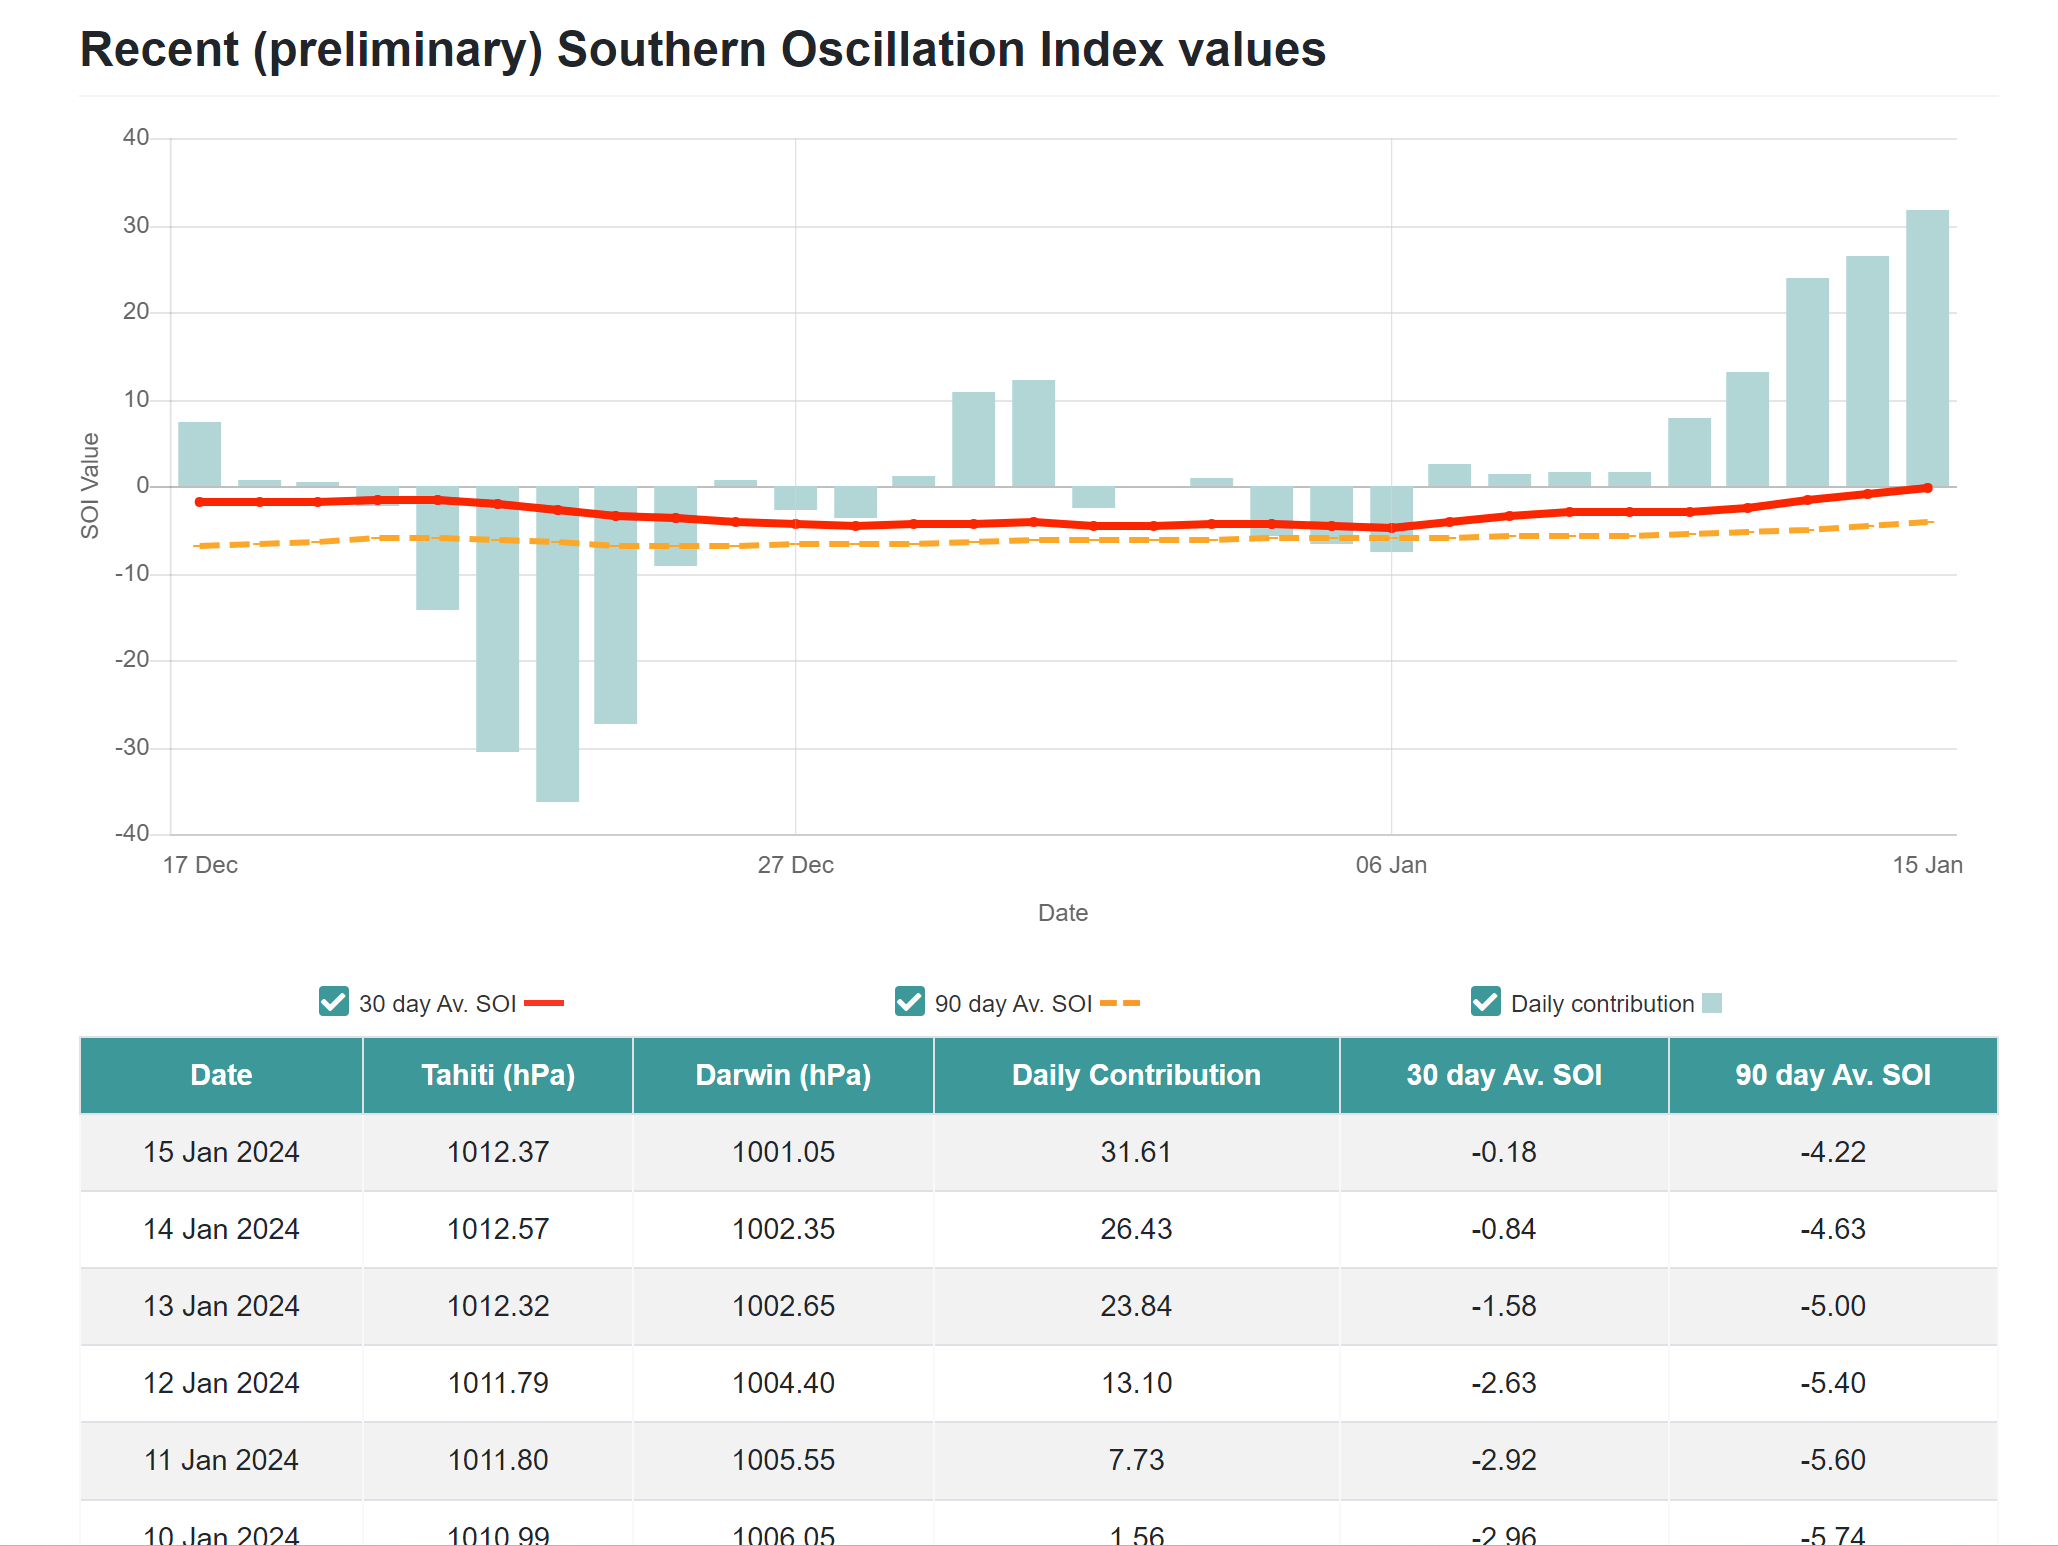
OISST dip in 3.4 to about 1.68 area is the first time since just before Halloween. With Trades supposed to be rather strong for the next week and half I would expect these number to continue to fall to about 1.5 ish area before we do some leveling out at the end of the month. Region 3 also starting to take a hit as this has held rather well thus far. If we do indeed fall that low into 3.4 for the last 2 weeks of the month we probably end up again at about 1.9 ONI for NDJ.
SOI should start to relax a bit coming up here and may even go negative briefly but if somehow the January mean ends up positive I'd have to look but I don't think that has happened, especially with where the Nino is standing. This -PDO pattern means business.
-
3
-
-
SOI going a little crazy right now both regions 3.4 and 4 are taking a tumble as well. Latest OISST Daily at 1.8 for 3.4 and 1.27 in 4 from about 1.6C area just two days ago. From looking at TAO the area from 140W to about 170E in the subsurface has cooled down a bit over the last week. It looks like we may have some more buoy data issues with TAO coming up giving it a funky look. Weekly OISST numbers for Jan 3rd and the 10th both sitting at 1.9 so we need those to stay around those levels for another weekly if that 1.91 ERSST as GaWx pointed out to get super ONI status.

-
1
-
-
Anyway can we keep the talk of long range forecasting out of an ENSO thread that seems explicitly due to MJO progression. Several times it has been brought up leading into winter that if the El Nino is in control the MJO should be virtually non existent. Im pretty sure there is another thread about it the SSW talk borders even being into another thread as well but ORH said he was fine with it. If he is also fine with this by all means.
-
1 minute ago, jbenedet said:
You’re in Lancaster PA. I’m in NNE.
I’m talking wrt my region, not yours.
My dude.
yea someone got under your skin. Boston hit 60 saturday...
-
 1
1
-
 1
1
-
-
53 minutes ago, jbenedet said:
We have about a week in 4-6 at high amplitude. Highest of the winter season. This is also immediately following peak ENSO conditions.
phase 7 is most likely destination thereafter which is also +AN.
I’m expecting a furnace in the northeast; but it won’t be reflected in guidance until we’re much closer in, around the 20th.My dude where were you not 3 days ago when we had back to back cutters and pushed mid to upper 50s for a day each time. Why all the sudden now is this being talked about? Feel like someone got under your skin.
-
On 1/12/2024 at 7:16 PM, jbenedet said:
Patience.
We shall see it is a rather quick pass showing up through 4-6 so Im not so sure we see more than a day or two spike close to those levels with storm action which isn't saying much because we had that not a week ago with the last 2 storms that tracked into the lakes. Ill stick with the mid to upper 40s call for now ahead of a cold front idea unless something drastically changes.
On 1/12/2024 at 11:01 PM, 40/70 Benchmark said:I missed his outlook...
Don't get me wrong, I love his stuff, but I wouldn't give anyone credit for "nailing" January 11 days in.
10 hours ago, griteater said:I believe he is referring to the ONI prediction contest from early September: https://www.americanwx.com/bb/topic/59534-what-strength-will-the-el-niño-peak-at-in-2023-2024/?do=findComment&comment=6992657
For Oct/Nov/Dec/Jan, I had: 1.8/2.0/2.0/1.9, Max tri-monthly in NDJ of 1.97
Actual for those months is: 1.72/2.02/2.07/?
In reality, my thoughts on the peak have waffled here and there. After the flat-lining in September, I didn't think it would get quite as warm as it has
Yea sorry it has been a bit of a busy weekend but yes this is what I was referencing @40/70 Benchmark it is not 100% but probably the closest I have seen someone forecast this thus far. Lets see if January can still hold 1.9. Either way it was a solid forecast for back in September. Also I feel the same way Griteater I have been back and forth in thinking it actually would get to this level. I still do feel this falls just short of super status though but again I don't think threshold really matters at this point just for record keeping.
On 1/13/2024 at 3:14 AM, snowman19 said:@so_whats_happening Looks like we are seeing the final warming of this event….it probably starts decaying in about a week or so from now

Im not sure about that final peak you may be thinking there is no lack of trade winds, in fact trades are at strong levels right now so this should start the cooling process. There looks to be a slight weakening coming up toward the end of the month which I think will end up just being a push of the subsurface cold pool further east. Ill post TAO updates over the next few days, today's update already shows a cooler western 3.4 and 4 subsurface look and the +5 anomalies in the eastern region 3 cooling again.
-
I mean if you somehow think going through 4-6 will not yield a warmer pattern... especially at this amplitude of mjo. I just have to say best of luck. Torch ehhh probably not but warmer than average sure and being at the lowest point of the year in averages a +10 anomaly around here would be something like mid 40s and low 30s at night.
When we start seeing mid to upper 50s even 60s regularly let me know cause then that is a straight up torch fest. I had mid 70s about 6-7 years ago for two winters in february for like 2 days. Even had thunderstorms and hail lol.
-
1
-
-
18 minutes ago, so_whats_happening said:
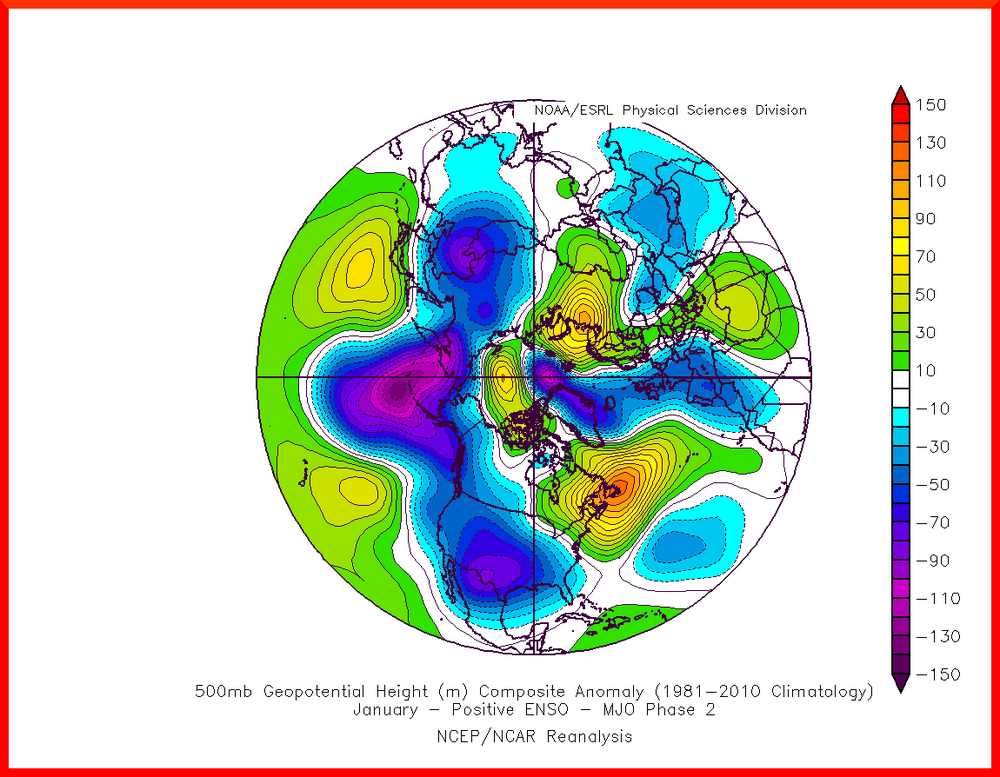
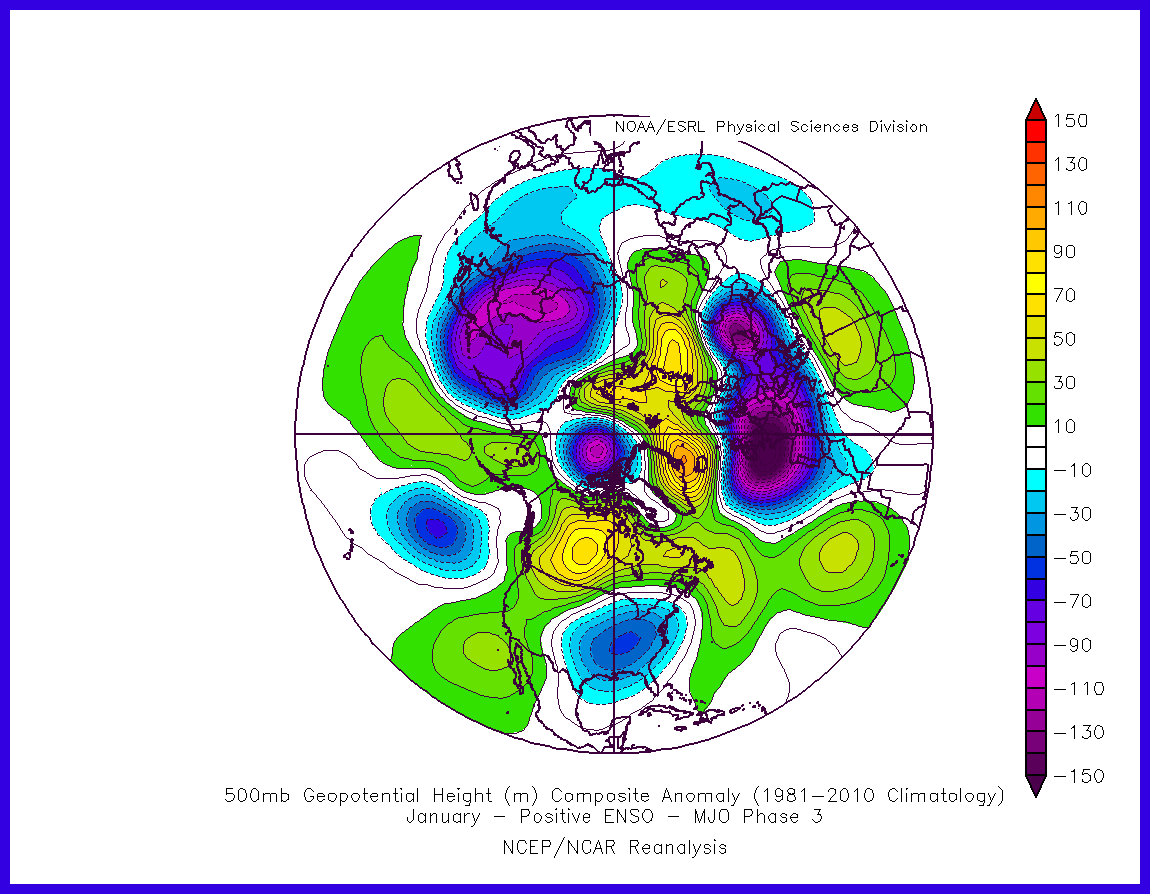
@GaWx It is not perfect but phase 2 was about the 29th- 2nd this was the pattern for the 2nd-8th and here is phase 3 which I would expect a longer period of east or TN valley troughing before we do a quick scoot through to 3-4-5 around mid month to the 3rd week.
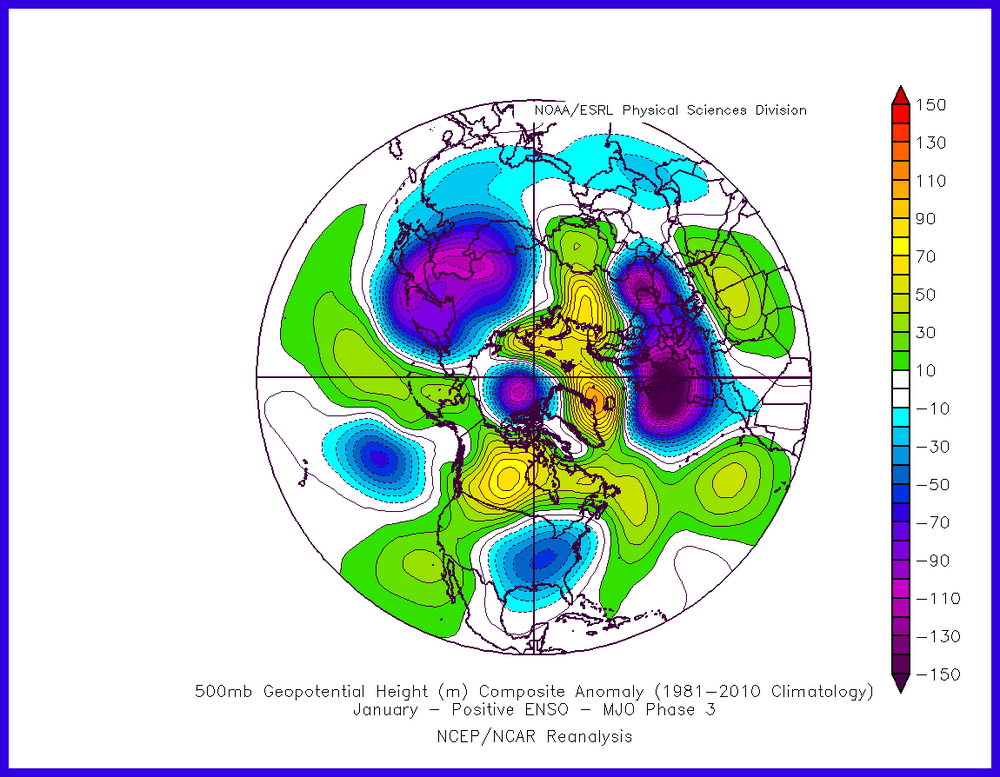
What I think will be nice from this is that we may get a final attack on the SPV coming up from this MJO movement but we are already coming up on the end of the season anyway by the time this rolls through sooo not really sure many would want this to happen if you are hoping for a warm spring.
-
1
-
-
@GaWx It is not perfect but phase 2 was about the 29th- 2nd this was the pattern for the 2nd-8th and here is phase 3 which I would expect a longer period of east or TN valley troughing before we do a quick scoot through to 3-4-5 around mid month to the 3rd week.
-
 1
1
-
-
Quite the change in the subsurface going on. First time we have introduced a -3, it also does not seem like the central to WPAC will cool all too much in the subsurface in the next month so we may see some rather drastic changes in the EPAC coming up over the month. With trades looking at the upper echelon of values I think any further warming is not expected. The westerlies that do develop around 100-120E I think will help in pushing that cold pool eastward later in the month and by February we start tumble rather quickly in 3 and eastern 3.4 with 1+2 maybe going negative for the first time in almost a year. Of course we will have to wait and see how it progresses but just some thoughts of the progression.
.thumb.gif.06a60bfe6d6585b89e9d059cfe063230.gif)
.thumb.gif.2a1500fbb8266c8acc945edd37aa6fdf.gif)
-
2
-
-
I hate to break up this patting of the back but @griteaternailed the temps monthly and ONI. Well deserved applause.
-
4
-
1
-
-
Here is a nice visual for those who want vertical structure looks. The GFS run as of 1/09 has two distinct lobes in lower strat to about 30mb (20mb may be a stretch) so it does seem as though there are some connections that may happen for a bit to tropospheric weather patterns even with a non full split scenario.
-
1
-
-
2 hours ago, GaWx said:
1. The ND MEI came in at +1.1. That’s quite a comeback from the mere +0.4 of SO. Actually, this 0.7 rise is the largest on record (back to 1979). I think this bodes well for Feb potential:
https://psl.noaa.gov/enso/mei/
2. The 0Z GFS looks awfully close to a major SSW on 1/17.
At this point for a major SSW I would expect it closer to February now, if at all. (Typical of what we have seen of recent SSW events) I originally thought mid month (January) way back in late November early December when we had our first warming take place. This does not look to be the case for a full split right now as the Atlantic is still not working for us. I was hopeful to see the larger storms and more cyclonic wave breaks happen in the last month but we just do no have it consistently happening. Who knows maybe we will have a little curveball thrown our way to help lock the pattern in.
For it to be an actual split you need two distinct lobes. Pinching off a small section or stretching it out do not count as an official major SSW event. I should say not all major SSWs have a split occurring, there are times where the SPV it just obliterated by an exceptionally large wave 1 response this does not seem to be the case. As 40/70 Benchmark has stated Im not sure it will really matter too much going forward as the 500mb pattern that is setting up looks rather nice as we get to the second half of January and maybe continuing into February? The split would only help sustain the pattern longer. Will definitely be watching how it unfolds going forward.
-
1
-
-
Some pretty substantial trades are making there way to much of the Pacific last little bark right now in the far eastern Pacific.
.thumb.gif.e9914cc0863bc6217bff64165ee618da.gif)
-
12 hours ago, LibertyBell said:
a good question is what would it take to get rid of that WPAC warm pool?
It seems to be taming down just very slowly. I assume you are referencing the waters off Japan. If you are talking about near the Maritime Continent yea good luck with that one.
11 hours ago, donsutherland1 said:That cities such as Boston, New York, and Philadelphia have seen below normal snowfall so far this winter does not necessarily mean that they will have a horrible season. Most of the seasonal snowfall during strong El Niño events falls after January 15th. For example, at New York City, approximately 75% of seasonal snowfall occurs after January 15th in such cases and 50% on or after February 1st.
For what it's worth, my seasonal snowfall guesses for select cities were as follows:
DCA _NYC _BOS __ ORD _DTW _BUF ____ DEN _ SEA _ BTV
11.5 15.0 27.5 27.0 38.5 85.0 56.5 1.2 70.0
Wouldn't it be something if ORD and DTW pull some crazy totals coming up here. At least it seems to be setting up the colder pattern as we enter the second half of January.
-
1
-
1
-
-
Quick update there was a brief outage it looks like around christmas time but since seems ok now.
.thumb.gif.eaa5a44c4fe91512614d1ceeda8d0489.gif)
-
2 hours ago, raindancewx said:
WPO finished at the highest value on the index in several decades for December, just above December 2006. Dec 1982 had an extremely +WPO look as well, that's one of the reasons I liked it as a main analog.
Cold dump on the models is in the right place at the right time based on the lag from an intense +WPO tendency. The high value of the WPO juices up the correlation essentially.


Happen to have a good site to get WPO/EPO data?
-
Sorry wanted to do this after I got back from the garage but had to sleep coming off work. @GaWx
Anyway I don't have a particular average for lag to the pattern most I use is about a week but it probably really depends on amplitude and speed of the wave more than I truly know unfortunately. It is not to discredit those composites as they are useful to help get some pattern recognition, but personally they aren't always correct in placement or intensity. If we take this last round of MJO movement from Phase 6 through to Phase 1 before the new year.
Dec 8-12th weak phase 6, Dec 15-18th weak phase 7, Dec 18th-22nd weak phase 8, Dec 23rd-29th over 1 wave in phase 1. Made a temp plot (surface based) to show the changes.
.gif.81d2b1ea0e42235e97f3d1a8cfc05fea.gif)
We don't seem to quite be hitting those marks as shown above, I know it is not perfect and maybe there is a chance the 500mb pattern responded a bit quicker to the type of progression. I tried to slow them down as much as I could so that you could see the date progression I should have labeled it but 3am stuff. I think this is an important part that needs to be recognized with the use of the composites. It would be better to maybe compare 500mb or 200mb pattern and get a better idea of what could be versus temps specifically especially in the weaker version of the phase. I also would like to explore further into the actual lagged composites section right above it a little more and get a better explanation.
-
2
-
1
-
-
1 hour ago, GaWx said:
I understand the concept of a lag from the MJO (tropics) to the mid latitudes. That makes perfect sense and thus I’m not disputing it. By the way, how many days is the average lag?
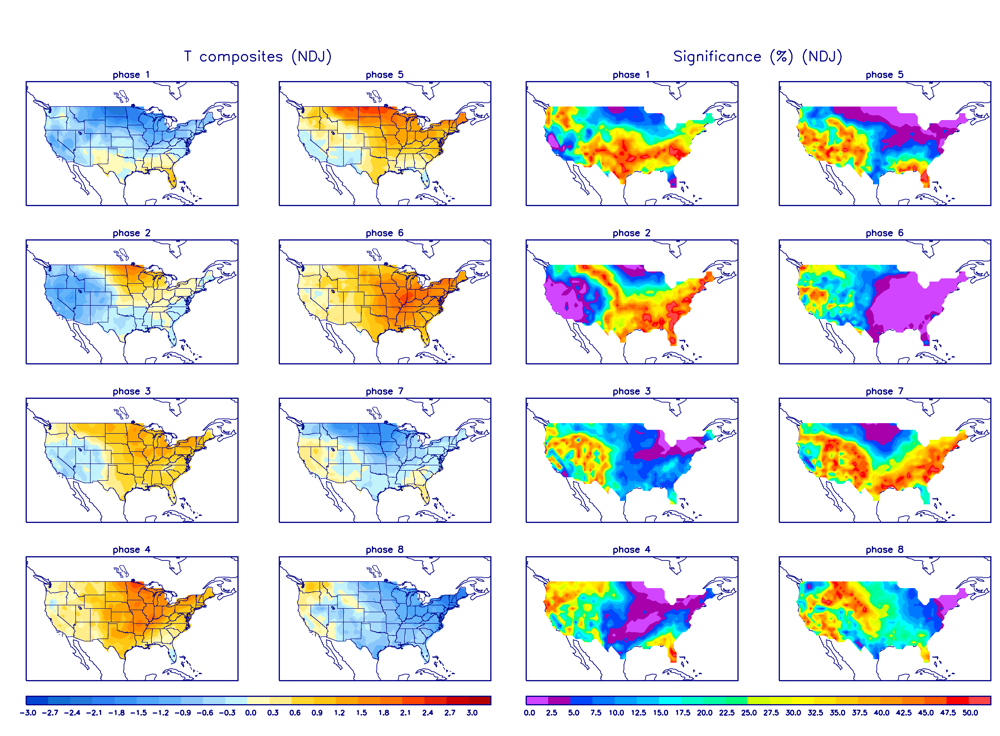
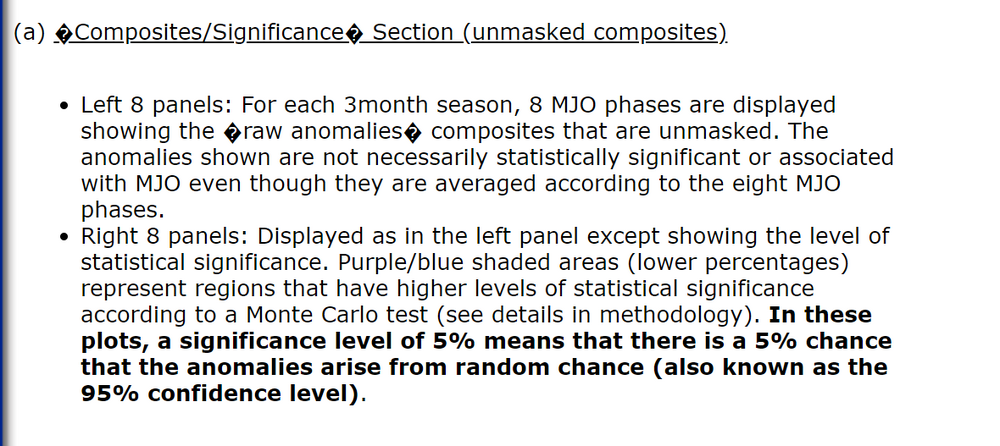
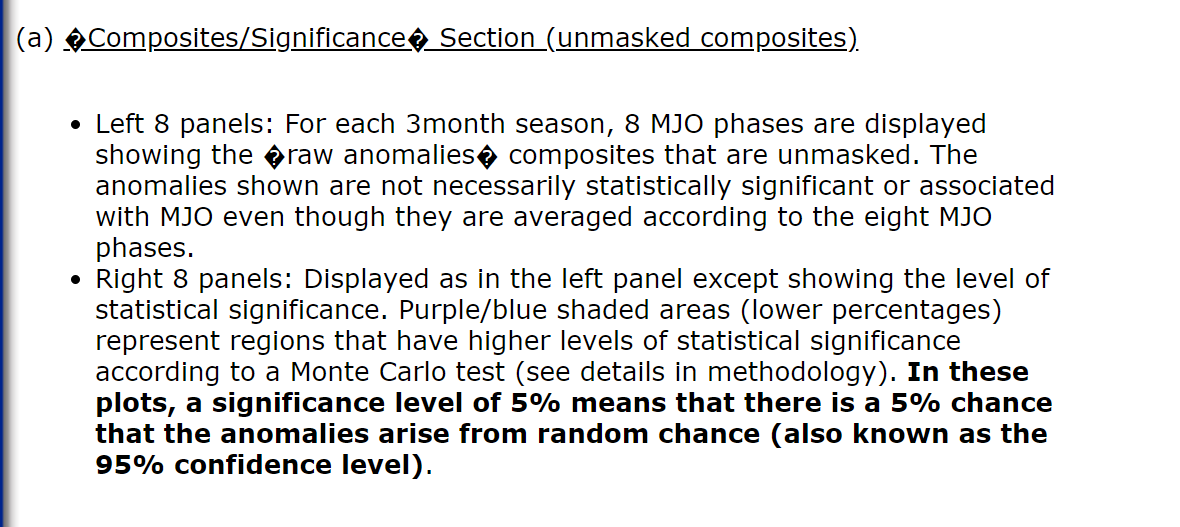
But this is tricky imho. Check this out, the link to the MJO/US temperature composites that I look at:https://www.cpc.ncep.noaa.gov/products/precip/CWlink/MJO/Composites/Temperature/
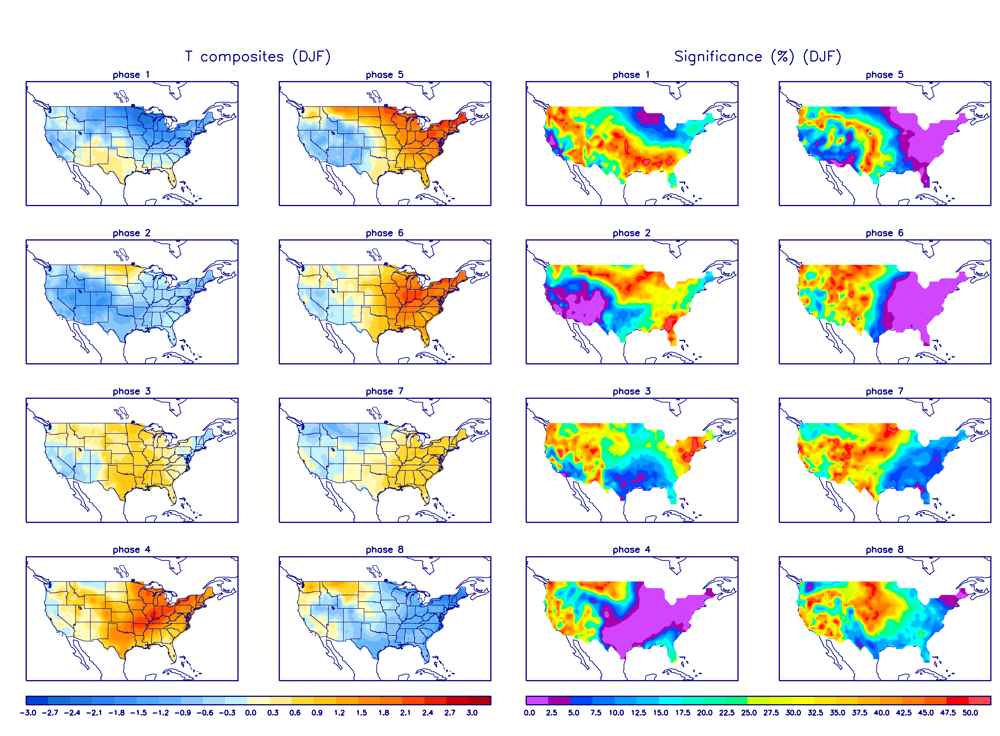
From that link, here are the DJF composites, for example:
In the “Information” section linked below that goes along with these composites, it says nothing about lag between these composite maps and the respective phase noted for each map:https://www.cpc.ncep.noaa.gov/products/precip/CWlink/MJO/Composites/Temperature/readme.shtml
As I see it, these composites aren’t actually disputing that there is a lag. Rather, they are the after effects of a lag. For example, let’s look at phase 8. The concurrent temperatures average BN in the E US. But in reality, these BN temperatures have to have been a result of a lag from what was earlier initiated in the tropics (an earlier MJO phase) rather than from phase 8, itself. I’m educatedly guessing that this earlier phase is 7 in a large % of cases since the MJO typically rotates counterclockwise.
Which phase in a particular case would be dependent on the number of days of the lag for it. If the lag for a particular case is, say, 5 days, we need to see where the MJO was 5 days earlier for that case. Let’s say it was in phase 7 five days earlier. Let’s say it was BN in the E US five days later. Thus it was in reality the phase 7 of five days earlier rather than phase 8, itself, that lead to the BN E US five days later, which happened to be during phase 8. So, as I see it, what resulted in the BN in the E US during phase 8 actually likely originated from what was happening earlier in the tropics during phase 7.
So, even though these composites show concurrent E US temps during phase 7 to average AN, that AN is apparently actually a lagged effect from an earlier phase (say phase 6 in many cases). Phase 7, itself, is probably associated with a BN E US but due to lag the BN doesn’t occur til the MJO has moved into phase 8.
So, the E US warmth during phase 4/5/6 is likely largely a lagged effect from phase 3/4/5. The E US cold during phase 8/1/2 is likely largely a lagged effect from phase 7/8/1, etc.
The extreme cold of 12/23-7/2022, which occurred during phase 5, was likely a lagged effect of phase 4 since it was mainly in phase 4 during 12/8-22/2022.
14 minutes ago, stadiumwave said:This is not 100% accurate. There is "sometimes" a lag that's either brief or moderate & there are times that there's hardly lag at all.
I didn't read what yall were arguing about just your statement. "Sometimes" & at differing intervals is more accurate.
9 minutes ago, GaWx said:Actually, I think I’m largely in agreement with @so_whats_happening.Wouldn’t it make sense that there always (not just sometimes) is a lag (of however many days, which would vary from case to case) between what happens in the tropics/MJO and what happens in the middle latitudes (E US temperatures for example)?
However, my agreement doesn’t mean that I shouldn’t still use those composite maps for concurrent. I think that’s where we disagree. It is tricky.
Sorry ill get back to these later on doing this on a cellphone is not going to work out so well lol
-
1
-
-
13 hours ago, GaWx said:
Not necessarily. Last winter’s coldest (near Christmas) had a similarly strong MC MJO. Also, Jan 20-31 of 1978 had similar. MJO, just like most indices, tells us what usually happens as opposed to what nearly always happens. I should add that I haven’t seen a GEFS EPO forecast. Anyone see it? I suspect that might be negative, which would be favorable.
If we can't agree yet that there is a lag between MJO phase and the effects toward mid latitude then I don't know what.
-
1
-
-
2 hours ago, GaWx said:
-The ONI for OND came in at +1.94, not quite super.
-The RONI for OND came in at +1.51, barely strong.
-Dec ERSST came in at +2.07 vs the Dec OISST of +1.99. So, ERSST continues to come in slightly warmer than OISST, which may be significant going forward as we see whether or not unrounded NDJ ONI comes in at +2.00+, which would give us a super.
-Nov ERSST was +2.02. So, to get a super for NDJ, Jan ERSST only needs to be +1.91. With the slightly cooler OISST now up at +2.10, I consider that chance to be high as of now.
Some of the more intense trades we have seen so far are coming over the next 2 weeks. Looking like a race to see how long it can sustain itself. If region 3 begins to cool rapidly coming up the chances seem to fall quite a bit. Surprised december came in a little warmer than thought.
-
1
-
-
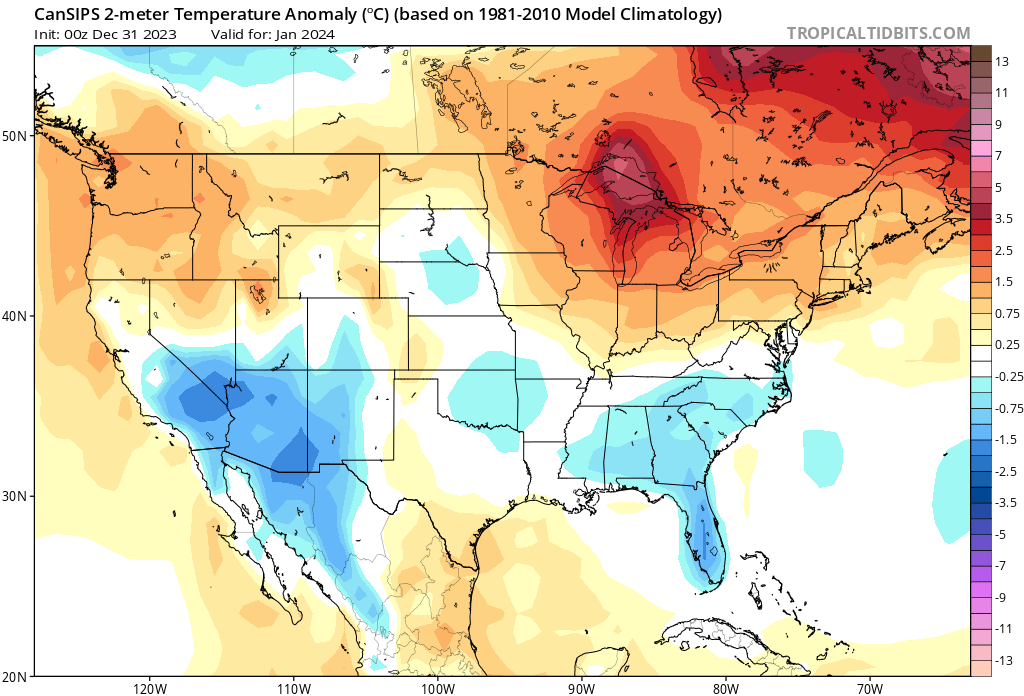
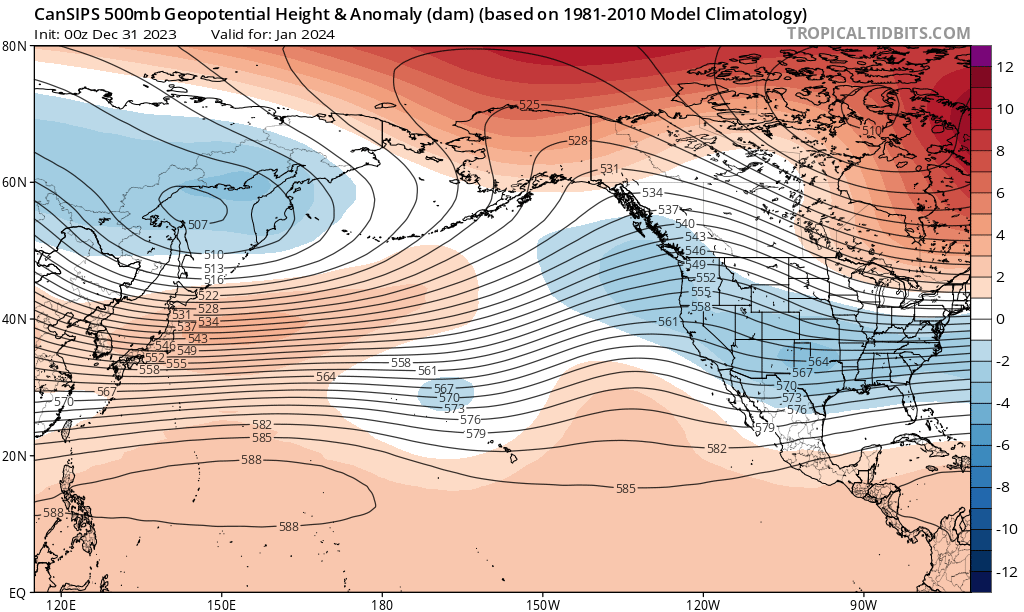
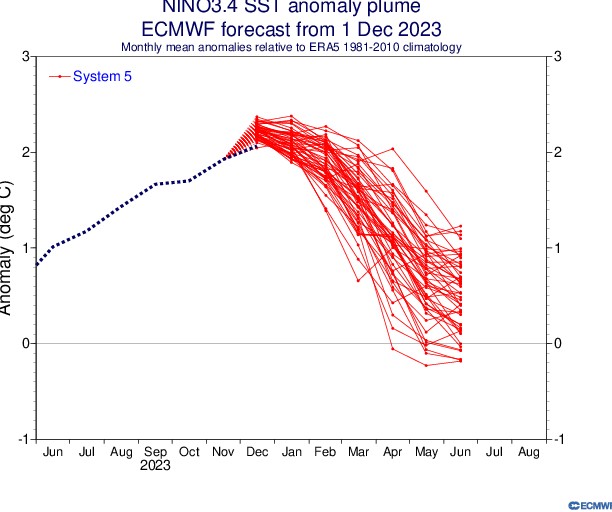
3 hours ago, raindancewx said:
Canadian look for January is in finally. It has weakened the transition of the El Nino to the West, and has a much weaker, but east based look throughout Jan-Mar. By Apr-May, we are rapidly transitioning into an east based La Nina. I suspect the Spring will be a bit like 2005, but it's early.
The models have been forecasting to much warmth with this event for months, even at short ranges. So I think a faster collapse of the El Nino is possible. No reason to think we verify on the warm side of the Euro plume.
Not even sure a modoki la nina pattern can be a thing but the warm pool in the subsurface near the dateline is not fading like we typically see, especially in what are considered east based events. Wonder if we hold a nice warm pool in region 4 and western 3.4 into next winter?
It does look like region 3 is about to cliff dive coming up through january.
-
2
-
-
1 hour ago, eddygeeme said:
Hey man I had a account here a while ago. It sucks having the crew scattered from over there. The thing I'll miss is the banter and tracking every ones opinions and winter IMBY stories and tracking mods up until the bog storm. The only thing I don't like here is the sub categories you won't get that here.
Head over to weather sphere. Wxsphere.com alot of old handles from accu days over there if you are interested!
-
3
-


.gif.ce3127c249f1c19a6b3227566b52ebdc.gif)
.gif.489bcf70750b9126c0e9dc0ed591de2b.gif)
.gif.8d59e5a4e4b6f17357b52703126182ca.gif)

.gif.f953e88f12144cc07d46415ffa7e21cf.gif)
Central PA Winter 23/24
in Upstate New York/Pennsylvania
Posted
Lol second shift this week dealing with this, not what I wanna be doing right now. Can kinda see where the northern extent is setting up already. Should manage 2-4" still up that way thinking 3-5" back at home in Lanc.