

gymengineer
-
Posts
3,242 -
Joined
-
Last visited
Content Type
Profiles
Blogs
Forums
American Weather
Media Demo
Store
Gallery
Posts posted by gymengineer
-
-
I’m glad the Wilmington radar just came back online. To be missing both that and the Moorehead City one would make tracking these training cells much more difficult.
-
Other than Isaac before it got upgraded to a hurricane, this must be the highest storm surge forecast for a tropical storm.

STORM SURGE:
The Neuse, Pamlico, Pungo, and Bay Rivers...8-12 ft
-
Cape Fear River at Wilmington just beat the record crest from Matthew in 2016.
-
 1
1
-
 1
1
-
-
19 minutes ago, TriPol said:
Has there ever been a storm that's stalled right before making landfall in the Carolinas?
Check out Hurricane Diana (1984).
-
I hope Ian doesn't mind me posting this here- this is on his website from a couple of years ago: D.C.’s double-digit snowstorms: A history and guide to the patterns that produced them
-
22 hours ago, psuhoffman said:
With the down period we're in I thought it was a good time to resurrect this thread and further the discussion from last year. I realized lately that while we did a good job touching on what is a perfect pattern for snow that we didn't really discuss all the different variables that factor into the "trade off" that happens when there is a less then perfect pattern. And those scenarios make up 90% of our snowfall events so it's not really useful to only focus on the textbook perfect HECS setups.
So first of all its important to look into the WHY of the textbook HECS cases first for comparison.
This is the composite H5 mean of our 6 unquestioned HECS events in the last 40 years.
So what makes that the "perfect" look. The single most important feature is what sin the box there...the ridge over trough in the north atlantic centered over greenlands longitude. The ridging over greenland is what we call the greenland block. The trough south of it is the 50/50 low. The ridging forces systems under it which promotes the troughing into the 50/50 locations. The combination of flow around the Greenland high and the 50/50 low promotes cold air into the northeast US. Also, confluence (merging of air flow) promotes high pressure. The confluence of the flow around the 50/50 with where it meets the westerly flow of the jet coming across the CONUS promotes high pressure to our north. This is even more pronounced with a split flow.
Also keep in mind these features arent all or nothing. That isn't JUST a -NAO, its a greenland block. Not ever bit of ridging over greenland is a block. Yes it helps but that look there is classic because its a perfect block. The strength of that block will really slow down the flow and force systems under it. Keep that in mind when we look at the other features on that map. The indication of an STJ is there with the lower heights down along the gulf coast. That is of course desirable. But look at the Pacific. Without that look in the atlantic that would be crap. I made the point about the blocking because people keep throwing around the whole Pacific v Atlantic thing and its not an all or nothing debate. With just some nao ridging that pacific would probably blast pacific air across. Yes there is a split flow indicated there but that trough location off the west coast isn't gonna cut it without the atlantic blocking. So yea if we only have some nao help having a crap pacific will ruin it. But if its one of those rare cases with off the charts 3std blocking then you actually WANT the crap pacific.
The Greenland block is so strong in the other five events that PDII's decidedly different look didn't even water it down in your composite map. I think 02/03 is a fun season to look at because even less than 'lock and loaded' DC looks-- including you pointing out how the 12/02 and the early 2/03 moderate events happened- yielded an extreme seasonal total.
-
13 minutes ago, PrinceFrederickWx said:
Snowing hard here and sticking to everything.
Great to see. I've really appreciated your posts, particularly reminding the subforum that the past two winters weren't a 'disaster' for many parts of the lower Mid-Atlantic.
-
1
-
-
6 minutes ago, cmasty1978 said:
lan is definitely hot garbage and has been for its entire existence. the WPAC is the land of gods. show some respect to real legendary typhoons. let this one go.
135kt max and extratropical turning crap into japan is zzzzz
Drunk? lower case writing, weird non-factual phrasings, etc.
-
As its just south of Tokyo 24 HRS, VALID AT: 221800Z --- 34.1N 138.8E MAX SUSTAINED WINDS - 105 KT, GUSTS 130 KT WIND RADII VALID OVER OPEN WATER ONLY EXTRATROPICAL RADIUS OF 064 KT WINDS - 070 NM NORTHEAST QUADRANT 070 NM SOUTHEAST QUADRANT 075 NM SOUTHWEST QUADRANT 060 NM NORTHWEST QUADRANT RADIUS OF 050 KT WINDS - 220 NM NORTHEAST QUADRANT 215 NM SOUTHEAST QUADRANT 180 NM SOUTHWEST QUADRANT 180 NM NORTHWEST QUADRANT RADIUS OF 034 KT WINDS - 445 NM NORTHEAST QUADRANT 410 NM SOUTHEAST QUADRANT 340 NM SOUTHWEST QUADRANT 395 NM NORTHWEST QUADRANT -
34 minutes ago, LongBeachSurfFreak said:
I would do anything for a satalite loop of the hurricane of 1938. I would love to know what it's actual structure was at time of landfall in NY
For me, it would be a radar loop of Carol making landfall. Perhaps the most purely tropical hit of the famous New England storms?
-
1 hour ago, cmasty1978 said:
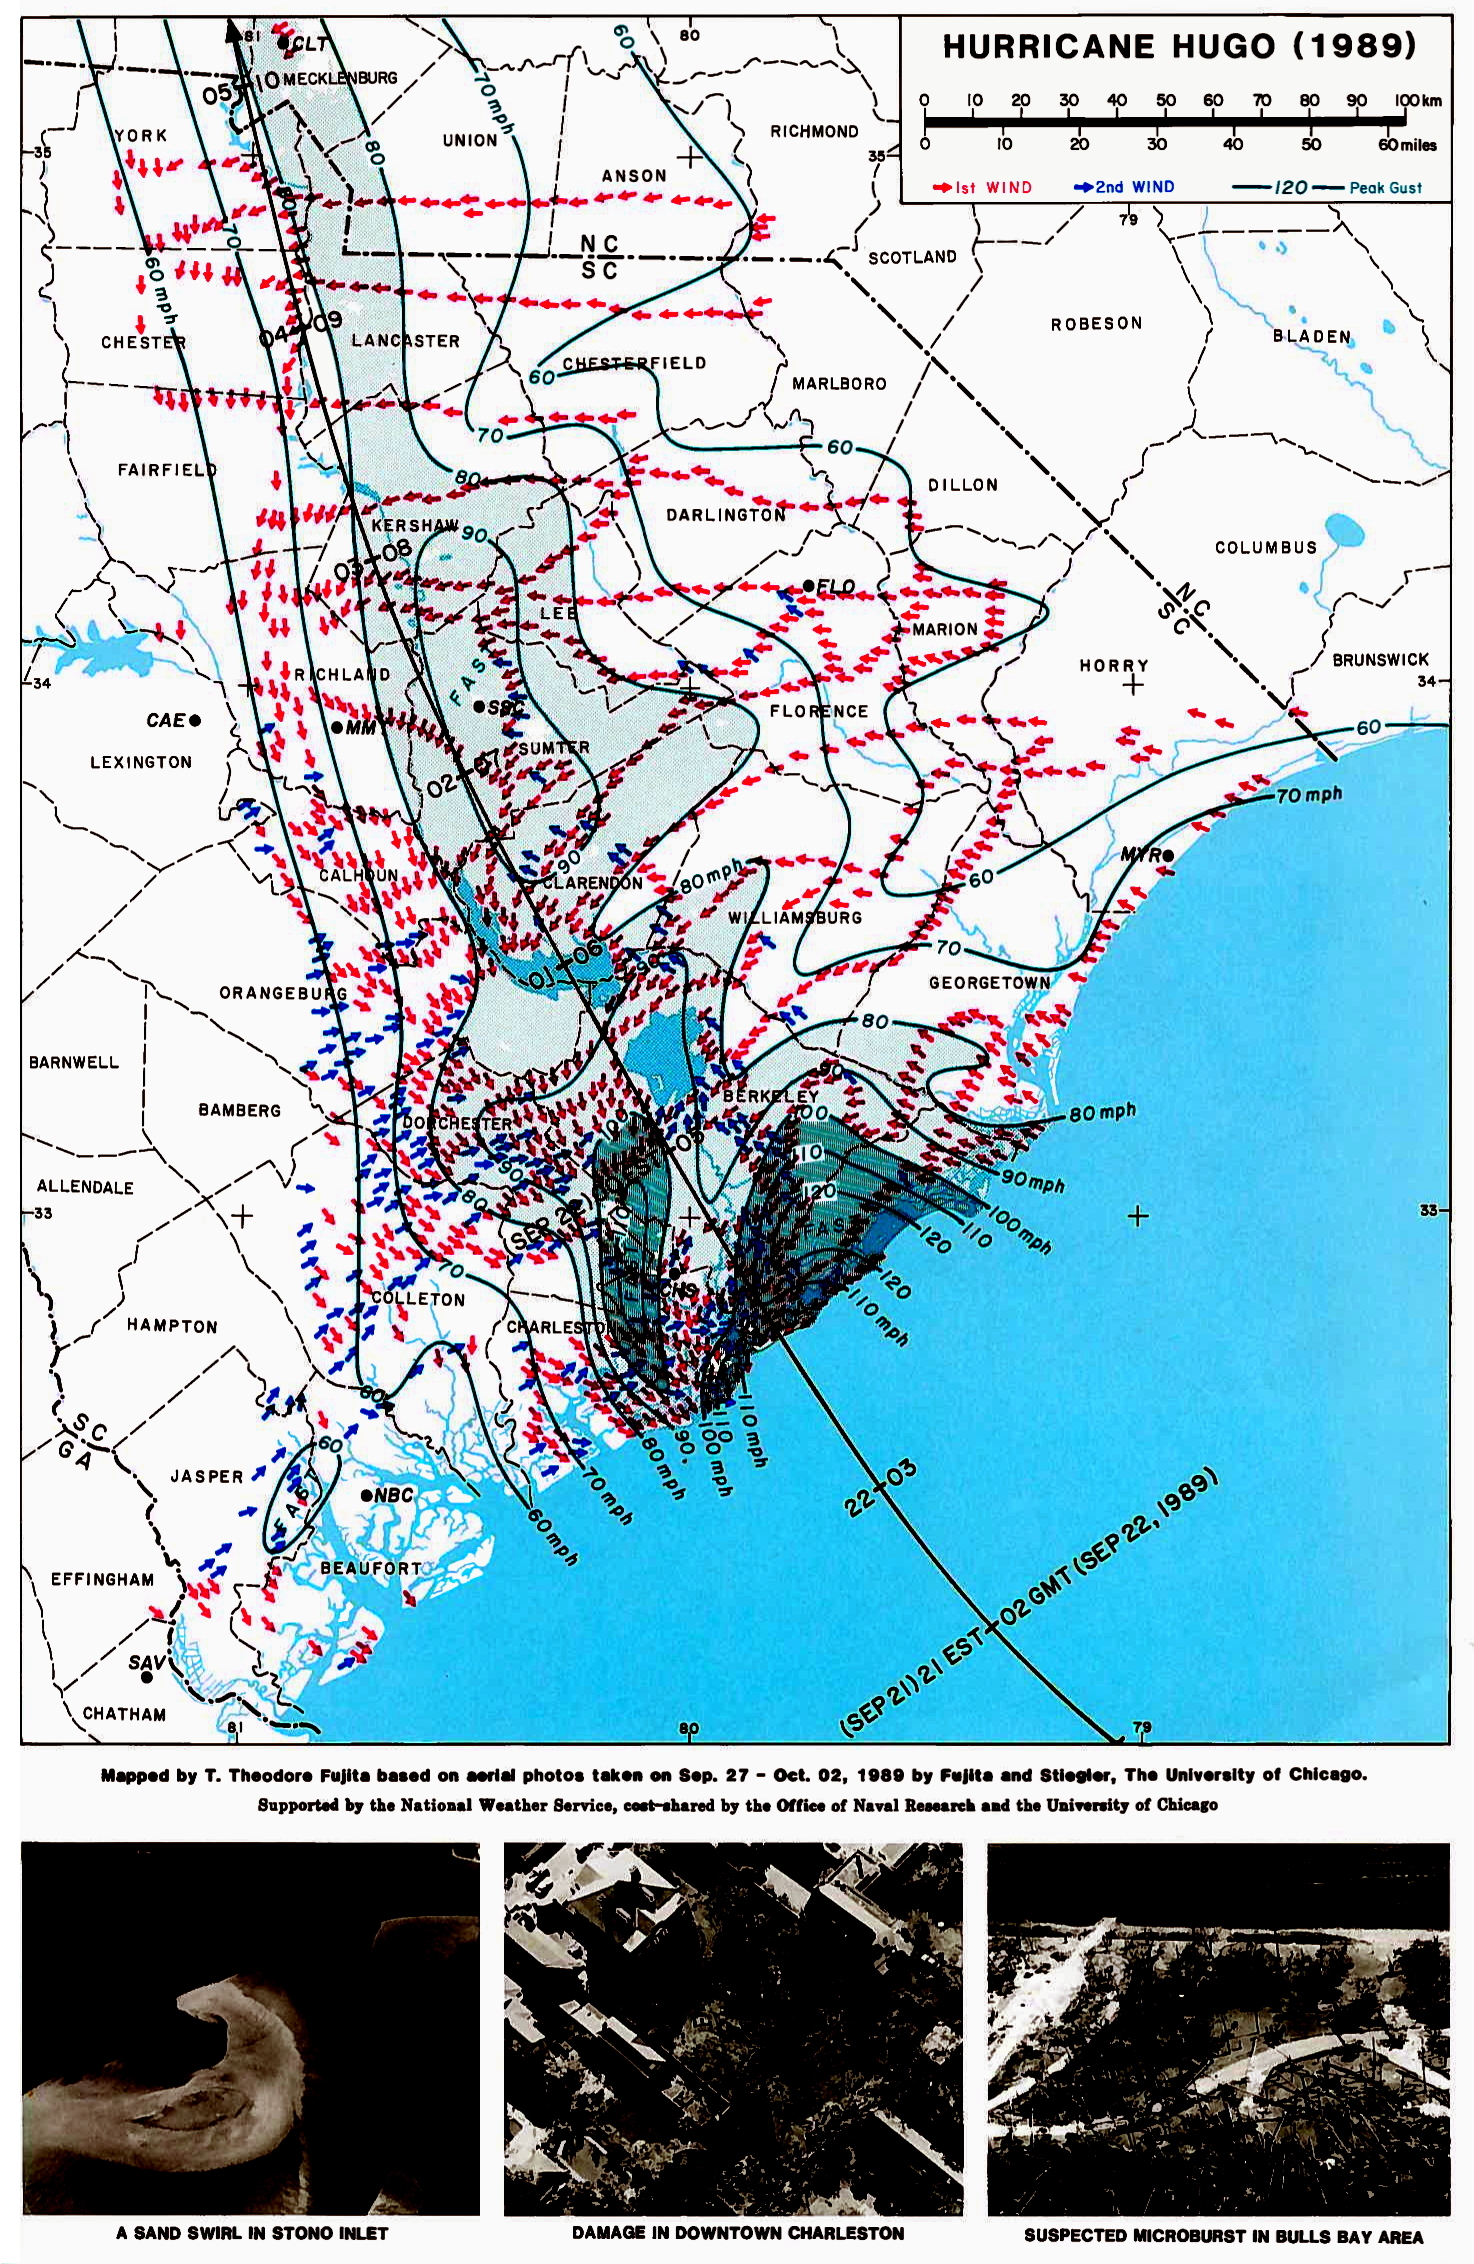
^A vessel docked inland on one of the rivers recorded 120 sustained but it was a bit above 10m if I remember correctly. I think the areas that received the highest winds weren't sampled, and even if they were I am not sure how Fujita would have distinguised between wind and surge damage since the worst of both were likely collocated.
That Sampit River boat reading of 120 mph (~60 ft elevation) would again support a higher maximum gust estimate in the RMW zone. Since I support the NHC's assigned landfall intensity, the other data indicating Category 4 is what made his wind map based on damage to trees and structures stand out as an outlier.
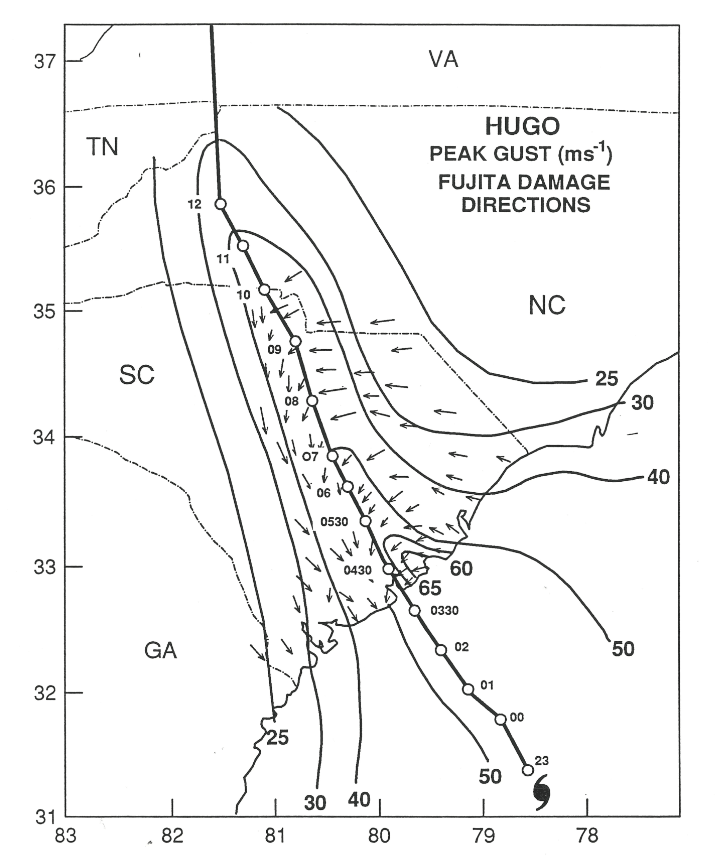
Hmm, to add some more confusion, this other map does not match the original one I imbedded. It's somehow tied to Fujita as well, but has a zone of 145 mph+ gusts:
-
Here's one: Hugo was clearly a Category 4 in its SC landfall based on recon data. The wind map of peak gusts created by Fujita himself was strangely tepid in the eyewall zone. It's even more curious since the Fujita scale wind increments would later be *lowered* after his death, meaning his own estimates of wind speeds corresponding to levels of damage were deemed as over-estimates.
-
1
-
-
The firm AIR is estimating 40-85 billion dollars in just insured damage from Maria and noting more than half of Puerto Rico's residences are uninsured. That's higher than their estimate for the other two hurricanes. Katrina's insured damage was 41 billion.
-
1
-
-
The damage videos show widespread roof-off/collapsed buildings across the entire width of the island. It's hard to find examples of Atlantic storms that have caused this type of high-end wind damage upon as large a population.
-
3 minutes ago, HoarfrostHubb said:
Any analogs to the odd due east track the 12z GFS has for Maria once it is abeam of the Carolinas?
Starting from a different longitude, but Cleo 1964:

-
1
-
-
13 minutes ago, Paragon said:
I was looking for this before but couldn't find it, what was the strongest TC to directly make landfall on Puerto Rico?
The San Felipe II hurricane in 1928. Reanalysis kept the 140 kt landfall at 931 mb. It was a much larger hurricane than Maria.
-
Just now, wxmx said:
The San Narciso hurricane from 1867 would be near the worst case scenario for San Juan, had it kept it's intensity as a major for
 a little longer.
Yup, local geography really matters. For example, people reflexively thought that New Orleans being on the left side of Katrina would diminish impact. But the 15-19' storm surge in the eastern part of the city is not far from the top end event (ESE to WNW path just south of the city) because that north wind across a body of water as large as Lake Pontchartrain really effectively piled up the water.
-
Just now, NJwx85 said:
It's not going to matter much for San Juan as long as they stay in the RFQ.
For those that have never been there, San Juan has an expansive, highly developed water front. I am not sure how susceptible it is to storm surge, but it doesn't appear to be very protected. This is close to the area where the cruise ships dock.
Yup, I'm agreeing with you that San Juan right now look more likely to be on the right side of the hurricane than the left side, as some of those hurricane models are showing. We go to San Juan at least twice a year, always staying at La Concha. The NHC is forecasting 6-9' surge, which is a pretty extreme event for the island. Hugo, for reference, was a 2-3' storm surge along the north coast of PR.
-
Remember, the NHC track is on the southern edge of those hurricane model tracks. So far, Maria is almost spot on following the NHC's track, which has landfall on the southeastern coast of the island.
-
IAD pulled off 0.6" today-- must be from the squalls. They are now 0.6" away from a tie.
-
11 minutes ago, WxUSAF said:
Maybe it did and I just forgot. But I remember having no issues driving to work.
It melted on paved surfaces soon after sunrise, and by late March, the sun is up during most people's commute. So you're definitely right that it had minimal commuting impacts. I just enjoy a moderate snowstorm no matter what time of year. Seeing grass completely covered makes me happy.
-
4 minutes ago, WxUSAF said:
I thought 3/25/13 was ridiculous. I had ~6", nothing on the streets, didn't even get a day off work, and it was all gone by lunch.
Wait, how did it accumulate on streets here and not where you are?
See the photos from Wheaton and Savage:
I'm pretty sure Matt has posted pics of snow on paved surfaces in DC that early morning too.
-
25 minutes ago, WxUSAF said:
My WAG is IAD and BWI at least get a fraction of an inch in February and then all 3 airports get 3" of slop overnight in mid-March that melts by 10am. It's like 12-13 but even worse.
And I will still enjoy that 3" slop storm.
") I have very pleasant memories of 3/24-25/13.
I have very pleasant memories of 3/24-25/13.
My jumping date is 4/7 in any winter-- the end date of the last ground covering snow in my lifetime. (1990- 3.8" at IAD)
-
Really don't think the events are close at all. The area of 20-30" was much greater in 96.
Area is one measure. Population impacted is another. There's mixed data for the two, but again, based on what everyone is describing in this thread, it all comes down to what the storms did in each person's backyard.
Here's NCDC's population data (compiled for the RSI) that I posted in another thread, normalized to the 2010 census data:
For population affected by >=20":
1) 1/96: 28,928,278
2) 1/16: 21,000,936
3) 2/03: 19,242,275
4) 12/47: 13,501,073
5) 2/13: 10,662,789
For population affected by >=30":
1) 2/69 (late February New England storm): 2,009,520
2) 11/50: 1,207,570
3) 2/78: 1,169,430
4) 1/16: 1,121,182
5) 3/93: 729,753
6) late 2/10 (the NY storm): 677,436
7) 1/66 (including lake effect): 611,484
8) looks off with a huge spread in dates (2/25/1900- 3/2/1900): 526,154
9) 1/96: 493,778
So from the NCDC data, 1/96 and 1/16 were the most widespread 20"+ population impacts for northeastern snowstorms. And 1/16 more than doubled 1/96's population affected by 30". Of course, the NYC area covered a lot of the population, but both 1/96 and 1/16 were 20"+ storms for the NYC area.

September Discobs Thread
in Mid Atlantic
Posted