

chubbs
-
Posts
3,908 -
Joined
-
Last visited
Content Type
Profiles
Blogs
Forums
American Weather
Media Demo
Store
Gallery
Posts posted by chubbs
-
-
1 hour ago, bluewave said:
This is one long range forecast that we hope is incorrect. But would match what we have been seeing in recent years with the record SSTs and rapid hurricane intensifications near landfall. So it’s something to be aware of.
Didn't know whether to laugh or cry at these 2 para:
Paul-Arthur Monerie, lead author of the research at the National Centre for Atmospheric Science at the University of Reading, said, "Until now, hurricane predictions have been like trying to see through a dense fog as we could only make out what was directly ahead of us.
"Better forecasting clears that fog away, revealing patterns years into the future. This advancement gives coastal communities precious time to prepare. Our study shows hurricane activity is set to increase through 2030, giving everyone more time to prepare and protect themselves."
-
Arctic sea ice hasn't fully recovered from dip in late Jan/early Feb. A record low maxima looking more and more likely.

-
 1
1
-
 1
1
-
-
One problem: we haven't been in the current climate long enough to experience a full range of conditions. We don't know what a normal hurricane season is, or a 100-year flood. All of our experience is from a cooler climate that we don't have any more. Our future climate even more outside our range of experience.
-
16 hours ago, GaWx said:
Thank you, Charlie. What you say makes sense. I didn’t post this to take sides but rather am presenting this as something to elicit good discussion since this kind of thing (evaluating all hypotheses) is a vital part of the scientific method.
I need to add the following from Viterito that I had originally left off the original post to keep it from being too long:———————
Here is a comprehensive bibliography on the
impacts of geothermal flux on the thermohaline circulation:
Thompson L, Johnson GC (1996) Abyssal currents generated by diffusion and
geothermal heating over rises. Deep Sea Research Part I: Oceanographic Research
Papers 43(2): 193-211.
Downes SM, Hogg AM, Griffies SM, Samuels BL (2016) The transient response of
Southern Ocean circulation to geothermal heating in a global climate model. J Climate
29(16): 5689-5708.
Adcroft A, Scott J, Marotzke J (2001) Impact of geothermal heating on the global ocean
circulation. Geophys Res Lett 28(9): 1735-1738.
Hofmann M, Morales Maqueda MA (2009) Geothermal heat flux and its influence on the
oceanic abyssal circulation and radiocarbon distribution. Geophys Res Lett 36(3):
L03603.
Urakawa LS, Hasumi H (2009) A remote effect of geothermal heat on the global
thermohaline circulation. J Geophys Res Oceans 114: C07016.
Mullarney JC, Griffiths RW, Hughes GO (2006) The effects of geothermal heating on the
ocean overturning circulation. Geophys Res Lett 33: L02607.
Scott JR, Marotzke J, Adcroft A (2001) Geothermal heating and its influence on the
meridional overturning circulation. J Geophys Res 106(C12): 31141-31154.
Patara L, Böning CW (2014) Abyssal ocean warming around Antarctica strengthens the
Atlantic overturning circulation. Geophys Res Lett 41(11): 3972-3978
Emile-Geay, J. and Madec, G. (2009) Geothermal heating, diapycnal mixing and the
abyssal circulation, Ocean Sci., 5, 203–217, https://doi.org/10.5194/os-5-203-2009,
2009.Purkey, S. G., and G. C. Johnson, 2010: Warming of global abyssal and deep Southern
Ocean waters between the 1990s and 2000s: Contributions to global heat and sea level
rise budgets. J. Climate, 23, 6336–6351, doi:10.1175/2010JCLI3682.1.
Purkey, S. G., and G. C. Johnson, 2012: Global contraction of Antarctic Bottom Water
between the 1980s and 2000s. J. Climate, 25, 5830–5844, doi:10.1175/JCLI-D-11-
00612.1.
Mashayek, A., Ferrari, R., Vettoretti, G., & Peltier, W. R. (2013). The role of the
geothermal heat flux in driving the abyssal ocean circulation. Geophysical Research
Letters, 40(12), 3144-3149.
Park, Y.-G., J.-H. Park, H. J. Lee, H. S. Min, and S.-D. Kim (2013), The effects of
geothermal heating on the East/Japan Sea circulation, J. Geophys. Res. Oceans, 118,
1893–1905, doi:10.1002/jgrc.20161.
Downes, S. M., Sloyan, B. M., Rintoul, S. R., & Lupton, J. E. (2019). Hydrothermal heat
enhances abyssal mixing in the Antarctic Circumpolar Current. Geophysical Research
Letters, 46, 812–821. https://doi.org/10.1029/2018GL080410Ballarotta, M. et al., (2015), “Impact of the oceanic geothermal heat flux on a glacial
ocean state”, Climate of the Past Discussions, 11, 3597-3624.
Jowan M. Barnes, Miguel A. Morales Maqueda, Jeff A. Polton, Alex P. Megann,
Idealized modelling of ocean circulation driven by conductive and hydrothermal fluxes at
the seabed, Ocean Modelling, Volume 122,2018, Pages 26-35, ISSN 1463-5003,
https://doi.org/10.1016/j.ocemod.2017.12.005.
Forgot to mention that geothermal heat could be more important regionally. The biggest area of concern is Antarctica, where geothermal heat flow could make portions of the ice sheet more vulnerable to climate change. This is being studied, as described in review article linked below.
https://www.nature.com/articles/s43017-022-00348-y
-
1
-
-
3 hours ago, GaWx said:On this Thawing Sunday, a Reading from the Book of Arthur ( Viterito)
From Arthur Viterito:One of the criticisms of the argument that variable geothermal flux along mid-ocean ridges can
modulate global climate is as follows: There isn’t enough heat flow to impact the system. Critics
further argue that changes to the global temperature must be caused by either fluctuations in
the atmosphere’s CO2 load and/or changes in cosmic radiation and/or changes in global cloud
cover.
Defense of the geothermal hypothesis can be found in a substantial body of theoretical and
empirical work that is casually ignored by its detractors. Compelling evidence will be presented
to debunk these criticisms.
1) We know that the earth emits the vast majority of its geothermal energy along mid ocean
rises and ridges. We know that the flux can change over time and that change is reflected in the
number of seismic events recorded in these areas. Here is a map showing the geothermal flux
globally: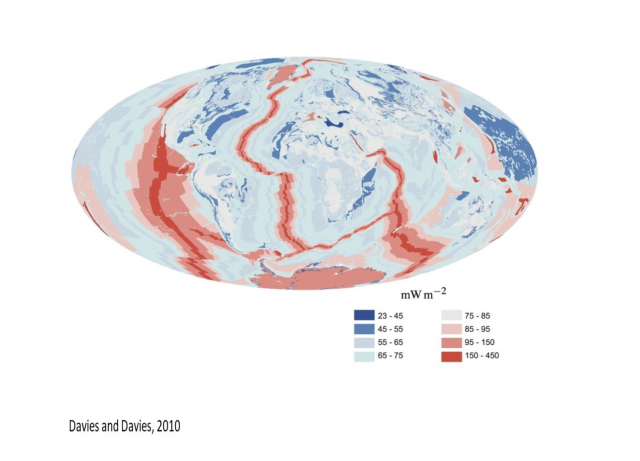
2) According to Davis et al (Davis E, Becker K, Dziak R, Cassidy J, Wang K, et al. (2004)
Hydrological response to a seafloor spreading episode on the Juan de Fuca Ridge. Nature
430(6997): 335-338. DOI: 10.1038/nature02755), increasing seismic activity in these abyssal
zones leads to an increase in water temperatures. To quote from their study:
“Seafloor hydrothermal systems are known to respond to seismic and magmatic activity
along mid-ocean ridges, often resulting in locally positive changes in hydrothermal
discharge rate, temperature, … and shifts in composition occurring at the time of
earthquake swarms and axial crustal dike injections. Corresponding regional effects
have also been observed.”3) In a number of studies, I have documented large changes in the number of medium and large
magnitude seismic events along these mid-ocean ridge systems. Here are links to two of these
studies:
The Correlation of Seismic Activity and Recent Global Warming | OMICS International
1995: An Important Inflection Point in Recent Geophysical History4) How, then, can changing geothermal flux affect global climate? If you query Google
(“geothermal global flux”), the Gemini AI system will respond with the following:
“Global geothermal flux is the amount of heat that moves from the Earth's interior to the
surface over time. It's a major factor in climate change and can impact ice sheets and
the ocean.
How does geothermal flux affect the Earth?
Ice sheets: Geothermal heat flux can melt ice sheets, which can increase the amount of
ice that flows into the ocean. This can contribute to sea level rise.
Oceanic circulation: Geothermal heat flux affects the circulation of water in the ocean.
Climate change: Geothermal heat flux contributes to climate change by adding heat to
the Earth's system.”5) With regards to melting ice sheets, James Kamis has commented on this extensively. Here is
a link to his work on the subject:
Plate climatology6) With regards to impacts on the oceanic circulation, the literature is quite clear: increasing
geothermal flux intensifies the thermohaline flow. This is critically important, as it will drive more
warm water into the Arctic, (i.e., Atlantification and the Arctic Amplification) and the central Pacific by strengthening the Kuroshio Current.7) Here we can see increased sea surface temperatures resulting from an intensified Kuroshio
Current during the most recent El Nino episode: ( note this was a reaction by the time it was taken, we were in a La Nada)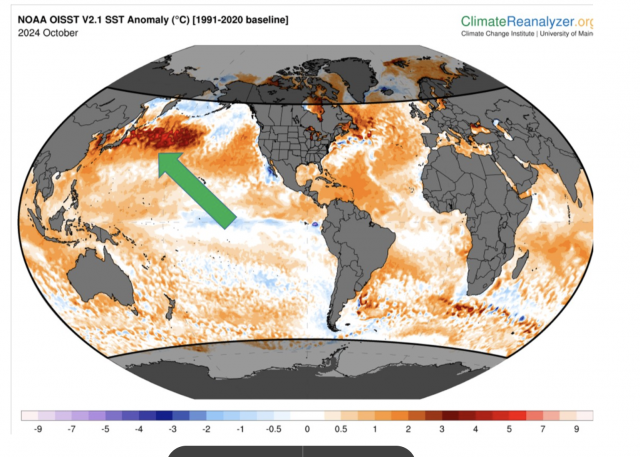
8) Here we can see the effect on the current sea ice extent in the Arctic. Notice the reduced ice
extent where the Northern Gulf Stream has been intensified from heightened mid ocean seismic
activity and geothermal flux: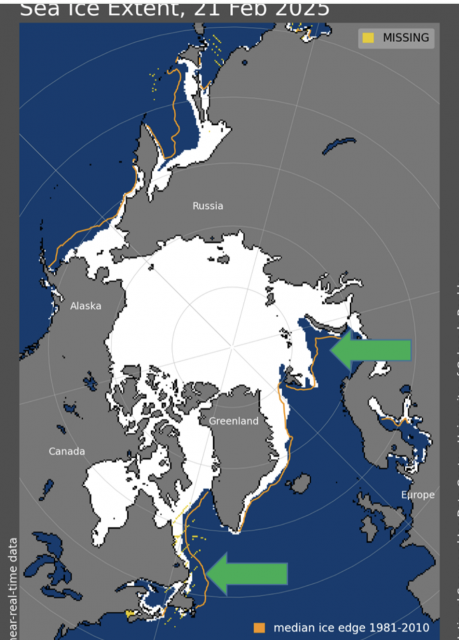
9) Professor Wyss Yim has documented the impacts of large underwater seismic events on
local and regional ocean temperatures. He refers to these ephemeral, yet significant areas of
higher ocean temperatures, as “oceanic blobs.” Here is a link to one of his presentations:
Volcanic Eruptions and Climate Variability - Professor Wyss Yim - YouTube10) If we tie all of this together, we arrive at a compelling statistical relationship between global
temperatures and mid-ocean seismic activity. Here is a graph depicting this relationship: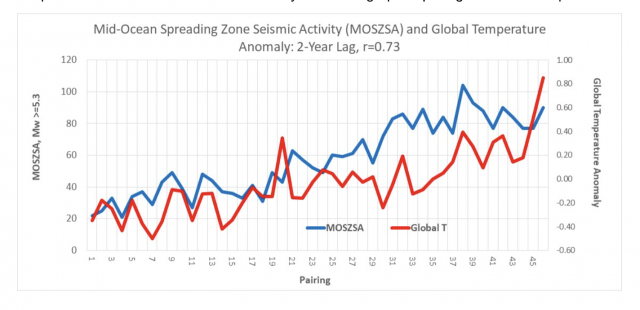
11) Ignoring this tight fit between global temperatures and mid-ocean geothermal flux is a
serious oversight by the climate community. Through continued research and improved
communication with climate scientists, it is hoped that this critical association will eventually find
its way into the mainstream thinking on recent climate change.Some quick thoughts. This write-up doesn't sound very scientific to me. With no assessment of the geothermal heat flow, there is no proof that geothermal energy had an impact on the points raised. Also geothermal hasn't been ignored. The role of geothermal in climate is an obvious scientific question that was answered a long time ago. I remember a geothermal being assessed as unimportant for climate when I was in school.
Below is the geothermal para from the Wikipedia article on the earth's energy balance. It's as I remembered, geothermal is insignificant as a heat source for the earth's surface compared to the sun.
Last year man-made forcing was estimated at roughly 3 W/m2 based on atmospheric concentrations of CO2, methane, other GHG, aerosols, etc. This is roughly 35 times all the energy from geothermal. Satellite measurements of the earth's net radiation i.e., what comes in from the sun vs what is radiated out in the infrared, matches the rate at which the oceans and the climate system are warming. So man-made GHG explains all of the warming that we are experiencing.
Finally if geothermal energy from mid-ocean was an important source of warming, then the ocean would be warming from the bottom-up; but, instead, the ocean is warming from the top down. The surface is warming the fastest, followed by the mixed layer 0-100m, followed by 100-700m, and so on.

-
2
-
-
16 hours ago, ChescoWx said:
Chester County PA Average Winter Temperatures by Decade 1900's thru 2010's
Our warmest winters occurred back in the decades of the 1930's and 1950's our coldest were in the 1960's and 1970's.
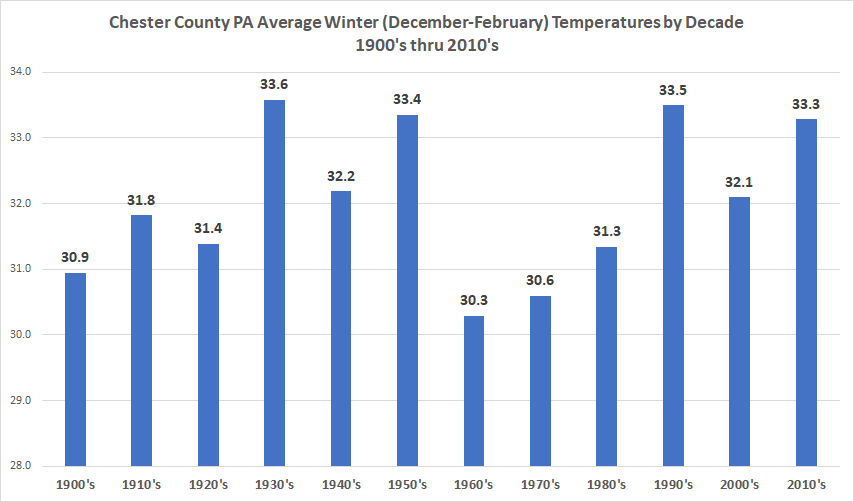
The data from Coatesville, near the center of the county, says you are presenting a misleading picture. This decade is the warmest in Coatesville, followed by the last decade. The adjusted values for Coatesville are a close match to the NOAA Chester County series. The adjusted data removes the bias introduced by station changes. By far the most impactful change is the post-WWII move out of the city of Coatesville to a cooler rural location.

-
3
-
-
Re the Mann vs Hanson discussion above, chart below (updated recently through 2024) shows how man-made forcing has increased in past decade or so leading to an increase in human induced warming. Link below has 2023 paper with details. Chart is for a 2024 update to the paper that is being prepared.
https://essd.copernicus.org/articles/15/2295/2023/

-
1
-
-
2 minutes ago, TheClimateChanger said:
Note that millions of acres of rangeland would burn each and every year. Late summer until the start of winter were clearly very hazy, smoky periods in the past. Even if this was mostly a seasonal phenomenon, it may be possible that aerosols emitted in this time frame have a greater climate impact than aerosols emitted at other times during the calendar year. Perhaps leading to autumn cooling and an earlier start to winter (more ice and snow). So our modeling simply looking at total emissions of aerosols might also be overlooking the fact that not all emissions are equal, and that emissions during the summer and fall are much more impactful on the global climate.
Scientists have been looking at preindustrial climate impacts for a while. Burning, land-use change, and agriculture released GHG and aerosols and changed albedo. Not sure what the latest science says, but post-industrial impacts are much larger. Below is a 2021 write-up I googled up.
-
37 minutes ago, Typhoon Tip said:
If Hansen is right that aerosols are a kind of 'silver bullet' physical cause for the surge in global heat performance in 2023 ( ...continuing 2024 etc..), that's a very bad look for the ambit of the field/science.
Why? because one knew that was coming. After all the science spanning the last three decades, from posit to super computing and back, no one or source that I can recall put out a prediction that said, "Warning: in February of 2023 a geological event of planetary scale will occur"
And it's that arithmetic that bothers me. That one factor, aerosols and consequence, was missed. So since the Industrial Revolution ( and at some discrete scale it likely could be scienced that man's control over fire is when it all really began ... ) yeah... we have an idea of chemistry changes in the atmosphere, more importantly, that which is contributed from Human activities ... but in so far as "HOW" exactly that will manifest consequences?
If we're missing one factor::big consequence scenarios, the likes of which can move the needle so fast at the scale of an entire planet, that doesn't sense like any predictions for the rest of this century and beyond are very credible, then. When we have to factor in a compendium of secondary ... tertiary feed-back harmonic consequences, it really sinks one's hopes.
It almost senses like we are witnessing a relativistic, slow moving climate explosion already. From a human's vantage and perception of events in time there's no p-wave or shock to signal the detonation has occurred. But, relative to geological scales it's moving along at "explosion" rates.
Yet again .. I come back to my core tenet in why the sense of urgency lags, it's that the factual nature of climate change's objectiveness is not appealing to the five sense of the individual, at any given moment. This is intuitively going to be a disadvantage when integrating that experience at the group scales. People respond to what is inimical via at least one of the corporeal senses, first. They don't motivate based upon mere advice - particularly when the scope of the advice is so vast. "If it's so big, why can't I see it?" There's also a ginormous intellectual capacity gap in humanity, one were the those privy to the perils of climate change, and a willingness - because of the imperative of it - to accept the objective reality, do not present the ballast of population. That's a scary proposition for a species boasting north of 8 billion farters.
For everyone else.. humanity stands on the railroad track of destiny, and the iron beneath their feet whirs with the vibration of what's to come, yet they are too busy arguing over the color shoes they are wearing while in the engagement to really even notice.
You make good points but I have a few bones to pick. I don't think silver bullet is the right word. Its never just one thing in weather/climate. Aerosols help explain the acceleration in temperatures in the past 15 years, but other factors had to align to produce a spike in 2023. I would not put much of the blame on science either. They have been ringing the climate alarm bell for a while and have long recognized aerosols as a key uncertainty. The lack of concern/urgency has caused aerosol science to be underfunded. Agree that climate's complexity make it difficult to deal with; but, also think our own human nature is important. We have certain attributes that get in the way of facing climate and certain other problems: short-term focus, self interest, greed, resistance to change, confirmation bias, denial, etc.
-
12 hours ago, bdgwx said:
[Hansen et al. 2025] - Global Warming Has Accelerated
2024 comes to end with Hansen (and cohorts) calling it. Global warming has accelerated.
Those who track my posts know that I'm more pragmatic and conservative in general in regard to global warming perhaps even to the point that some might call me a skeptic though that would obviously mischaracterize my position. I just simply take a more middle-of-the-road IPCC style position. And I've said before that I'm currently Team Mann on this particular topic. However, I've also said that my conservative position is becoming more untenable by the year. I'm still not quite ready to switch over to Team Hansen, but I have to admit he has taken the lead in the debate...at least for now.
Are you Team Mann or Team Hansen?
An interesting question. Stepping back don't think that Team Mann or Hanson are that far apart. They are still on Team Climate Science. Saw a chart recently, but can't recall where, so can't post, that showed that Hanson's yellow cone overlay the CMIP6 projections, i.e., acceleration is expected due to an increase in forcing. However, think that the Mann/IPCC team is losing unfortunately. As I will explain below.
Hanson is right that aerosols are key for untangling our recent climate history. The chart below taken from a recent Climate Brink blog (link below) illustrates this. Aerosols have been masking the effects of CO2 and other GHG. There have been 3 broad GHG and aerosol forcing regimes (dates rough): 1) Pre-1970 where aerosols increased at roughly the same pace as GHG and masked almost all GHG warming, 2) 1970-2014 where aerosol emissions stabilized due to increasing clean air regulation allowing a steady rise in net man-made forcing (GHG+aerosols) as GHG continued to increase and 3) The last decade or so with decreasing aerosols which unmasked GHG in the atmosphere causing the rate of forcing to increase. We are now getting the effect of new GHG as they are emitted, plus the old GHG that had been masked. Temperatures have tracked forcing (warming rates and dates rough): 1) Before 1970 - stable, 2) 1970-2014: steady 0.18 increase, 3) Post 2014: 0.25+ per decade.
Of course the regimes didn't change as suddenly and other factors have played a role as described in the Hanson paper: sun, volcanoes, shipping rules, etc. Hanson is also right that an increasing aerosol effect implies higher climate sensitivity when using recently observed temperatures to estimate climate sensitivity. However, there are other ways of estimating climate sensitivity, i.e, Hanson is underestimating the uncertainty in ECS. I don't see enough evidence that climate sensitivity is at the high end. What has happened though is the low end has been lost, ECS is not under 3, recent science and the acceleration in temperatures make that clear. My personal range is 3-4C per CO2 doubling.
More important than climate sensitivity, it is clear that policy and emissions aren't following any IPCC scenario; and, with the election of Trump aren't likely to in the near future. We've made some progress on CO2 as the economic position of coal and renewables has changed, taking CO2 off the worst case path. However non-CO2 pollutants, aerosols (decreasing too fast), methane and N2O, are all on worst case paths and total net forcing is increasing at about the same rate as RCP85. The only good news is that the rapid increase in forcing is temporary, there are only so many aerosols to be eliminated.
So where does that leave us? In a rapidly changing climate unfortunately. The masking effect of aerosols has fooled us and helped put us on a path that maximizes climate shock. We masked GHG warming for a long time while we slowly added GHG to the atmosphere. Now we are unmasking at a relatively rapid rate, without serious emission control. A dangerous policy combination. We are headed toward our climate future at an accelerating rate, while at the same time not preparing for the consequences. Buckle up.
https://www.theclimatebrink.com/p/exploring-the-drivers-of-modern-global

-
1
-
-
Ceres net radiation updated through last November. Net radiation continues to bottom out, consistent with transition to la nina, as nino warmth is radiated to space. Have to go back to 2009/10 for nino-related dip as large as current. However, this cycle is bottoming out at elevated level similar to recent dips, so would expect rapid warming to continue.

-
1
-
-
15 hours ago, bluewave said:
Every weather event that occurs is in some way influenced by the average global temperatures around the time of the event. You wouldn’t expect the real world weather events to be the same during an ice age as they were during the PETM. So the background climate temperatures during each era sets the parameters or range of possibilities for the individual weather events.
Our local Chester County weather is changing exactly as expected with GHG warming, just like the rest of the region. Chester County has warmed 3-4F since Coop data collection started in the 1890s. Nights and winters are warming the fastest. Rainfall is increasing, particularly heavy rains. Our snowfall is increasingly concentrated in a few heavy storms/winters. Clear as day if you analyze the data properly. We beat the Chesco temperature data to death recently. Despite all the complaints about alarmism, NOAA was spot on.
-
3
-
-
The adverse pattern started to impact sea ice volume near the end of January (updated monthly). With the adverse weather, expect continuing negative volume impact in the first half of February. Keeping this year #2 behind 2017, another post strong nino year.

-
10 hours ago, Typhoon Tip said:
The annular mode has plummeted deeply negative …
.. that may also have something to do with it
Yes, up to +20C surface anomalies today, but forecast to start dropping over next couple of days.

-
9 minutes ago, bluewave said:
New lowest extent record for 2-5 by 500k.
Didn't get any better on 2-6.

-
5 hours ago, Typhoon Tip said:
Is that real tho ?
I mean I don't doubt that it is but I just went over to NASA's interactive page that runs the map request for GHCNv4 Tv5 and it says it's not available for Jan 2025
Do you have another link ?
Here's a link. If you dig on website you can find all the details. This is usually the first estimate using GHCN to come out each month.
-
1
-
-
1 hour ago, nflwxman said:
Been several years since I've posted here, but between the recent trends in global temperature, and increased rate of growth in levels of CO2 measured, it's clear we are not in for a good 2030 - 2045 as a species.
Mass migration that climate scientists predicted is already happening and clearly causing the geopolitical stresses. Amazing that the media has not acknowledged the truth of that prediction from nearly 20 years ago.
Good to see you post again. Congrats on the call you made during the hiatus for 0.2C/decade warming. May end up low, but at least you were in the right neighborhood, unlike the rest of us.
-
1
-
-
January observed temperature anomalies relative to a 1950-80 base. No temperature bias adjustment because the global average isn't impacted significantly. A record in this series by 0.04C.

-
1
-
 1
1
-
-
3 hours ago, TheClimateChanger said:
What I think is going on, and I don't say this lightly, is the climate has warmed so much already that typical weather events now seem unusual. Possibly even among people who accept the reality of global warming. I frequently see people claiming - without evidence, I might add - that global warming is actually leading to colder winter extremes, and wavier jet streams, and other similar nonsense. It's like these people have never looked at any historical weather records in their life. This is natural variability leading to regional cooling amidst a much, much warmer global climate. In colder past climates, there has been far colder weather. And snow was much more frequent along the Gulf of America (formerly known as the Gulf of Mexico) coast in the past than it is today.
For the winter-to-date (12/1 to 2/3) the lower 48 is close to normal.

-
Big storm/warm air surge on the Atlantic side this week have sent arctic sea ice into record territory.

-
2
-
-
5 hours ago, LibertyBell said:
How is it so warm when its been so cold and historically snowy in the Deep South?
Do we have a population weighed temperature statistic for how the temperatures performed where people actually live (versus, let's say Siberia or Antarctica where virtually no one lives?)
Here's a map of Jan temperature anomalies through Jan 25 (JRA reanalysis). Very cold in SE quadrant of US, but there are several very warm areas scattered around the planet to balance. For northern hemisphere land, Eurasia and Canada more than offset a cold US.
The JRA record for Jan is 0.64 set last year, currently 0.71 and likely to be broken this year. Very unusual to break a winter monthly average temperature record in a La Nina, not sure it has ever happened before.

-
3
-
1
-
-
3 minutes ago, LibertyBell said:
also, we must realize that for 85% of earth's history there was no ice at either pole.
Perhaps we will see an explosion of new life. We might return to what it was like during the Mesozoic.
Yes, there has been an explosion of life after every mass extinction. It won't happen though until climate conditions stabilize, 10,000 to 100,000 years in the future perhaps; and, will depend on how humans shape the planet.
-
1
-
1
-
-
14 hours ago, TheClimateChanger said:
Can anyone explain this?
I don't dispute the finding... that is, that climate-driven warming threatens agricultural productivity in Central Europe. My question is with these depictions of historical agroclimatic zones. If you just looked at this reconstruction, you would think the period 1501-1525 had similar regional temperatures to 2001-2018, and 1926-1950 was similar to 1601-1625, one of the coldest times of the Little Ice Age, and, bizarrely, even colder in the western parts of the region of interest. My problem is this... these reconstructions make zero sense based on hundreds of years of climatology. I realize there are regional variations, but I think it's implausible that this part of the world would have experienced similar agroclimatic zones to the recent past during a time when global temperatures were more than 1C cooler than the present. If we look at recent years, which have been as much as 1.5C of warming from the late 19th century, these periods were probably 2C or more cooler based on most reliable reconstructions. 1926-1950 was also a period of relative warmth globally on a millennial or multi-millennial timeframe, with some stability or even modest cooling in the ensuing decades, only for another large step-up in temperature to occur in the latter parts of the 20th century.
More caution should be had when combining proxy data and instrumental records. I feel like if 1926-1950 and 2001-2018 were calculated in the same manner as the earlier periods, there should be a lot more oranges and reds in the earlier period, and the most recent should be blood red. Something is off here. Like I said, I don't dispute the finding AT ALL. However, to me, the graphic is casting a misleading view and literally flies in the face of hundreds of years of scientific understanding of the earth's climates - an understanding and knowledge that even predates the discovery of the greenhouse effect.

The current "scientific understanding" includes all the previous work plus new information. That's how science works. The biggest recent advances are ice sheet, ocean, and lake sediment cores and water isotope ratios which provide temperature in the core samples. All of these are accurate, can be dated, and paint a consistent picture. We are warmer now than anytime in the past 120,000 years. Note that the chart doesn't include the recent spike to 1.5+C higher than pre-industrial on a global basis, or roughly 2C warmer in the northern Hemisphere, off the chart warmth.
We have already left the holocene (last 10k), now in the eemian (120-130k ago), and in a couple of decades will reach the Pliocene.(1.8-5 million years ago). A different climate than the one we were born in.
-
This is a good video with info on LA's unique fire ecology, fire fighting infrastructure and historical housing development. There is plenty of blame to go around on both sides of the political spectrum. Unfortunately, until we can focus on the true root causes we probably will end up repeating the same mistakes. Even as climate change ratchets up the risk for bad public policy.


Occasional Thoughts on Climate Change
in Climate Change
Posted
Of course science isn't settled, but when it comes to climate change most of the new scientific findings aren't positive. Here's a new finding from Greenland. The bottom of the ice sheet isn't frozen in place. Which means there is less resistance to movement, not good news in a warming world.
https://www.science.org/content/article/hole-drilled-greenland-s-heart-reveals-ice-ready-slide-sea