

chubbs
-
Posts
3,894 -
Joined
-
Last visited
Content Type
Profiles
Blogs
Forums
American Weather
Media Demo
Store
Gallery
Posts posted by chubbs
-
-
7 hours ago, 40/70 Benchmark said:
Now examine snowfall since 1970....the lagest surplus is in the NE coast, thus some of this is due to natural variability and regression. Not all of it.
Yes the NE coast and parts of the upper midwest have had increased snow since 1970. That's consistent with the paper I posted upthread (relinked below and added a second). As expected the snowfall signal is emerging much slower than the temperature signal due to offsetting precipitation and temperature effects and natural variability.
https://journals.ametsoc.org/view/journals/clim/26/20/jcli-d-12-00832.1.xml
https://agupubs.onlinelibrary.wiley.com/doi/pdfdirect/10.1029/2018GL079820
-
 2
2
-
-
11 hours ago, michsnowfreak said:
I'm definitely not an expert in your climate. It's actually confusing to me. It's simultaneously too snowy and not snowy enough for an outsider to understand, if that makes sense. I don't see nyc as having a true wintry climate, but I also don't see them as being a 1-snow-a-year climate like the south.
It's interesting to note that if you compare the 1875-1900 period to the 2000-2025 period, east coast cities are generally 3.5-5° warmer in 2000-25 than 1875-1900, while lower Great Lakes cities are generally 0.5-2° warmer. Clearly winter has warmed more on the east coast. That's likely a contributing factor to the feast/famine snowfall and why many of your largest snowstorms have occurred this century.
While I'm no fan of warmer winters, I've noticed a trend locally that's encouraging- more dynamic snowstorms during warmer winters than there used to be. Always prefer colder winters, but it would be nice to have that in the back pocket. But I REALLY hesitate to place any bets on future decades, and that's what my main disagreement with you is. You may be wrong you may be right....but we won't know for a long while.
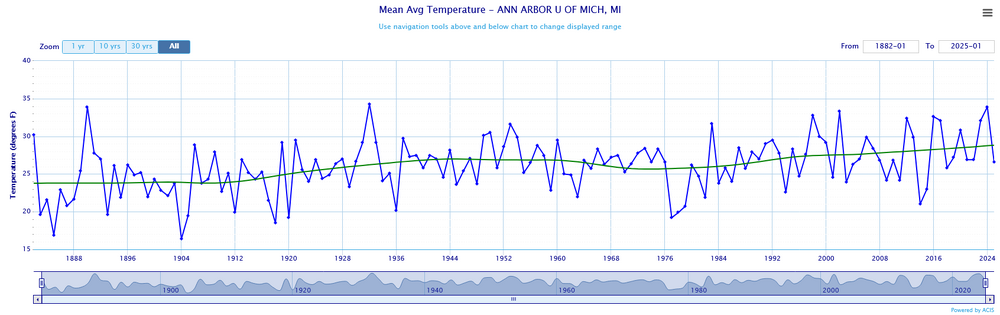
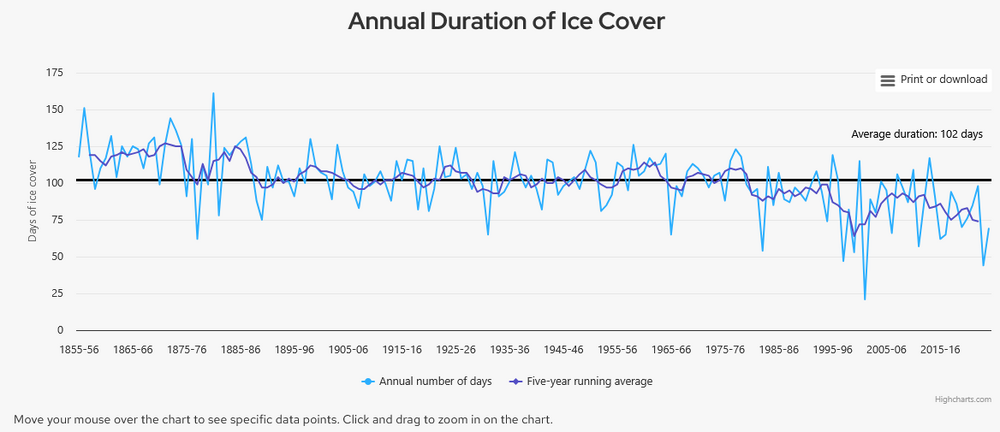
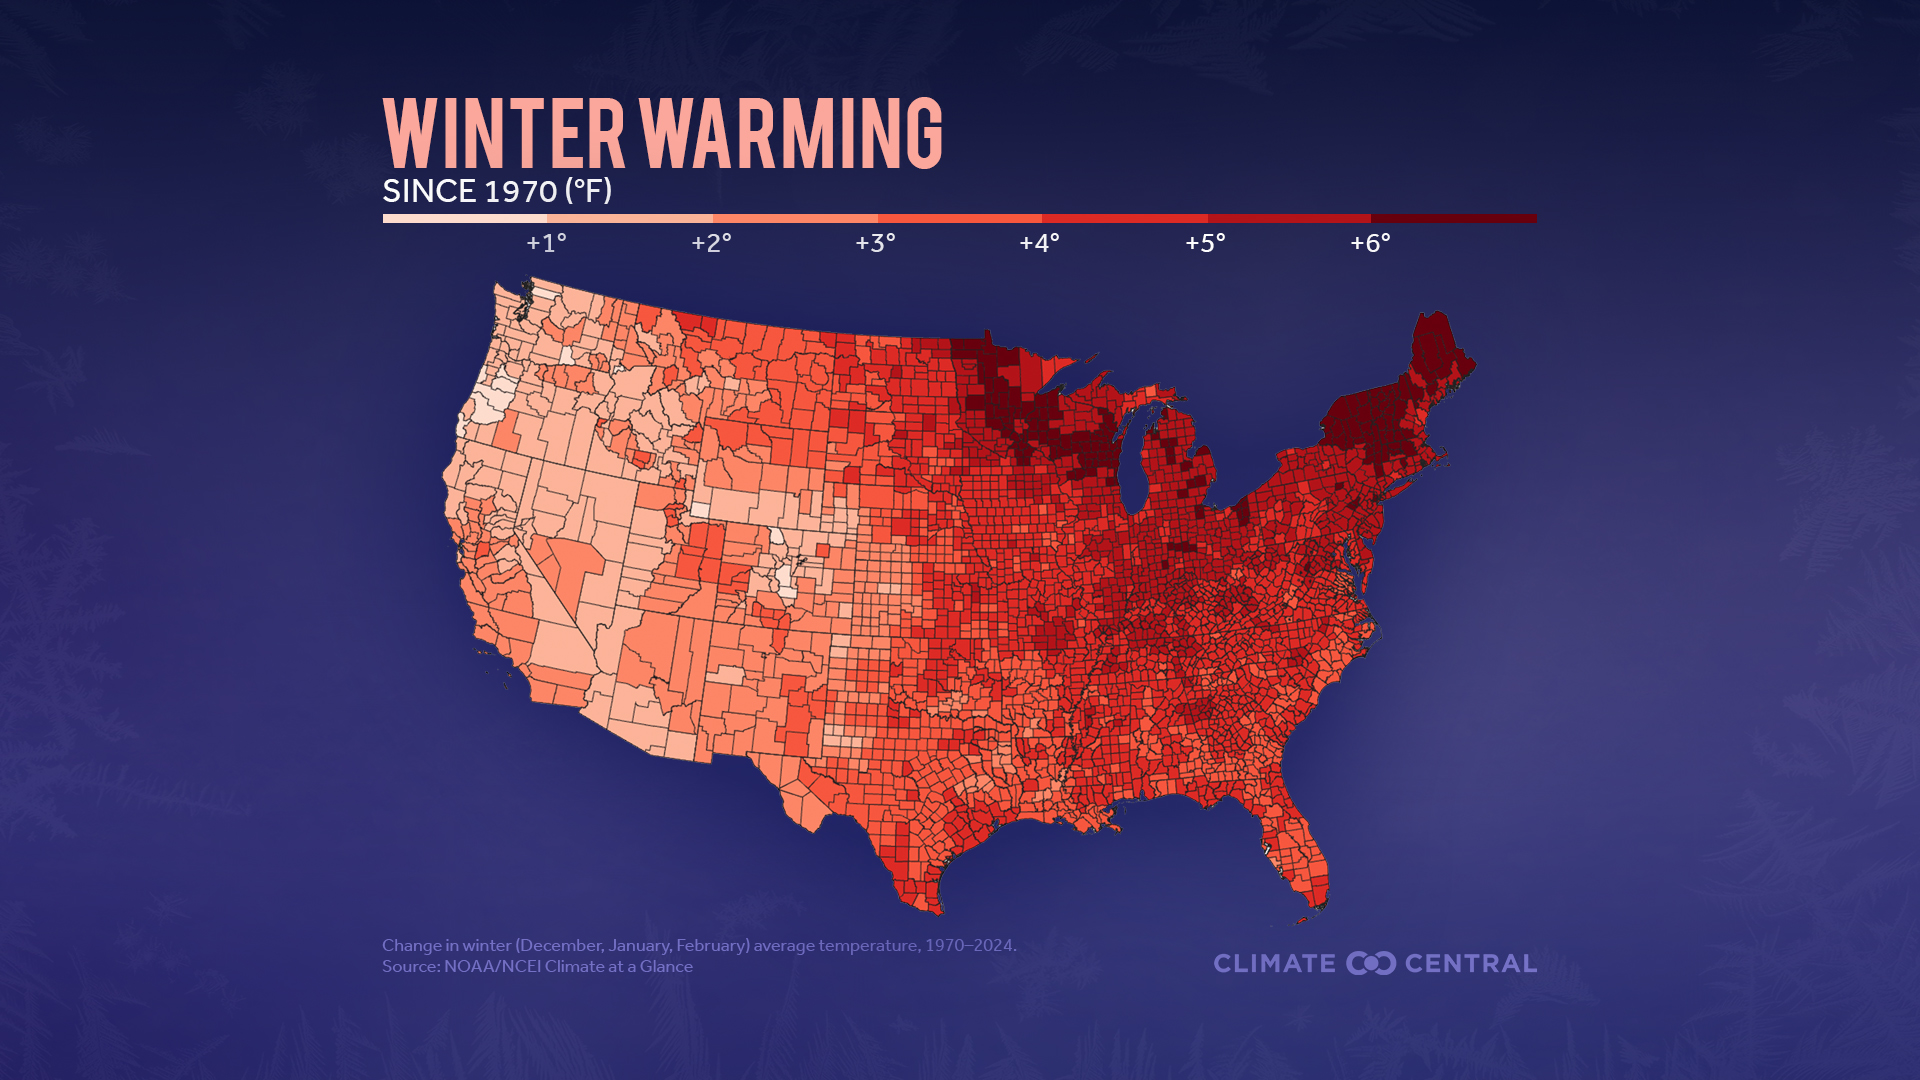
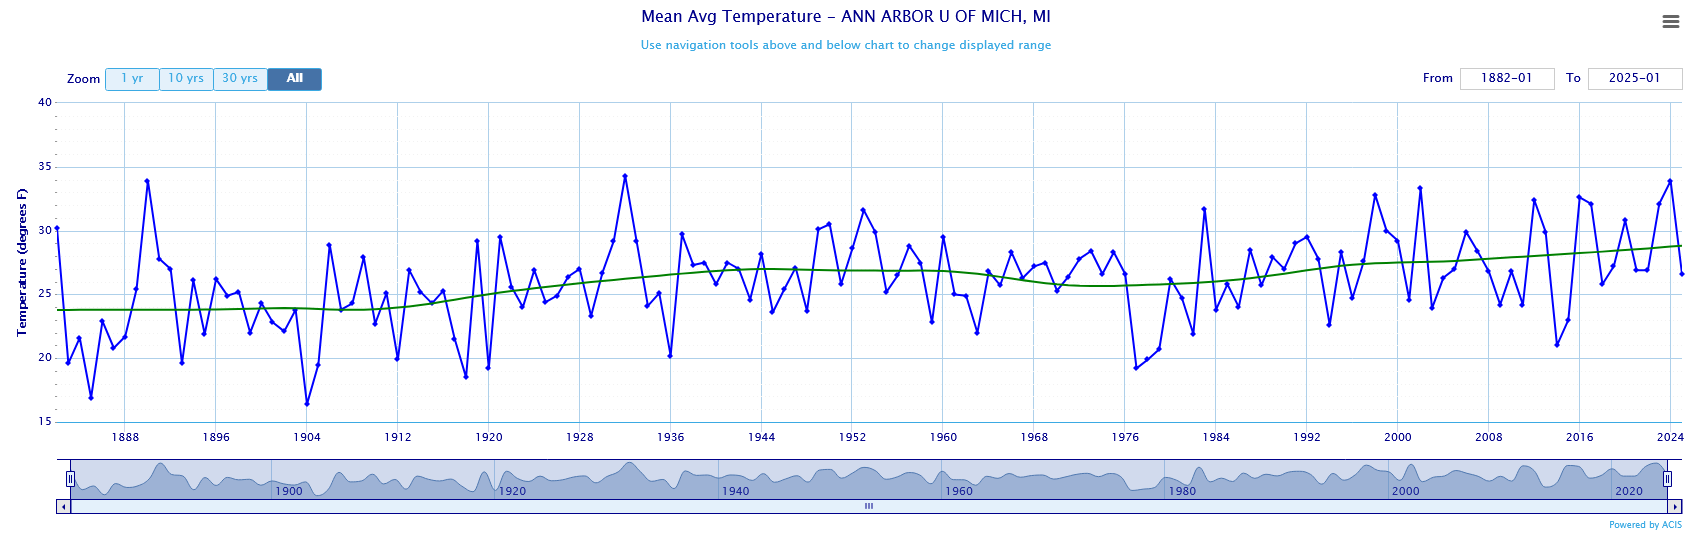
We've discussed the problem with comparing city and airport obs in Detroit and Chicago before. Need to maintain consistency or remove station changes to isolate the long-term climate trend. Winter warming has been uniform across the eastern US. If anything warming increases slightly from south to north. The fastest warming is in the upper midwest and northern New England. The warming map is confirmed by long-term data from Ann Arbor and lake freeze data from Mendota Lake in Madison Wisconsin.

-
1
-
-
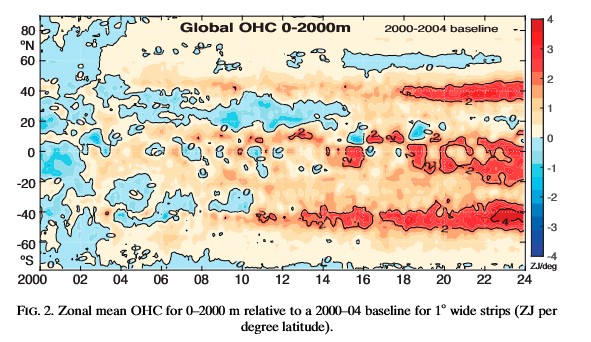
An interesting paper on the distribution of ocean warming. Particularly relevant to those living near 40N
")
The world's oceans are heating faster in two bands stretching around the globe, one in the southern hemisphere and one in the north, according to new research led by climate scientist Dr Kevin Trenberth. In both hemispheres, the areas are near 40 degrees latitude. The first band at 40 to 45 degrees south is heating at the world's fastest pace, with the effect especially pronounced around New Zealand, Tasmania, and Atlantic waters east of Argentina.The second band is around 40 degrees north, with the biggest effects in waters east of the United States in the North Atlantic and east of Japan in the North Pacific.
"This is very striking," says Trenberth,of the University of Auckland and the National Center of Atmospheric Research in Boulder, Colorado. "It's unusual to discover such a distinctive pattern jumping out from climate data," he says.
The heat bands have developed since 2005 in tandem with poleward shifts in the jet stream, the powerful winds above the Earth's surface that blow from west to east, and corresponding shifts in ocean currents, according to Trenberth and his co-authors in the Journal of Climate.
https://www.sciencedaily.com/releases/2025/05/250501122720.htm
https://journals.ametsoc.org/view/journals/clim/38/9/JCLI-D-24-0609.1.xml
-
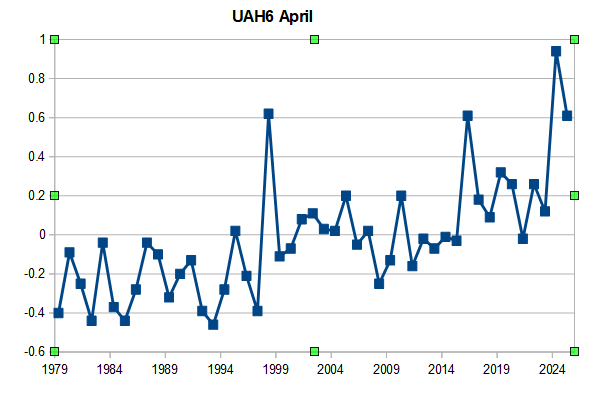
UAH6 tied for 3rd high this April, matching the 1998 and 2016 super ninos. Unusually warm for cool neutral enso.
-
2
-
-
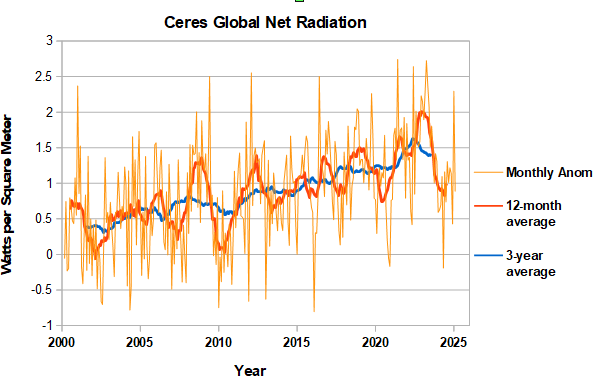
CERES data updated through February. Noisy from month to month. Last month's anomaly came in lower after an upward spike in January. The 12-month average is starting to turn up so the net radiation bottom for this enso cycle has probably been passed. If so net radiation fell to a similar level following the 2015/16 and 2023/24 ninos. The 3-year average remains stubbornly high, indicating that the next big step won't be cooler.
-
1
-
-
7 hours ago, GaWx said:
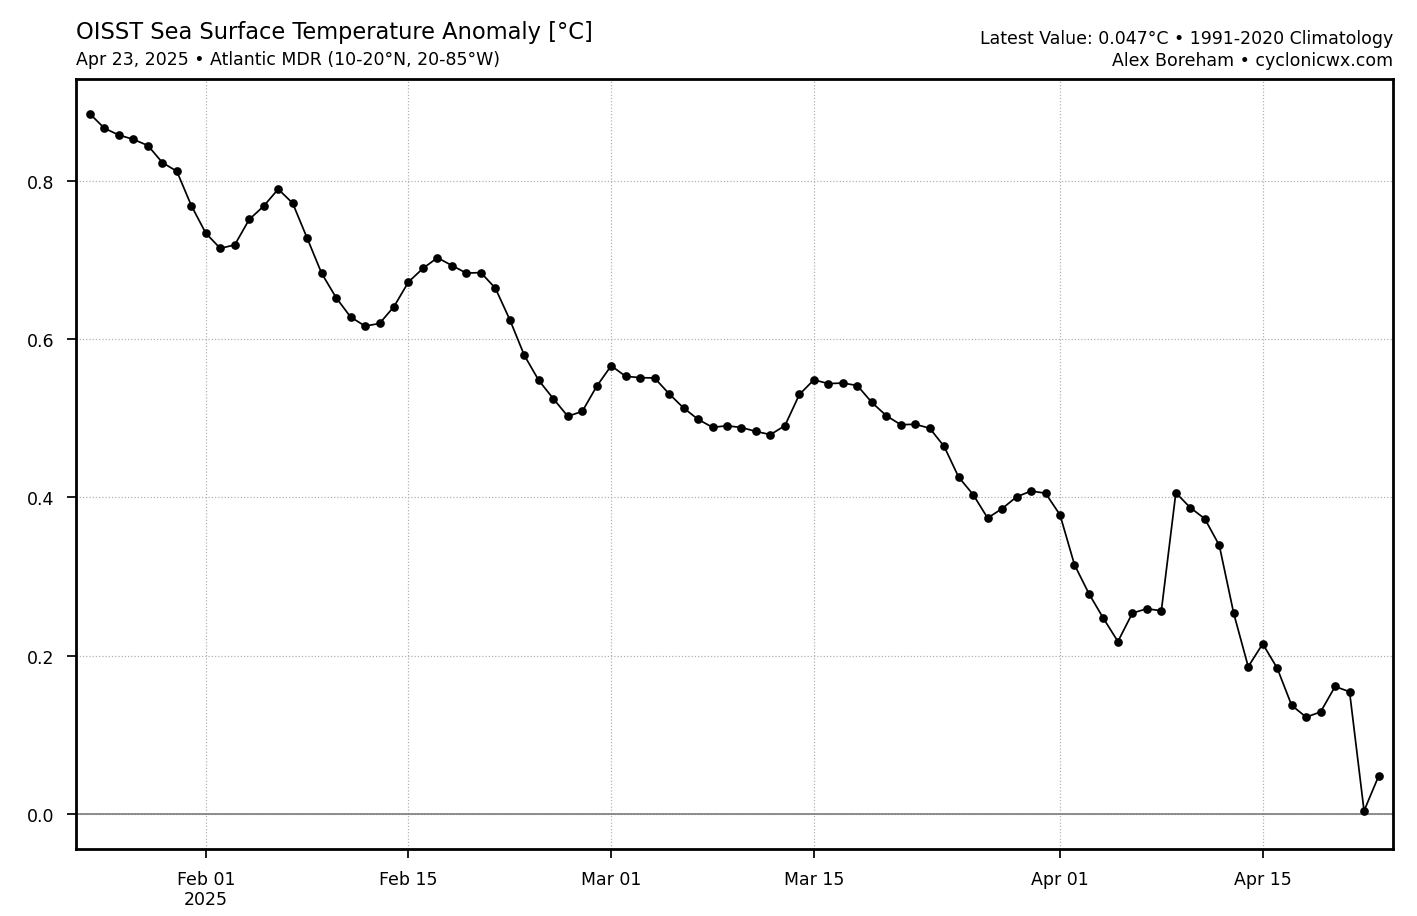
Why do y’all think the OISST anomaly for the Atlantic MDR (10-20N, 20-85W), which covers 3 million sq miles, has cooled 1.5C/2.7F during the last year? Why has it cooled 0.85C/1.5F during just the last 3 months?
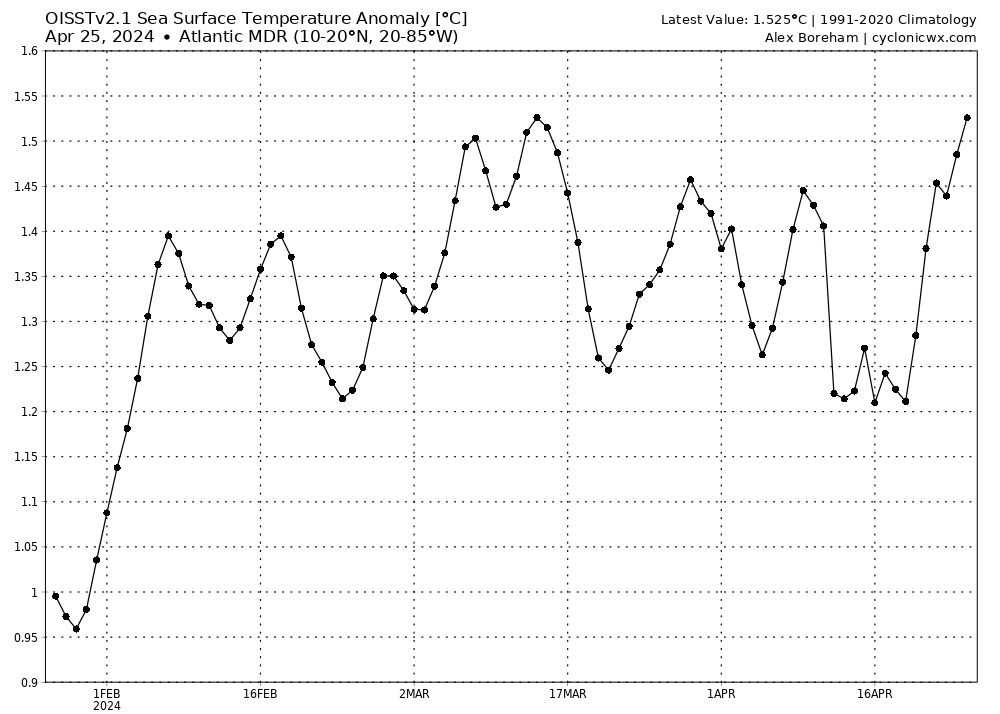
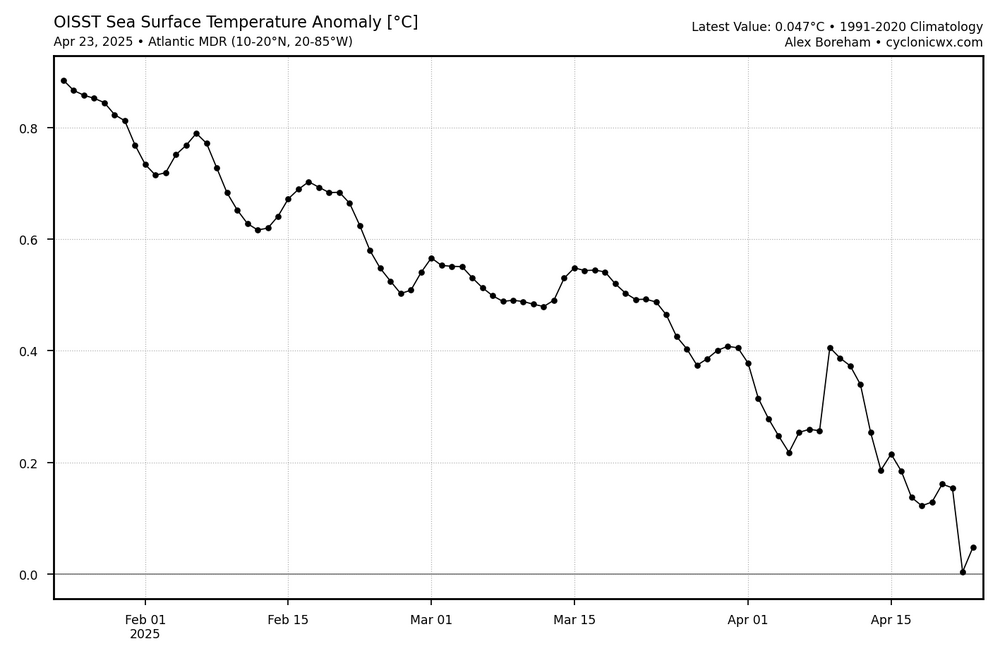
I haven't been following, but there have been unusually strong NE trades in the Atlantic MDR for the past 3 months which would cause upwelling. The mid-Atlantic subtropical ridge looks stronger than normal.
-
1
-
 1
1
-
-
This 2013 paper on snowfall in the Northern Hemisphere is on track so far. Snow is expected to be a lagging indicator of climate change due to offsetting effects of precipitation and temperature and natural variability. Have to be well up in Canada, with average winter temps of -10C, to see a net snowfall benefit from warming. Further south, downward snowfall trends will emerge slowly as the Century progresses. Two steps down and one up kind of thing.
https://journals.ametsoc.org/view/journals/clim/26/20/jcli-d-12-00832.1.xml
-
1
-
-
14 hours ago, GaWx said:
@donsutherland1and others,This is from Joe Bastardi today. He’s totally convinced that that large amount of cooling in the Atlantic (20N to 20S) over the last year is due to a >50% drop of seismic activity in the “mid-ocean spreading zone” because the area of cooling surrounds a portion of the Atlantic part of that zone.
Any comments?
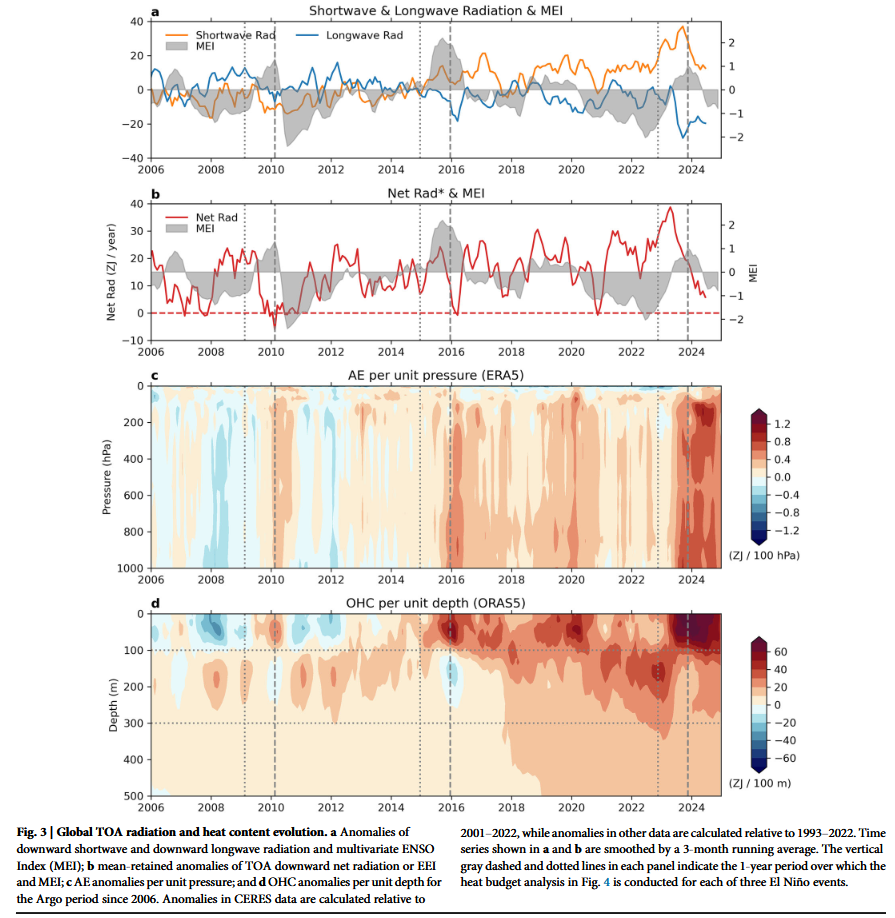
His comments are dumb. Shows he doesn't understand the climate system. Apologize for the complicated chart, which is from a recent paper on the causes of warming in the 23-24 nino. The ocean is being warmed from the surface down (bottom chart). The timing of surface ocean and atmosphere warming (AE is atmospheric energy in second chart from bottom) is modulated by enso. The warming of the ocean is due a global net radiation imbalance (second chart from top), which is also modulated by enso.
Overall there's a balance between the net energy coming in at the top of the atmosphere and the amount of heat in ocean (see paper). No room for seismic energy to play a role as energy from the sun can explain all the ocean warming. Energy accumulates gradually in the ocean during La Nina and is partially released during el nino to upper ocean, atmosphere and space (outgoing radiation). During El nino net radiation falls (second chart from top) but only to the net balance line, i.e., the atmosphere can hold the added el nino heat it is receiving from the ocean. If the warming was due to seismic the added seismic energy would lead to a negative radiation imbalance as the added seismic heat would increase outgoing radiation.
Note that the paper concludes that the increasing net radiation imbalance means we should expect a doubling of the rate of SST rise over the next 20 years.
https://iopscience.iop.org/article/10.1088/1748-9326/adaa8a

-
1
-
-
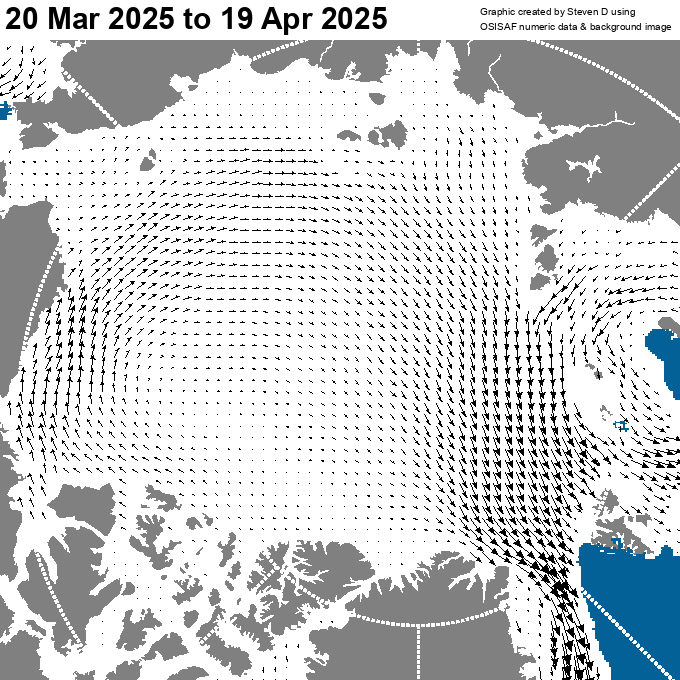
16 hours ago, lookingnorth said:
It looks like the Arctic sea ice extent has flatlined for the past three weeks or so. Does anyone have any idea why?
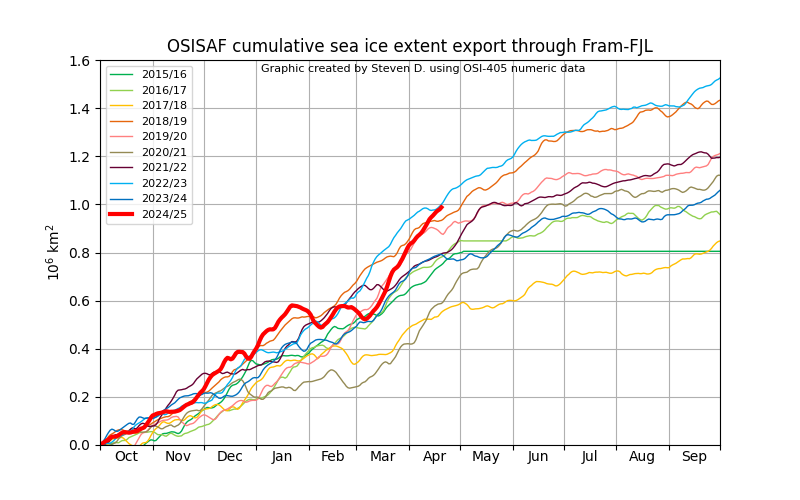
One factor is the pattern reversal along the Atlantic front in March. From warm compacting to cool exporting winds. While extent has expanded there is also high ice export through Fram and Franz Joseph straits. Pattern looks to continue for the next week. Note that this would be an unfavorable pattern in summer. With sunny conditions under Arctic high.
-
3
-
-
18 hours ago, ChescoWx said:
But of course Charlie they do!! See below both Coatesville and West Chester show clear cooling while Phoenixville shows only very slight warming....actual facts vs. altered alternative facts!!!! The majority of stations with long term data are indeed cooling during May in Chester County PA!!

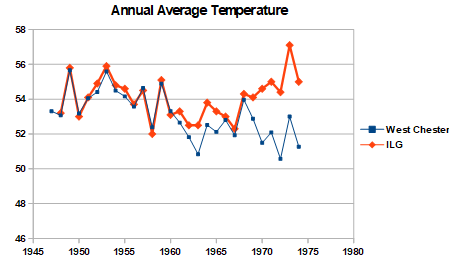
Your being confused by station moves. We've been over the importance of West Chester and Coatesville station moves a zillion times. The moves were large enough to obscure the real climate trend. As shown upthread, without the station moves there is no cooling at West Chester or Coatesville.
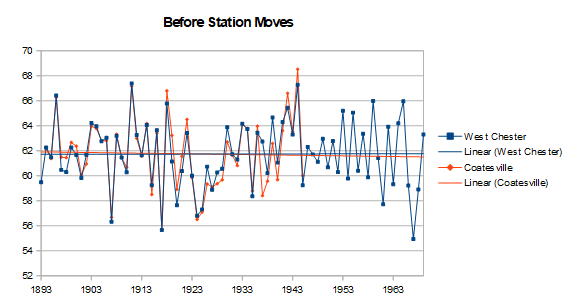
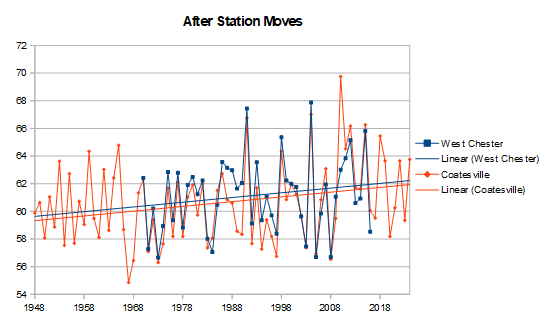
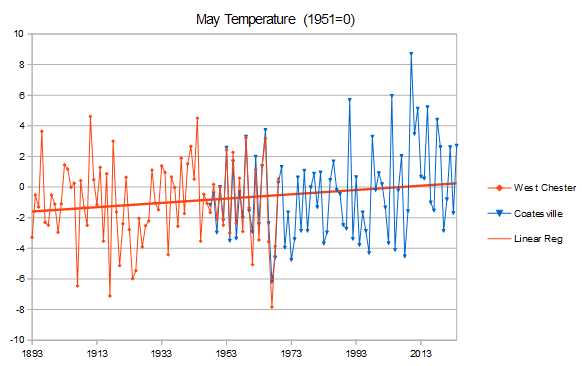
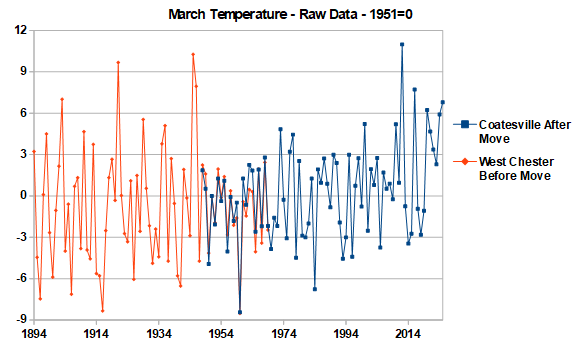
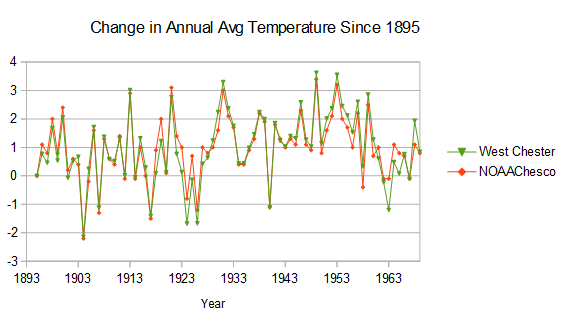
Here's another way to remove the station moves: plot the before and after move data separately. Without the confusion of the station moves, West Chester and Coatesville are in good agreement on our local weather. Before the station moves, May temperatures were close to 62F at the two stations. After the moves they had cooled to 60F. The trend lines for West Chester and Coatesville both before and after the station moves are almost the same. There is no change in temperature before the station moves; and, warming after the station moves. Further confirmation that West Chester and Coatesville have warmed in May.
The effect of the station moves is easily seen by comparing the regression lines around the time of the moves. Immediately before the station moves, May temperatures were close to 62F at the two stations. After the moves they had cooled to 60F.
This example shows the value of bias-adjustment. As Coatesville and West Chester demonstrate, the raw data from a single station can be misleading when there are major station changes. This isn't rocket science. Knowing the station histories, it is easy for me to remove the station moves and get a more accurate climate trend that is close to NOAA. You could do the same.
-
20 hours ago, FPizz said:
One degree is the end of the world to many on this site. He still complains it's still too warm BTW. 1 degree too cold and you would flip out.
Nope, one station too warm or too cold doesn't bother me at all. We have thousands of temperature stations in the US and weather data is correlated for hundreds of miles. Easy to spot and correct stations with problems whether its sensors, station location, or change in local land-use (heat islands). The only thing that bothers me is claims that there is something wrong with our knowledge about recent temperature trends.
-
1
-
-
20 hours ago, ChescoWx said:
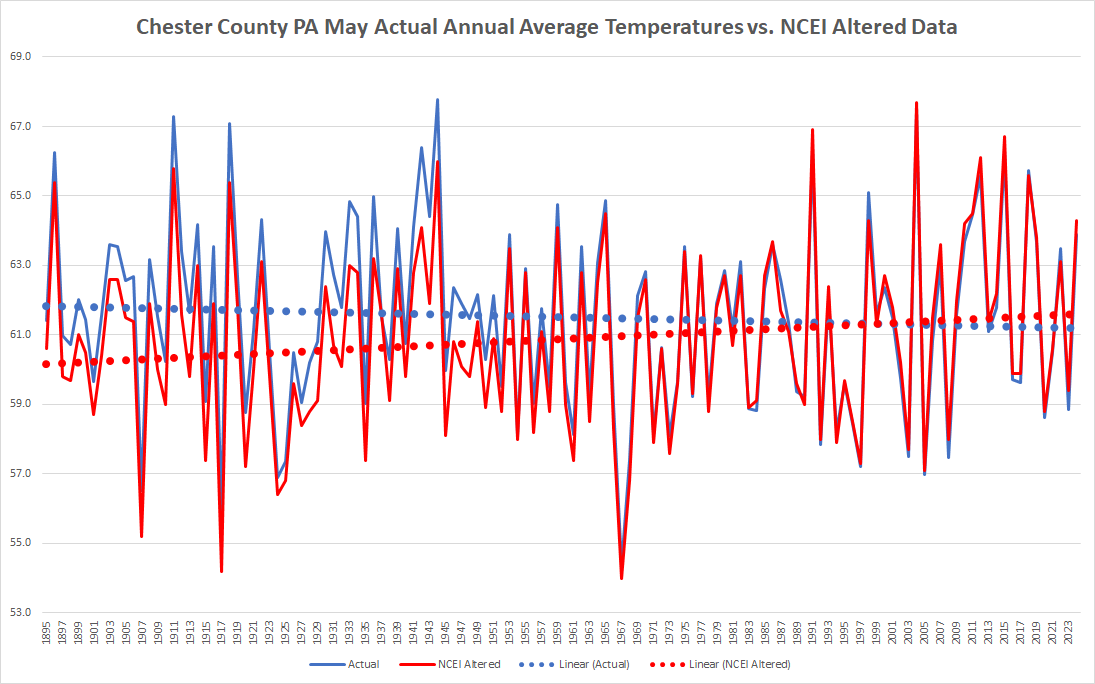
Charlie fortunately we have the actual data for ALL of the stations not just West Chester and Coatesville. As we can all see clearly below without the post hoc adjustments to chill the past and warm the present (see how the lines cross in the early 90's) we clearly see the actual raw data for May (blue) is cooling while only the altered (blue) artificial data indicates warming.

You aren't showing any station data though. Zero. Just your network averages that are contaminated with station moves and network changes. If you want to argue that the other stations refute West Chester and Coatesville, show the actual raw station data. Good luck, because the other long-term station, Phoenixville, also shows slight warming.
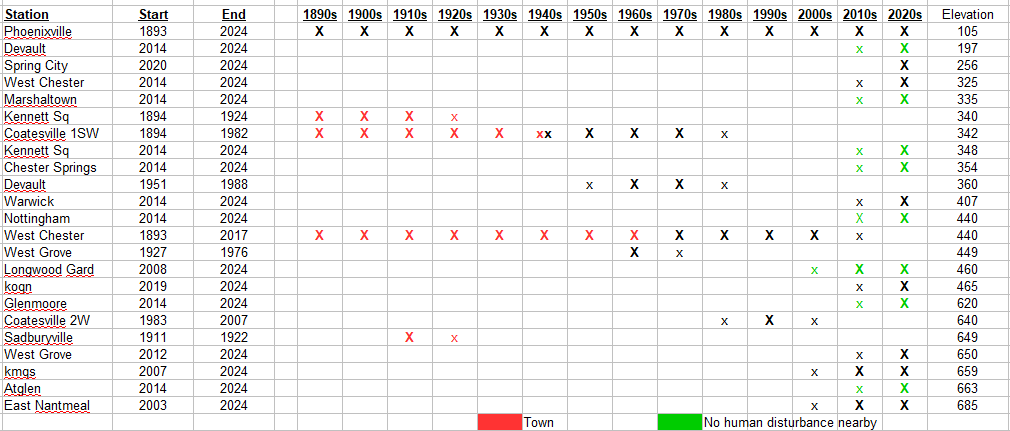
West Chester and Coatesville are the only Chesco stations with multi-decade periods with no significant station changes, during those periods the raw data is only responding to weather. We have had one set of weather in Chester County, that is well depicted by West Chester and Coatesville raw data and NOAA. The other stations don't show anything different.
-
1
-
-
16 hours ago, FPizz said:
Yes they were high. Rainshadow (Tony gigi) who posted here years ago, is the main one acknowledging the incorrect temps. I'm not sure why there is so much red tape when they know things are off.
You are making a mountain out of a molehill. The Philly airport ran roughly a degree warm in 2022. The sensor was replaced and 2023 and 2024 are back to normal. Easy to track by comparing to nearby sites. NOAA and other experts won't be fooled.
-
22 hours ago, ChescoWx said:
The Actual Data taken within the County before alteration and adjustments says we have far from warmed significantly in any of those months....and have in fact cooled in May
Nope. You don't know what the raw data shows. The raw data from West Chester and Coatesville shows warming in May. Not as much warming as March, but warming nonetheless. West Chester and Coatesville both have long periods where station changes were minor allowing the true climate trend to be determined.
-
20 hours ago, ChescoWx said:
March - April - May Average Temperature Trends Raw Unaltered Data 1893 to Present - Near steady March and slight warming April with cooling in May.....

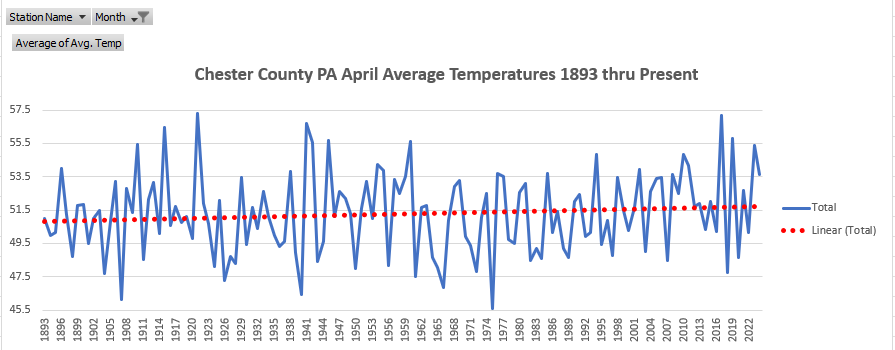
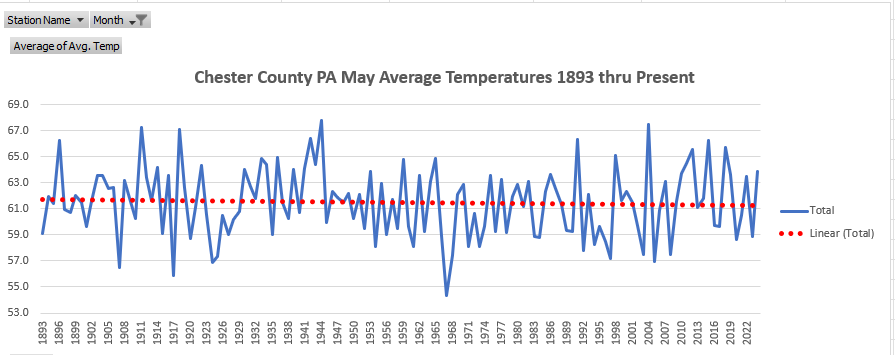
Raw data from West Chester and Coatesville shows March has warmed significantly in Chester County. I'm sure April and May have similar amounts of warming. The evidence is overwhelming that our county has warmed significantly.
-
 1
1
-
-
21 hours ago, ChescoWx said:
Of course still no answer for chilling to levels going below any actual real observations across the entire County.....Not one station was accurate for up to 100 years? So after the fact we chill every single one of them??
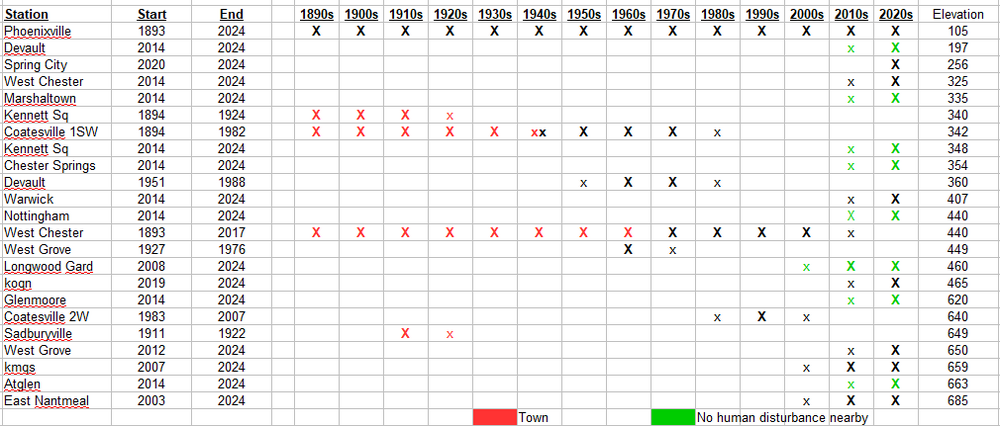
Nope again, I have provided the answer umpteen times. The stations that you complain about are in WARM locations. Warmer than the county as a whole. Its not accuracy; its location, location, location. Simple as that and the evidence is overwhelming. All you have to do is look at a map and land-use near the stations.
The raw temperature data confirms the warmth of early measurement sites. The early stations are about as warm Wilmington, Philadelphia or the Newark ag station. As soon as the Coatesville and West Chester moved to cooler locations, more representative of the county as a whole, NOAA matched them closely.
-
21 hours ago, ChescoWx said:
Funny how you again only cherry pick one station......again the entire county was chilled and altered to average temperature levels that almost no stations in the entire county ever recorded for 80 to 100 years.
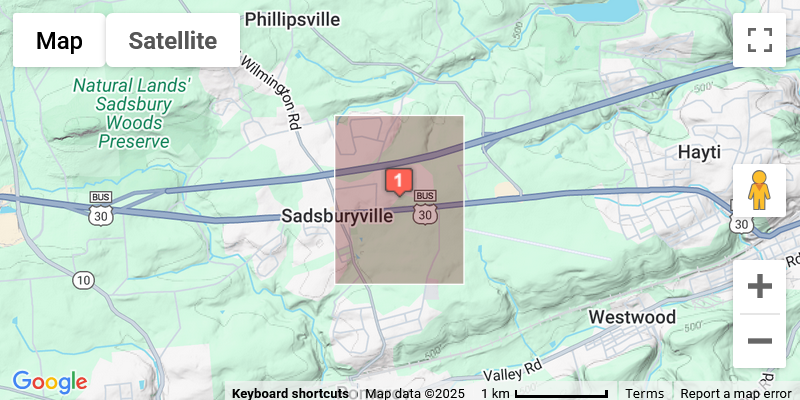
Surprised that you aren't more familiar with the station data or histories. West Chester is very representative of the early Chesco coops. Similar in temperature to Coatesville pre-move, Sadsburyville, and Kennett Square, and cooler than Phoenixville. Looks like Sadsburyville is in also in a town, like the early Coatesville and West Chester stations.
The 1948 Coatesville station is the first county station that is more representative of the county as a whole; and, NOAA matches it well. You can't understand the county climate history without studying the station network and how it has changed with time. Among other changes, there is a reverse heat-island effect in the Chesco stations as people and stations moved out of towns to more rural locations.
-
21 hours ago, ChescoWx said:
As always ignore and fail to show any support for 103 straight years of real actual data altering by cooling to a temperature often lower than any actual station ever recorded and only highlight a 3 year period.....
Nope. Of course I see that the older stations are warmer than NOAA. Perfectly understandable to me. The old Chesco stations are in warm locations. Before the 1970 move, West Chester was as warm as Wilmington. Why would anyone expect the Chester County average to be as warm as Wilmington?
-
5 hours ago, ChescoWx said:
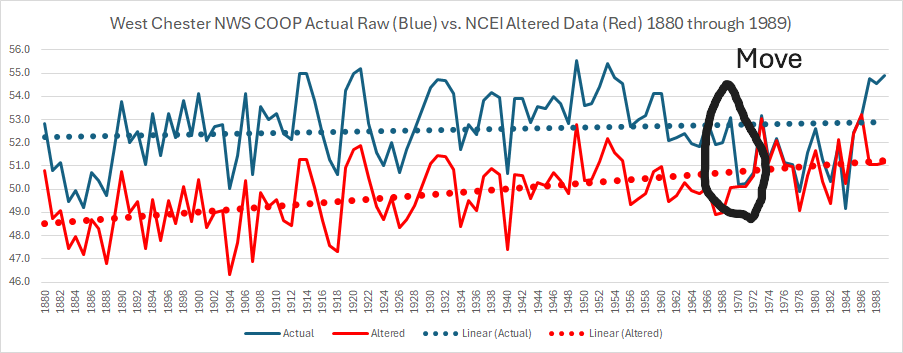
Let's look at just West Chester. With the altered data NCEI does try to show clear warming. However, yet again (like Coatesville) NCEI chose to chill each and every year at West Chester for 103 straight years from 1880 thru 1982. So why did NCEI choose yet another station to chill to a level below any actual real observation in the county? Without that chilling West Chester shows almost no warming at all! Facts always win out!
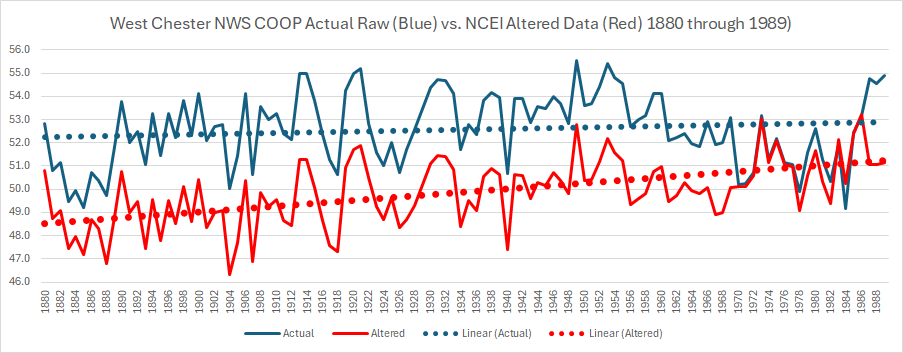
If you account for the 1970 West Chester move, NCEI is spot on. West Chester and Coatesville cooled at different times: Coatesville after the war and West Chester in 1970. Station moves not weather. Agree that facts always win out, but you can't pick and choose.
-
20 hours ago, ChescoWx said:
The data was indeed changed. altered and clearly chilled. The trend lines speak volumes. Without post hoc adjustments clear cooling with those adjustments clear warming.

Nope again. The difference in the trend-lines is mainly due to the Coatesville post-war move.
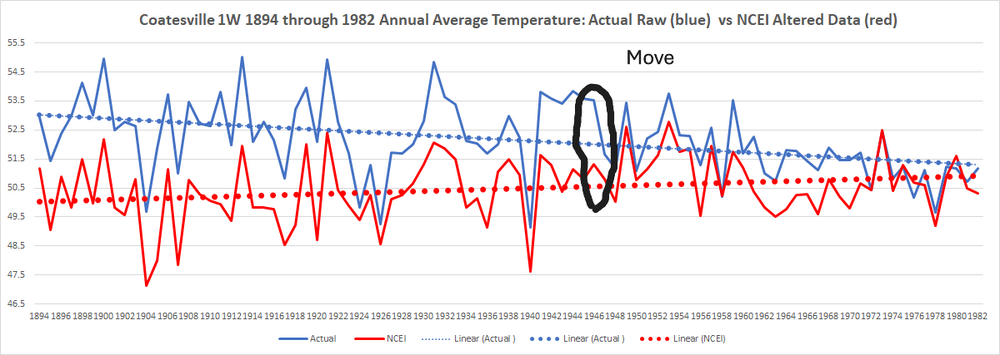
In comparison West Chester closely matches NOAA with no cooling. How many times do we have to go over the same material showing that the raw Chesco data is contaminated by station moves and other non-climate related changes.
-
1 hour ago, ChescoWx said:
Fake data - there is no Coatesville data after 2007 . Plus look at all those NOAA Adjustments - cooling the past and warming the nearer years......Only looks like much warming if you make up station data and adjust the past!!
Nope. The plot is raw data from three Coatesville stations, the two coops and the Coatesville Airport since 2007. The Coatesville stations are different but well matched. I could have used your house instead of the airport and the plot wouldn't have changed much.
Your criticism of NOAA is just a denier strawman. No data has been changed, made up, altered, or chilled. The truth is exactly the opposite. NOAA has isolated the real Chesco climate trend from all the station and network changes. The evidence is overwhelming. All the datasets that have a long record of consistent data agree with NOAA.
-
1
-
-
18 hours ago, ChescoWx said:
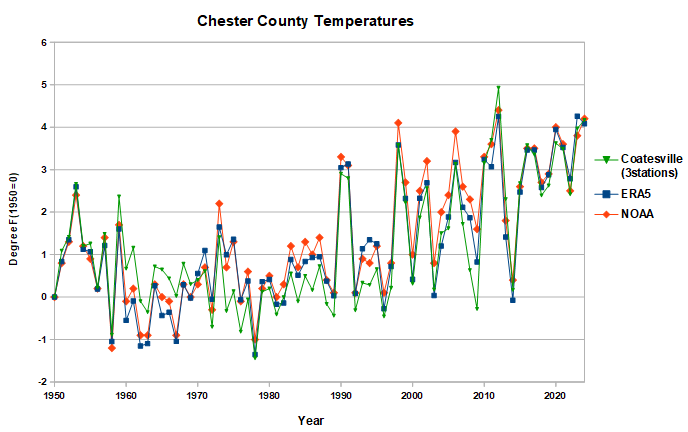
Now overlay the raw unaltered actual real data.....
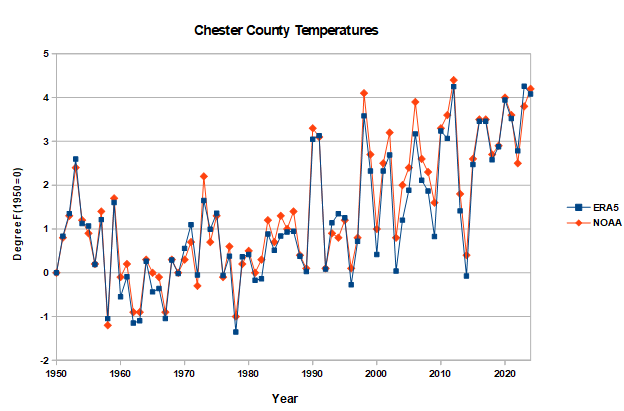
Coatesville raw data is in very good agreement with NOAA and ERA5. All the data confirm that NOAA is spot on with our local warming.
-
There is complete agreement on Chester County's climate between NOAA and ERA5 reanalysis. A big feather in NOAA's cap because the two series are independent, different data and methods.
-
20 hours ago, ChescoWx said:
No fear of non-Chesco data....but you make my case! The data after the adjustments as you admit is clearly no longer the actual climate data from Chester County PA. Following these post hoc adjustments the altered NOAA data for the majority of pasts years has now been chilled below levels recorded by even the coldest station in the county for decades at a time. That is simply not the data as recorded for the County. The actual raw data IS the actual NWS data as validated at the time of observation submission to the National Weather Service.
Nope, can't agree. You are playing word games instead of addressing the technical content of my comment. We've been going over NOAA's Chesco climate analysis for some time now. Nothing is being changed or distorted by NOAA, On the contrary, bias-adjustment has made a big improvement in the information we have about Chester County's climate.
NOAA nailed the big station moves at Coatesville and West Chester, and the warmth at Phoenixville in the 1930-50s. Of course the bias-adjusted values are different that the raw values. That is intentional, to separate station moves from real climate changes. You can't get our climate right without accounting for the changes in the temperature measuring network.
You keep complaining about the how cool NOAA is vs. the raw Chesco data. But the data doesn't support your assertion. You can't draw conclusions about the raw data without considering where the measurement was made. We just went over the 1940 to 1970 period. There were only 4 stations in that period and all are warmer than Chester County as a whole: The built-up sections of Coatesville and West Chester, Phoenixville, and West Grove. All south and east. As warm as Wilmington or Philadelphia at times. Phoenixville is always warmer than NOAA today. Coatesville and West Chester cooled to NOAA's county average as soon as they moved to cooler locations.
How about your analysis. You aren't getting the correct climate information from the raw data. Taking a simple average discards all of the information about where measurement was taken. The City of Coatesville is not the same as the rural area nearby, or Warwick, or any other station. The simple averages improperly combine the station and network changes into the climate estimate. That causes a large error given all the station changes in Chester County. You have made our past climate too warm, solely because the early station network is not representative of the county as a whole. Very easy to see in the chart I posted above.


2024-2025 La Nina
in Weather Forecasting and Discussion
Posted
Long-term temperature trends in the US are very well determined. There are thousands of stations and well proven methods for detecting non-weather-related station changes, heat islands, etc. 1970 was the only start date I had. Yes, warming would be a little less starting from 1950; but, warming would be even larger starting in 1900. Doubt the starting date would have much impact on the relative stance of the midwest, which is the point I was addressing.