

chubbs
-
Posts
3,535 -
Joined
-
Last visited
Content Type
Profiles
Blogs
Forums
American Weather
Media Demo
Store
Gallery
Posts posted by chubbs
-
-
Think the Gavin S and other experts are underestimating the effect of this nino. The timing fits a nino response but with faster onset and a larger overall warming than we have seen in the satellite era. Those features can be explained by the rapid warming in the east Pacific last spring. Global SST have peaked and are starting to fall. We'll see if this nino has a lasting impact on SST like the 15/16 nino.
-
12 minutes ago, ChescoWx said:
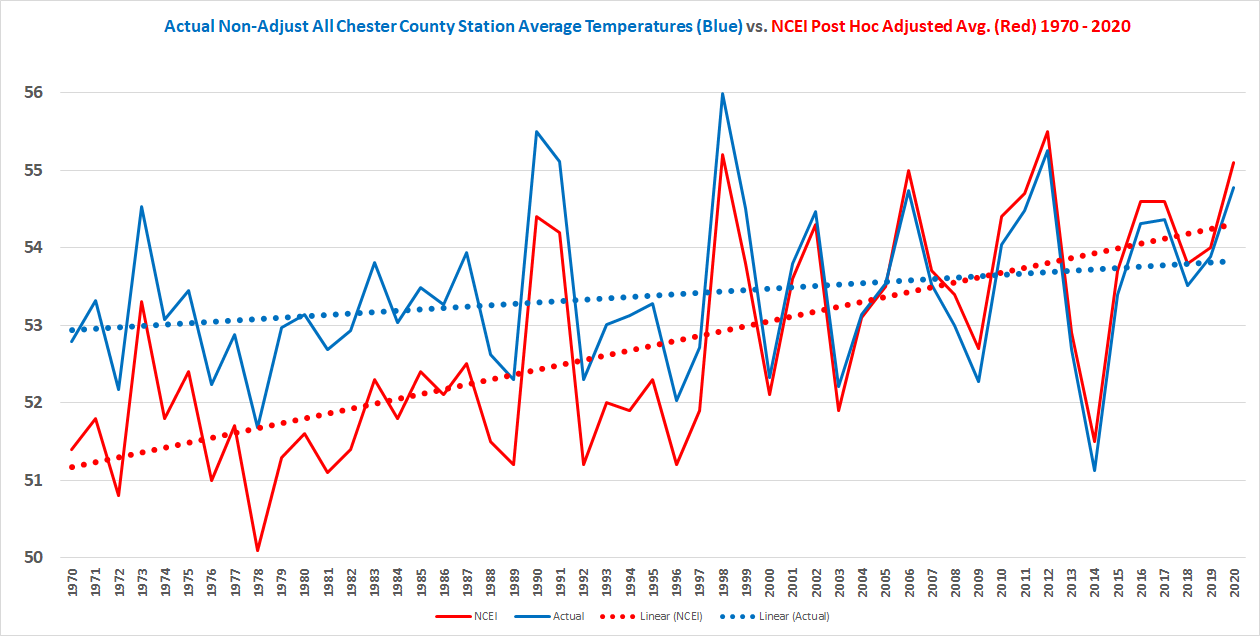
In reality Charlie quite the opposite....as you add more stations you decrease variability when averaging. There is no need to "control" or change the actual data after the fact. I have all available possible stations that should be in the NCEI Chester County average. Below is all available actual stations temps vs the post hoc adjusted averages just since 1970. You can as always see the significant cooling adjustments applied to the 1970's-1980's and 1990's....and then of course the gentle warming adjustments to the 2000's and 2010's. No wonder we only like to show the scary red after adjustments on TV and here....it clearly does a much better job supporting the climate alarmists agenda! If we showed the raw data it would not be alarming at all!! So Charlie we discussed earlier why we had to chill the 1920s/1930's/1940's (time of obs etc.) so what was the reason for the continued cooling after the fact adjustments from the 1970's thru 1990's and now the warming adjustments being applied over the last 20 years?? Was it time of obs bias? station siting? bad equipment?? If any of the above can you show us by station which ones were problematic and how the applied adjustments were calculated?
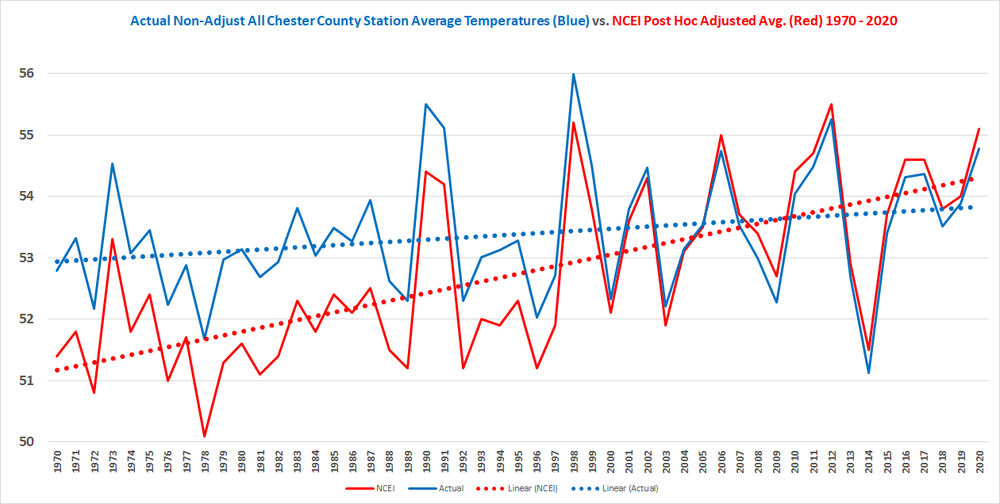
I see why you like the "averaging" method. It shows less warming than the data collected in your own backyard

-
 1
1
-
-
21 hours ago, ChescoWx said:
And again below is all stations with up to 17 actual reporting sites included in the most recent 2 decades. The same pattern of large chilling adjustments for 111 years and now increasing warming adjustments as you can clearly see during the past 2 decades. Why the post observation warming adjustments of 0.3 degrees in the 2010's? Is it time of obs? bad equipment? Do we know the exact answer??
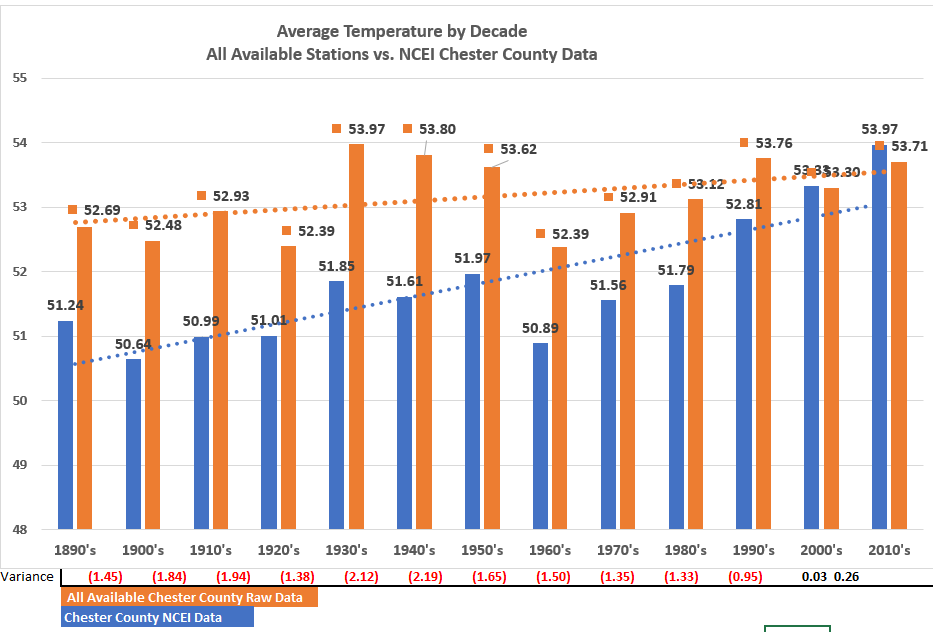
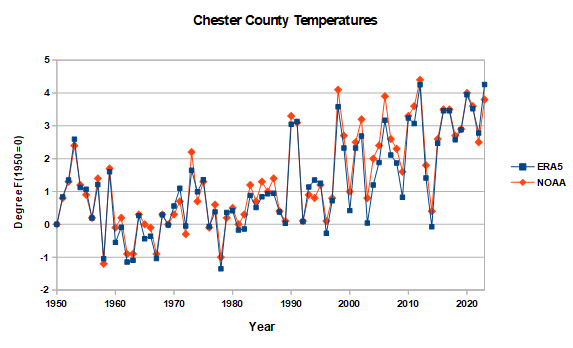
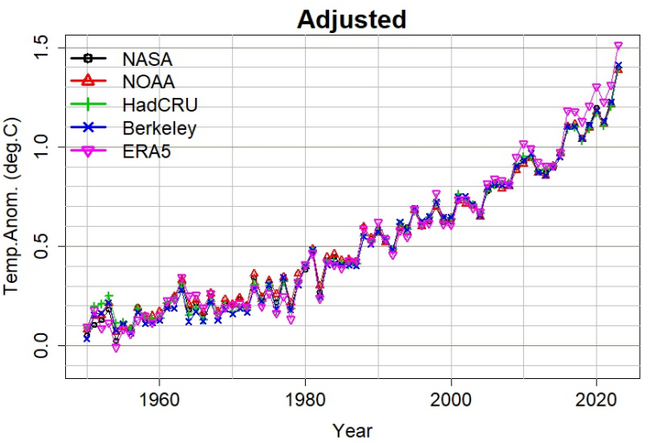
Your county averaging method doesn't agree with your own Chescowx series and the year-to-year differences are probably even larger; smoothed somewhat by the decade averaging. Not surprising because you aren't controlling for differences in average temperature between stations. Every time you add or subtract a station you change the average.
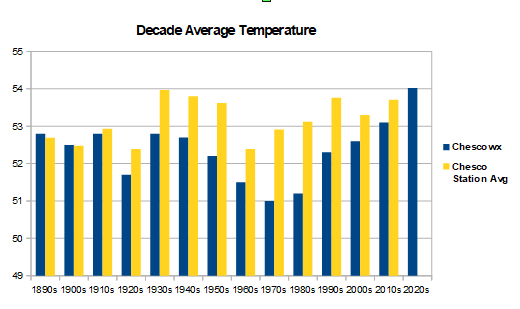
NOAA on-the-other-hand agrees very well with the ERA5 re-analysis developed by EMWCF, both on year-to-year temperature changes and on the overall warming since 1950. NOAA and ERA5 are completely independent using different datasets and methods, so agreement at the County level increases confidence in both series. Bottom-line - scientists have a good handle on Chester County temperature trends. If you aren't matching NOAA or ERA5 you aren't getting an accurate depiction of our local climate. Below is a link which provides background on ERA5, which has land temperature data back to 1950. Note that I can only get ERA data for a lat/long square that approximates Chesco.
https://climate.copernicus.eu/climate-reanalysis
-
 1
1
-
 1
1
-
 1
1
-
-
12 hours ago, ChescoWx said:
Time bias does not make a material difference as long as consistent obs are taken over 365 days - while making post observation chilling adjustments for 111 straight years and then warming the last 20 does not give anyone comfort in the data and trends is purports to show. I actually went back and recast my observations from 8pm to the current 24 hours for 3 years of data. The difference was less than 0.002 degrees.
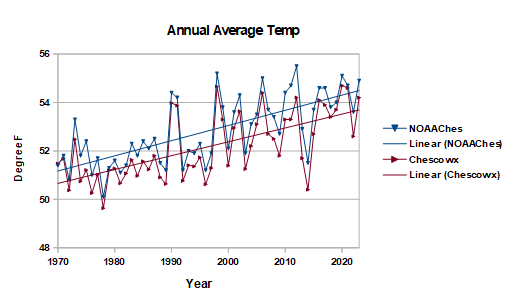
As usual you are jumping to the wrong conclusion based on lousy analysis. You aren't controlling for differences in average temperature between stations. Every time you change the stations included in your County average, you get a different result. To get a cooler result add in some relatively cool stations. I don't see any recent "warming adjustment" for NOAA when I compare to your own Chescowx series. Quite the contrary NOAA and Chescowx are in good agreement on the warming rate over the past 54 years. Good news for your post-1970 data.
As for the older pre-1970 data, yes we know you get a different answer for the raw vs bias adjusted. You are beating a dead horse by making the same comparison over and over again. We have a handful of older stations in Chester County. Adjustments for each station are published and not close to the "adjustments" you are coming up with in your latest. All the adjustments are based on comparison to other stations. If time of observation bias (TOB) didn't impact a particular station it won't contribute to that stations' bias adjustment. There are many reasons for bias adjustment besides TOB: shelter, aspiration, digital vs analog, moving equipment, broken instrument, a tree growing nearby, a tree cut down, etc.
Deniers have been complaining about "science-based" station adjustments for decades. But they never complete the technical analysis needed to provide evidence in a scientific forum. Without submitting material to a scientific forum your complaints about adjustments are a waste of time. You can whine all you want on a weather board but it isn't going to move the scientific needle.
-
1
-
-
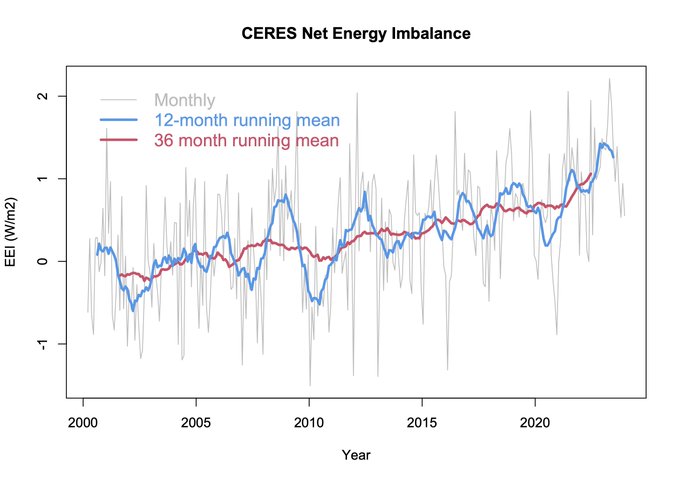
From Gavin Schmidt's twitter. Net radiation is coming down as atmosphere warming due to the nino increases radiation to space. The decrease in the past year isn't small enough though to put much of a dent in the decade-long increase.
-
2
-
-
4 hours ago, LibertyBell said:
wow it's not even summer yet, what are the implications for the summer for these places?
Don't have much info on Africa, but this could be the warm season for at least some of area. A portion of Africa is in the SHemi and the rest is tropical, with sun overhead at the spring equinox.
-
1
-
-
-
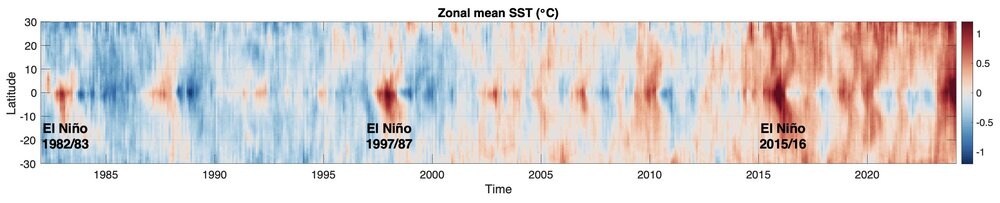
From Kris Karnauskas twitter, tropical mean SST anomaly averaged on latitude bands. Shows the impact of long-term warming and enso on tropical and sub-tropical SST. Ninos warm the tropics and sub-tropics while La Nina cooling is more focused on the tropics with less impact on the sub-tropics. The subtropics haven't been the same since the 15/16 nino. We'll see what the aftermath of this nino is.
edit: Added a plot showing trends for the east and west Pacific. Of course the east Pacific has the biggest enso effects.
-
3
-
2
-
-
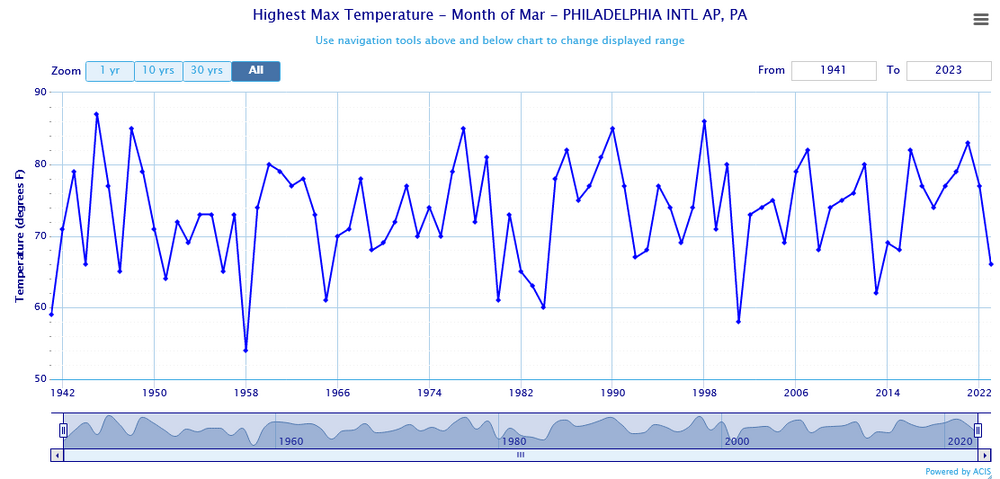
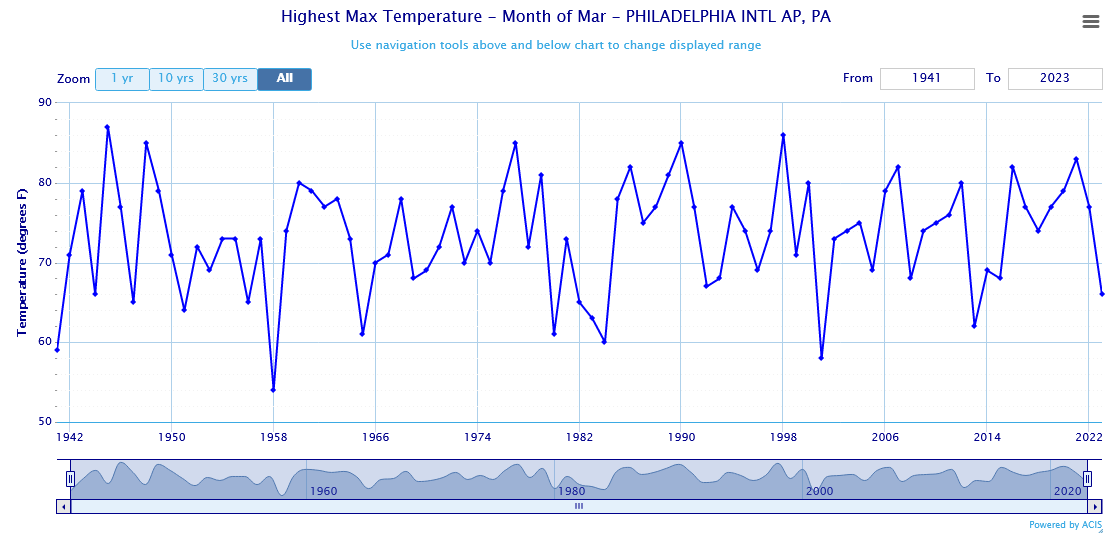
Spot checking the Philadelphia airport, there is no trend in the highest march temperature. Max is 87 in 1945. No wonder Martz and Chesco like this stat. Funny because Chesco's other favorite is the philly airport heat island.
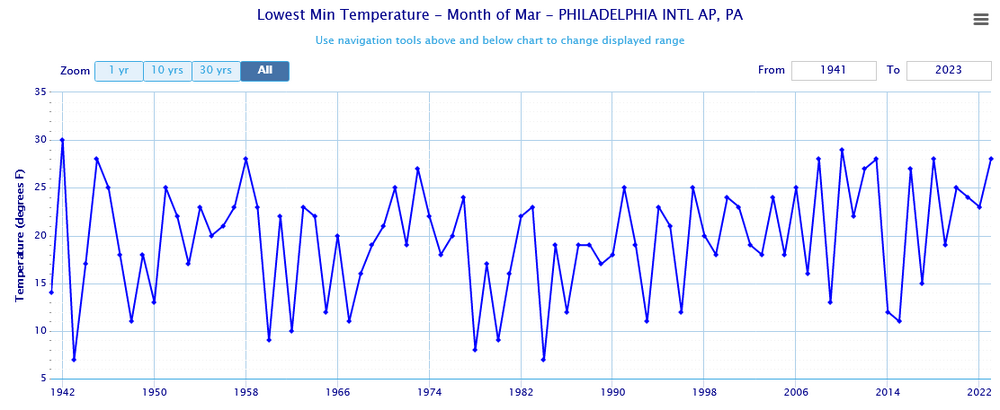
Edit: Added the minimum temperature for March at the airport. Here there does appear to be a rising trend in recent decades, but the warmest is 30F back in 1942.
-
1 hour ago, bluewave said:
Very impressive warmth.
In January ERA broke the record by 0.15C, while GISS only broke by 0.03C, Berkeley Earth by 0.05C and NOAA by 0.07C. ERA broke the February record by 0.12C, a little lower than Jan. We'll see how the obs come in Feb, probably another record month across the board but not guaranteed.
-
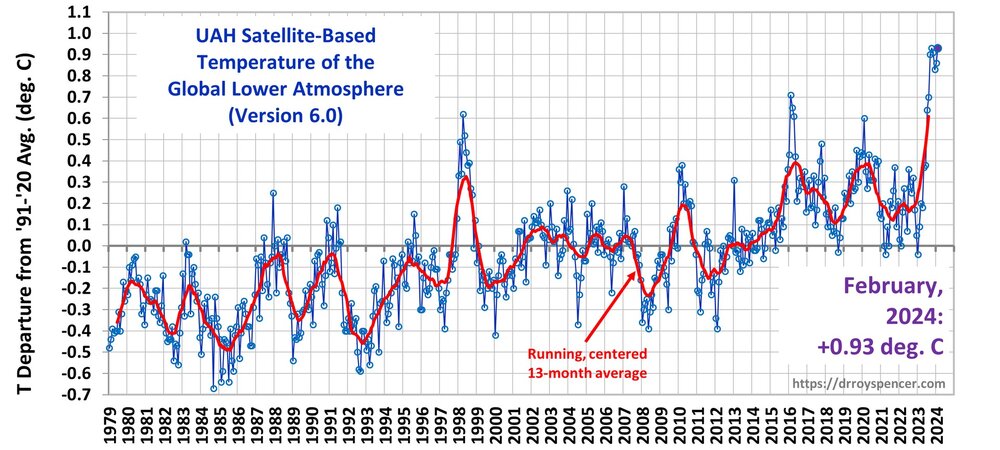
13 minutes ago, TheClimateChanger said:
Warmest February on record in UAH at +0.93C. Also ties October 2023 for highest anomaly of any month.
This nino is having an unusually large impact on UAH. The red 13-month average will continue to rise for several months as cool months come off. Clear now that the period after the 2016 nino is different in UAH than the period after the 1998 nino. I see 2 explanations: 1) we have better satellites now that are not impacted by diurnal drift, or 2) The urban heat island is starting to impact satellite measurements
")
-
On 2/9/2024 at 9:25 PM, donsutherland1 said:
It’s an interesting paper and it confirms “tipping” behavior related to the AMOC. Tipping abruptly from one stable state into another one has been found elsewhere, so I don’t believe it is too surprising that researchers found that the same could hold true for the AMOC. IMO, had they found against tipping, that would have been a more surprising outcome.
The full paper is here:
https://www.science.org/doi/10.1126/sciadv.adk1189
Below is an interview with the lead author, which provides good background for understanding the study implications. The unrealistic modeling scenario is needed because current models are inadequate. Not the best position to be in with the system trending toward less stability.
.
-
3
-
1
-
-
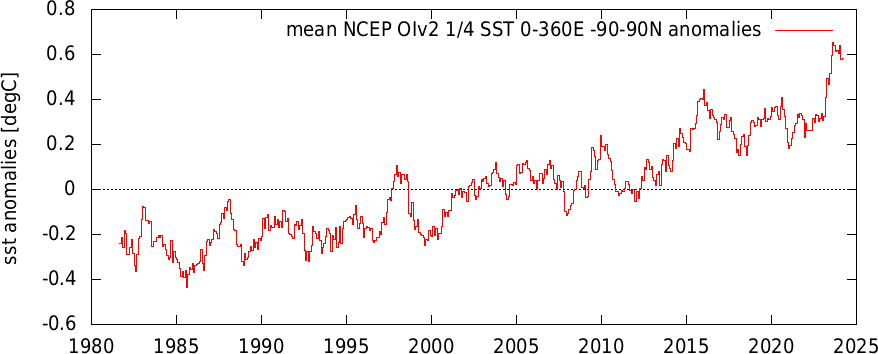
This nino continues to have atypical timing. Global temperature anomalies have plateaued since September, instead of continuing to rise into a typical Feb/March peak. Don't think a record is a slam dunk this year. Will depend on how fast and far the decay is as nino----> nina.
Also note the warming since 2014, roughly 0.8C, or 10-20% of an ice age. An unusual decade. That may help explain why there is much more discussion of where our winters are headed vs 10 years ago.
-
1
-
-
1 hour ago, Typhoon Tip said:
Kinda of ... ? I don't think capitalism and "price regulatory aspects" need to be mutually exclusive. "Capitalism" isn't the problem.
- doing so unconstrained, thinking it is alright ( or just being oblivious, sociopathic ...etc) to be unencumbered by moral responsibility to the consequences of an unrestrained system? That's where the problem is.
Capitalism is a human invention - we decide. In a very coarse definition, we could say free and fair economic system that is within the confines of moral responsibility - chiefly, to do otherwise and undermine the ability to survive, violates the fundamental principle of being alive, which is to protect the ability to be alive.
What I was saying before is that ... humanity is still not connecting CC with a a threat to that level. Ever hear it said in literature and cinema, "I never quite understood. I knew what it meant, but only now I really get it" - this spiritual awakening to the crisis has not been enlightened yet.
The CC storm is coming ... When the NHC statement warns, "...Preparations need to be rushed to completion... " That's where we fail to connect.
It may be an untenable at this point. The "system" is gotten to be 'too big to succeed', ironically.
Yes, capitalism isn't the problem. The problem is that vested fossil fuel interests don't want capitalism to solve the climate problem and work to keep the deck stacked in their favor. A carbon tax has been a no-brainer for decades as a conservative solution. Also agree that people have a hard time connecting the dots on climate change. One factor, we've never seen climate change before and don't know what it looks like.
-
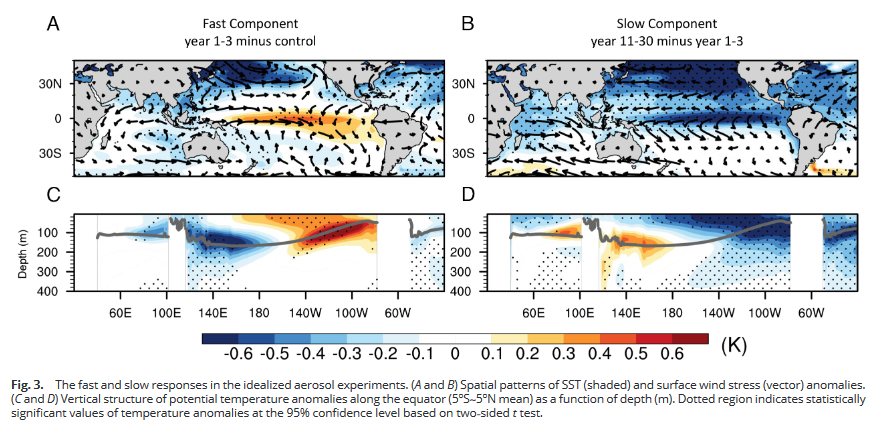
This paper indicates that man-made aerosol effects on enso can be prolonged, well after the emissions have been reduced. Could help explain recent favoring of la nina.
The discrepancy between the observed lack of surface warming in the eastern equatorial Pacific and climate model projections of an El Niño-like warming pattern confronts the climate research community. While anthropogenic aerosols have been suggested as a cause, the prolonged cooling trend over the equatorial Pacific appears in conflict with Northern Hemisphere aerosol emission reduction since the 1980s. Here, using CESM, we show that the superposition of fast and slow responses to aerosol emission change—an increase followed by a decrease—can sustain the La Niña-like condition for a longer time than expected.
https://www.pnas.org/doi/pdf/10.1073/pnas.2315124121
-
1
-
-
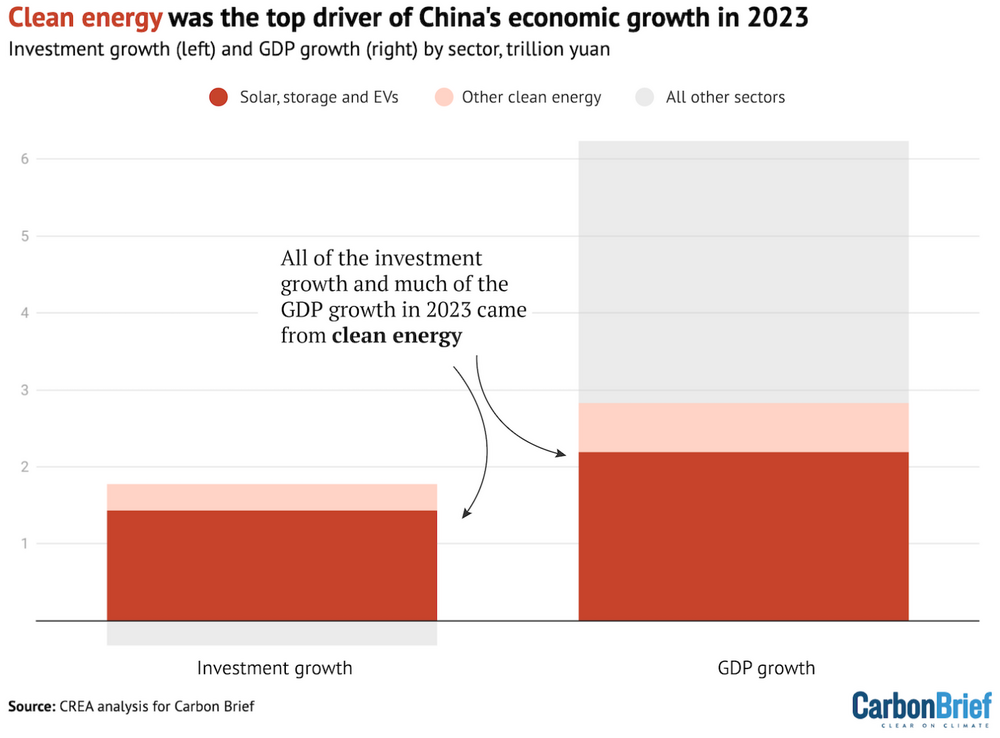
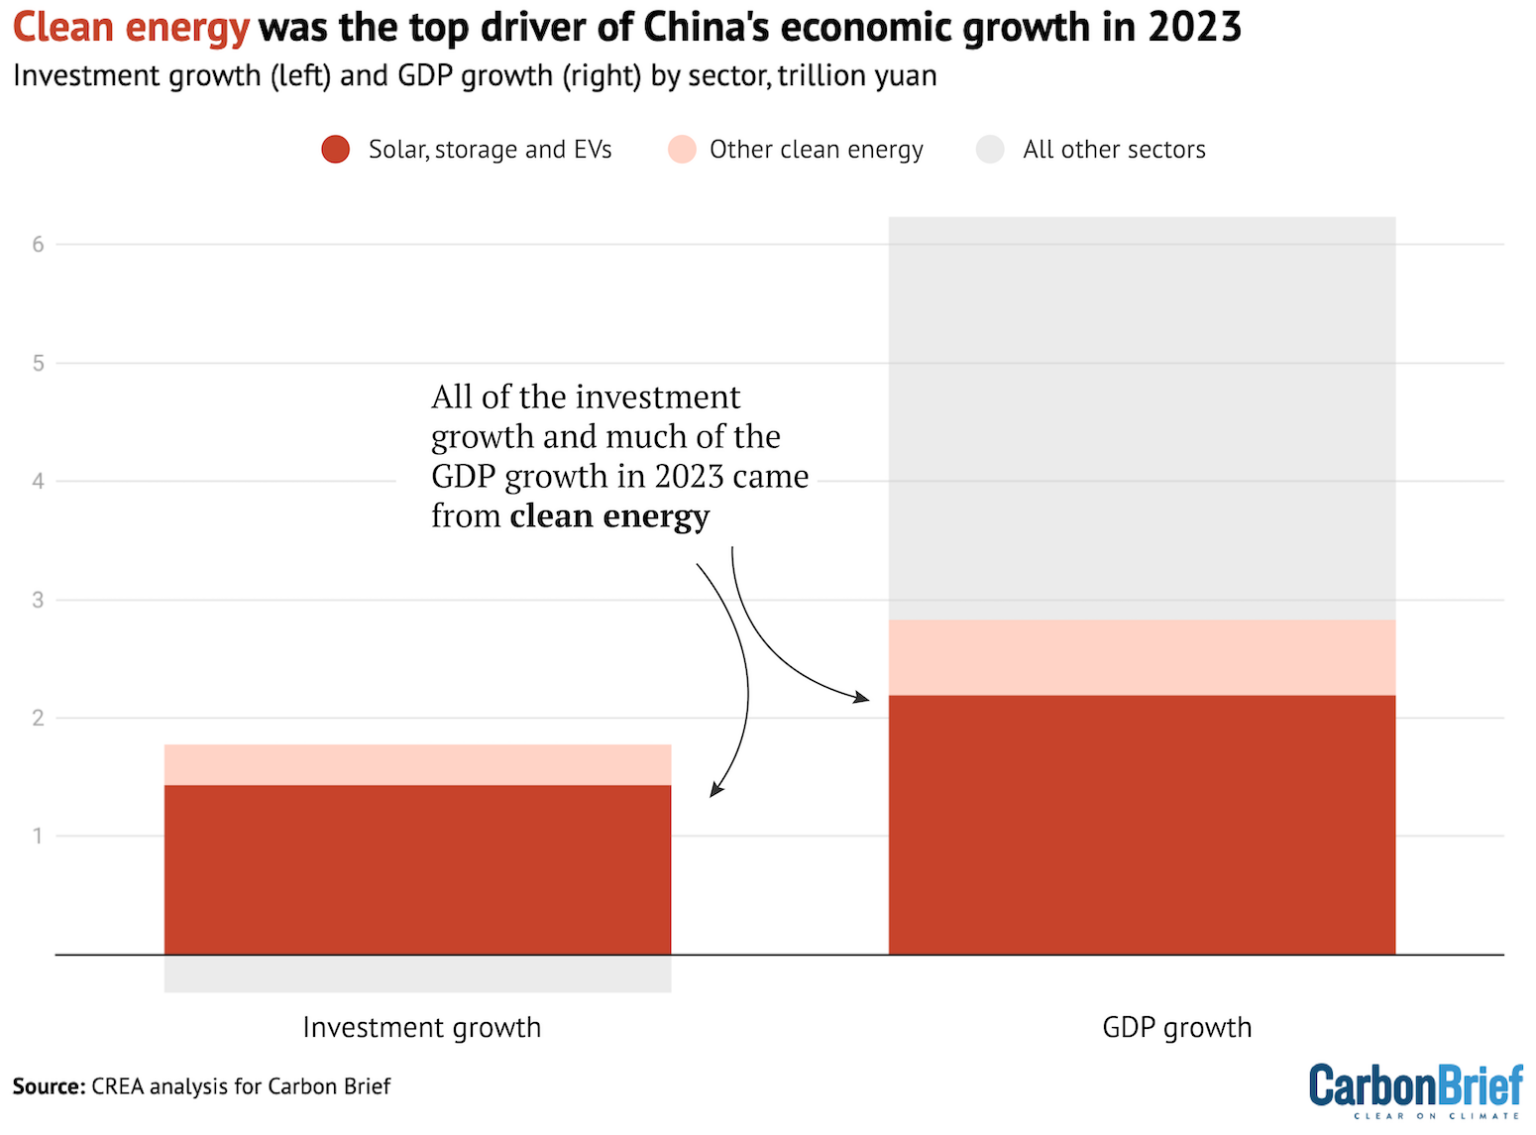
Clean energy has become an economic growth engine for China as costs continue to tumble and foreign uptake increases. We are a laggard in an increasingly important economic race.
https://www.carbonbrief.org/analysis-clean-energy-was-top-driver-of-chinas-economic-growth-in-2023/
-
14 hours ago, csnavywx said:
Solar and EV equity prices continue to be smashed, with the TAN ETF down 16% so far this year and 43% y/o/y. Even the best positioned companies are suffering pretty heavy balance sheet hits due to higher rates and higher capex costs, despite hardware component price declines.
Domestic EV makers are being hit in particular due to slumping demand and are sensitive to higher financing costs.
Unless those margins can be improved, R&D and capex will start taking a hit and these deployment rates are going to suffer as a result. Like I mentioned before, costs are important, but we live in a capitalist system -- profit margins are even more important!
I was hoping we'd get some interest rate cuts this year, but the market is starting to price those back out as core inflation remains too sticky/resilient.
-
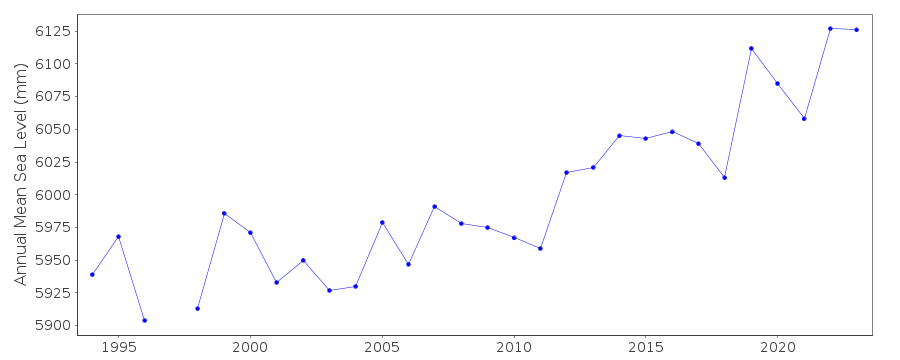
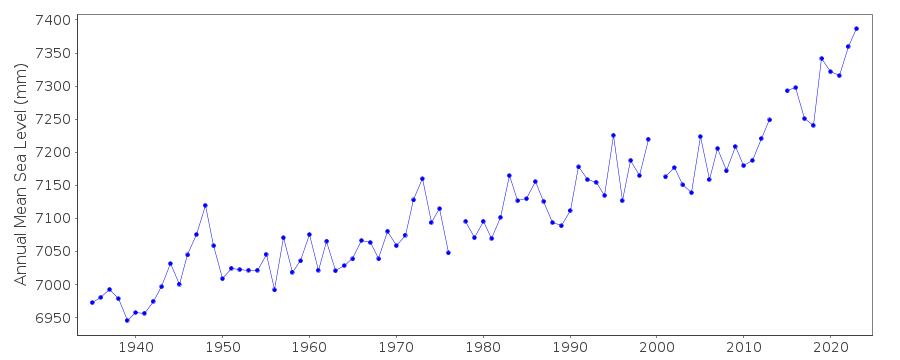
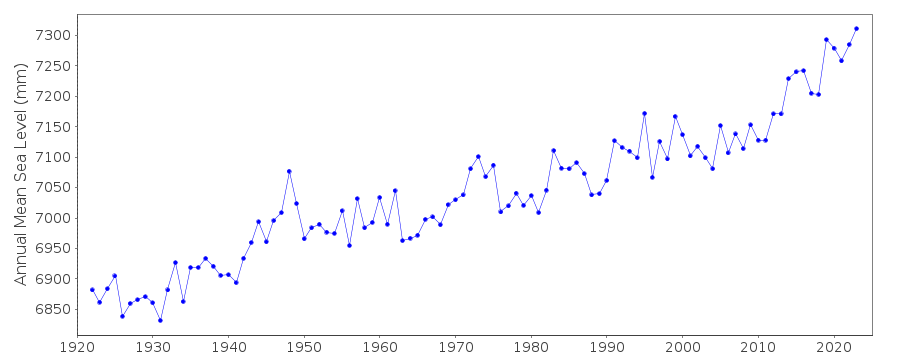
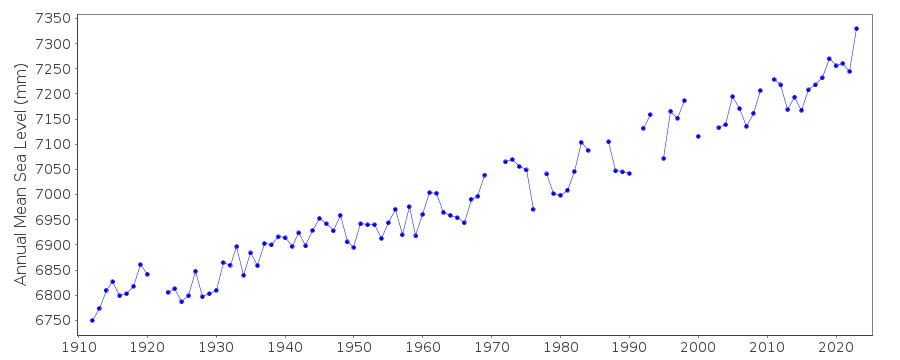
A spot check of East/Gulf coast tide gauges shows an acceleration starting around 2010. Sea rise is accelerating globally, but not this fast. Change in ocean currents, as discussed above, a possible contributor.
St Petersburg, FL
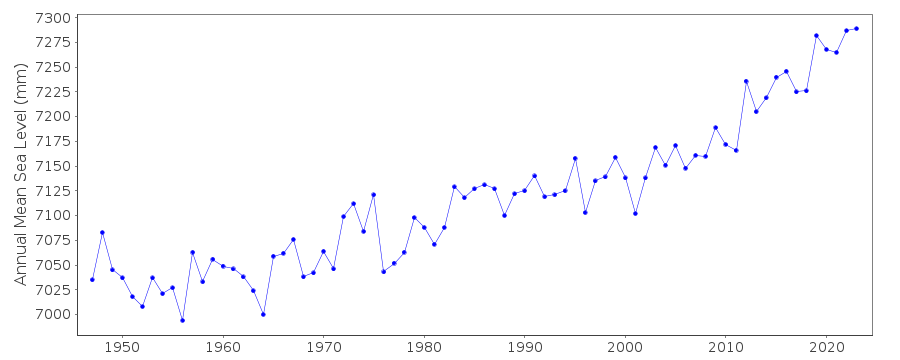
Virginia Key, FL
Ft Pulaski, GA
Charleston, SC
Atlantic City, NJ
-
2
-
1
-
-
9 hours ago, LibertyBell said:
Humans are extremely resistant to change, this is what it comes down to.
Ironically, in this case resisting change is accelerating change.
-
5
-
1
-
-
6 hours ago, LibertyBell said:
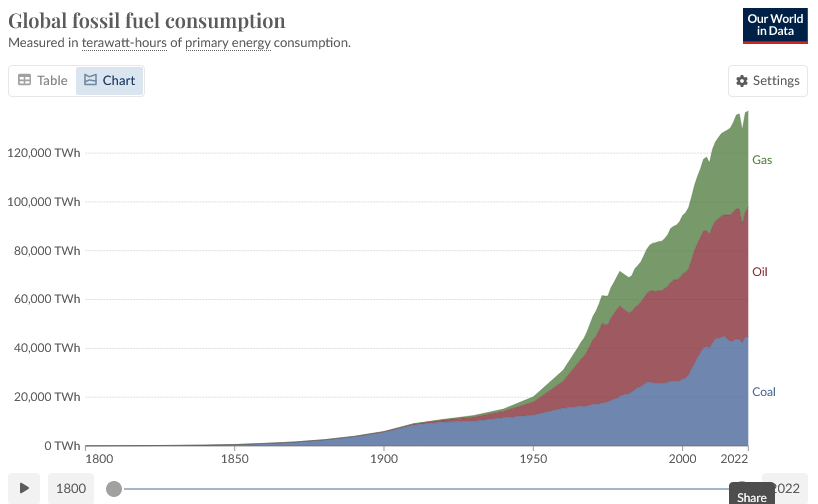
We're already past peak fossil fuel usage aren't we?
Hasn't peaked yet, but rate of increase has slowed. Will peak by 2030 according to IEA. Need to speed things up to hit climate targets.
https://www.weforum.org/agenda/2023/10/iea-energy-peak-fossil-fuel-demand-by-2030/
-
1
-
-
Here's a good free review article on tropical cyclone frequency. Bottom-line: we don't know whether the number of storms will change with climate change. The 78F threshold will tend to increase however because the upper troposphere is also warming. Has to be warmer at the surface to generate the same amount of convection in a warmer world.
https://agupubs.onlinelibrary.wiley.com/doi/pdf/10.1029/2021EF002275
-
2
-
1
-
-
Like batteries, solar is ramping rapidly as costs continue to drop on a well established learning curve. Under this recent forecast, solar will be roughly 10% of global energy use in 2030. This forecast also follows the IEA net zero scenario which has 1000 GW of yearly solar AND wind installation by 2030. Moreover solar could do better, forecasters have been underestimating solar growth since solar forecasting began. Solar exponential growth wouldn't have to continue too much longer beyond 2024 to rapidly turn down fossil fuel use.
-
2
-
-
Tamino's latest on removing 3 main natural factors from global temperature series: enso, volcanoes and sun. Makes the recent acceleration easier to see and statistically significant. My only quibble is whether he has removed all of the enso variation. I don't think that would change the result though, removing more year-to-year variation should make it easier to detect acceleration.
https://tamino.wordpress.com/2024/02/16/adjusted-global-temperature-data/
-
1
-
1
-
-
13 hours ago, csnavywx said:
I'm less sanguine on this than others due to a complete lack of consideration for profits, power density, grid infrastructure or firming costs in virtually all of the analyses. Cost of raw hardware components and the initial margins are always talked about, because they're favorable. In reality, they end up being quite cheap *at first*, but quickly run into firming cost issues as soon as saturation increases. Regardless of whether you like it or not (I sure fuckin don't), we're trying to transition in an almost completely market-based manner and the market is overwhelmingly concerned about returns. Ask GE or Siemens how that's going for them recently with cratering profit margins. Hell, with battery farms, most of the returns at this point aren't even in what you would expect -- power arbitrage. It's in ancillary services! Returns in general were a lot easier in a low inflation, zero-interest-rate environment. Zero consideration is also given to rebound effects. Slow decarbonisation is a trap, as the incremental additional capacity will get used up on growth. Efficiency savings will be spent elsewhere and typically result in *more growth*. You need decarbonisation in large chunks.
Yes the free-market system isn't going to ditch fossil fuels on its own, at least not quickly. The incumbent has large competitive advantage. Everything from installed infrastructure, favorable laws and regulations, to brainwashed media and bought politicians. However, we wouldn't have solar, wind, and EV without past government support. I'd argue that government support is likely to increase, now that commercial success has been achieved. Who wants to be left behind? For instance in the US, IRA has spurred record-breaking investment in the past year.
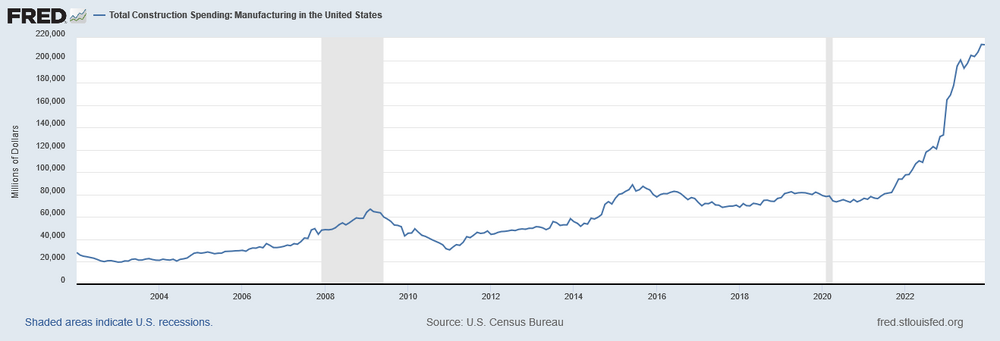
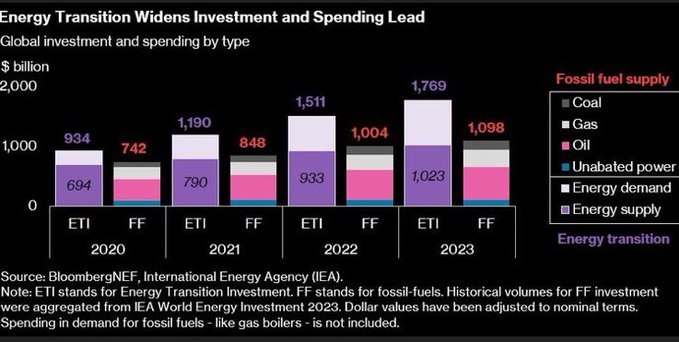
I suppose we could pull the rug out from under clean-energy technologies in the US, but China, Europe and others would plow ahead without us. On a global basis, investment in clean energy technologies has become much larger than fossil fuel investment. I expect the gap to continue to widen. There are tipping points in economics also.


Global Average Temperature 2024
in Climate Change
Posted
Related to the point I made above. Nino34 wasn't a good metric for this nino. Nino12+3 warmed fast and early, leading nino34, and triggering the global SST rise. Of course other factors played a role. The large radiation imbalance during the nina years warmed the subsurface, which primed the pump.