

chubbs
-
Posts
3,547 -
Joined
-
Last visited
Content Type
Profiles
Blogs
Forums
American Weather
Media Demo
Store
Gallery
Posts posted by chubbs
-
-
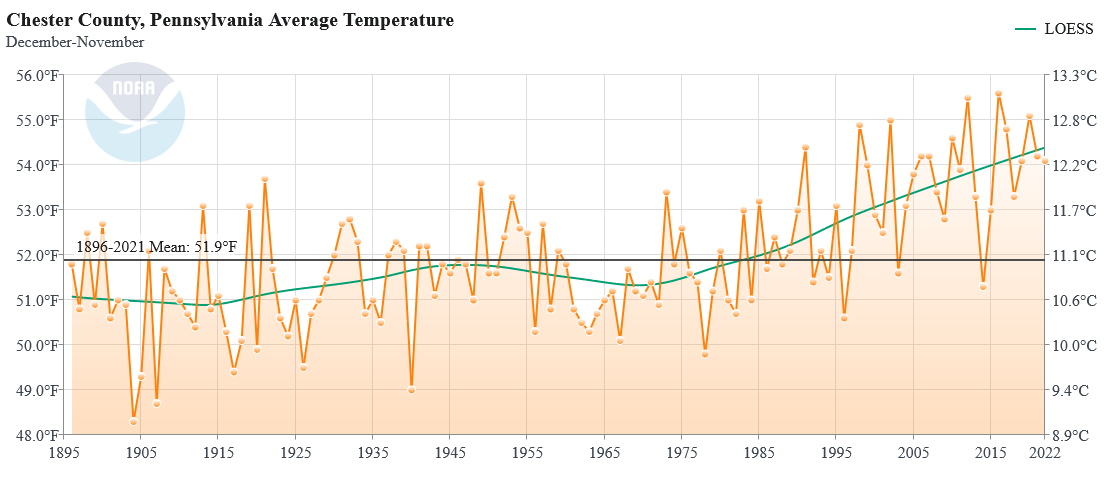
12 minutes ago, ChescoWx said:
Not at all....climate cycles take time and not one year or two....here in Chester County we have experience multiple cooler decades and now multiple warmer decades - so let's review at the end of the next decade and see how it looks.
Where is the courage of your convictions? We'll have North Carolina's climate by end of the next decade. And you will still be in denial. With steady warming it didn't take long to see that JB was wrong and it won't take long to evaluate your prediction either.
-
 1
1
-
-
1 hour ago, ChescoWx said:
Let's do it!! although I suspect we see a couple more warm years in 2023 and 2024 before a steady state to decline in temps starts to take place later in this decade of the 2020's and of course cooler decade in the 2030's - but yes let's track it over the next 17 years and see where we stand when we get to December 31, 2039 - looking forward to reviewing the actual data at that time!!
lol, waffling already
-
1
-
-
1 hour ago, ChescoWx said:
Right...."properly analyzed" is your code for post observation adjustments that help address that pesky warming cycle that throws the monkey wrench in any analysis of actual data that purports to show a never ending warming pattern
How about we track your cooling cycle prediction in this thread? Lets see if you do any better than JB.
-
1 hour ago, ChescoWx said:
And of course when we go back a bit further back to better understand the you know....actual cyclical pattern - a heck of a way to run a warmup during the 1st 7 decades of the 20th century - quite the cycle of cooling at most rural sites in Chester County PA before the current cycle of warming

We've been over this a million times. The coop stations cooled when modern equipment was introduced. Fortunately, as shown in your chart, the coop station changes occurred at different times and can be easily identified by comparing stations. When properly analyzed, the "cooling" shrinks, leaving a long-term warming trend.
.thumb.png.4f014a6424623294589d93072587b6a2.png)
-
1
-
-
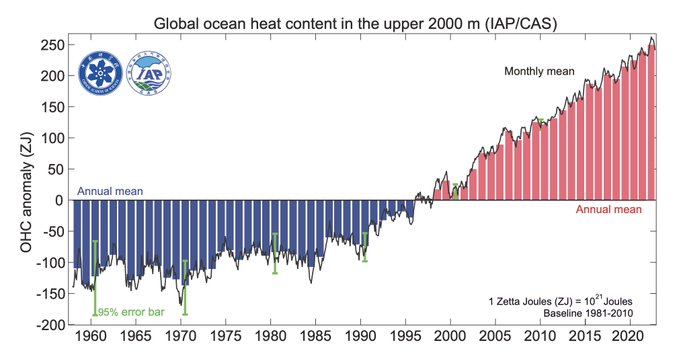
Over 90% of the heat in the climate system is stored in the ocean. Currently, the climate system is out of equilibrium and warming rapidly on a geologic scale (ocean warming below). Good luck getting a "cooling cycle" when more energy is coming in from the sun than being radiated out.
https://link.springer.com/content/pdf/10.1007/s00376-023-2385-2.pdf
-
1
-
-
28 minutes ago, ChescoWx said:
I do indeed believe we are heading back to a few cooler decades in a row likely starting this decade....it just makes cyclical sense. A warm month of January and even a February will do nothing to disprove my cooling cycle prediction....
This is a heck of a way to run a "cooling" cycle.

-
5 hours ago, ChescoWx said:
So what climate disasters can we attribute so far to this AGW during the last 50+ years of our current warming cycle??
You are asking the wrong question. Going back 50 years, scientists have made very accurate predictions of future warming (see link below). Scientists have also gotten the consequences of warming right, but have underestimated the speed in many cases. For instance, sea level rise is proceeding at the upper end of projections. Ice sheets, permafrost, forests are all changing faster than anticipated. There is lag in the climate system. due oceans and ice sheets which have large thermal mass. While we see the impact of warming today: heat waves, flooding, forest fires, drought, sea level rise etc; much bigger change is projected for the future; unless we get our act together.
How about your own predictions? Below is a recent one that didn't take long to go belly up. Not surprising, deniers/skeptics have a horrible track record. The next cooling cycle is always just around the corner. Has been for decades.
https://core.ac.uk/download/pdf/288430943.pdf

-
4
-
-
10 minutes ago, etudiant said:
Not enough, unfortunately.
The actual baseline capacity of renewables is a fraction of their rating, so we need multiples of the rated levels to get reliable power from renewables.
An effective system for energy storage is desperately needed to make renewables economically viable.
Sure we will still be using a lot of fossil fuel in 2030. Its going to take decades to make a complete transition from fossil fuels. We should have started a long time ago. Still the trajectory is clear. According to FERC,between 2022 and 2025, there will be virtually no net additions of natural gas and nuclear in the US as additions and shut-downs are nearly balanced, while coal capacity will continue to drop. Wind will also grow but not as fast as solar. All of the grid additions to 2025 will come from renewables, while at the same time shrinking coal. Furthermore solar will be even cheaper in 2025.
Here's a $6 billion investment in China. A 50GW per year PV manufacturing facility coming on-line in 2024. At a 15% use factor that's 5-10 nuclear power plants per year, from a highly automated facility. While the energy source is diffuse, solar is developing a massive scale advantage vs fossil and nuclear at the manufacturing plant.
https://www.pv-tech.org/longi-to-invest-us6-7-billion-in-building-new-production-base-in-china/
-
1
-
-
Same old clown story from JB. On a more optimistic note. Solar is dominating electricity addition in the US. The writing is on the wall for fossil fuels.
"Nearly two-thirds of US generating capacity additions in the next three years will be fulfilled by solar, with the technology’s share of power generation in the country set to almost double, according to a report from the Federal Energy Regulatory Commission (FERC). "
“Moreover, if the current trajectory persists or accelerates, generating capacity by the mix of all renewables should overtake that of natural gas before 2030 and possibly much sooner.”
https://www.pv-tech.org/solar-to-dominate-us-capacity-additions-73gw-expected-through-2025/
-
1
-
-
11 hours ago, bdgwx said:
I think you need to do the changepoint/breakpoint analysis to see what affect it has on those COOP stations. For example Berkeley Earth found 16 breakpoints on Coatesville, 12 on West Chester 2NW, and 12 on Phoenixville. And I see at least 3 documented station moves including the one last year for Phoenixville. Chadds Ford, Honey Brook, and Glenmoore do not officially report temperature according to GHCN, HOMR, and BEST. For example, Glenmoore observer uses the Davis Vantage Pro and is not approved by the NWS. That's typical. COOPs can report temperatures for operational purposes, but they are not approved for climatological purpose. Anyway, I could only find climatological data for 3 of the stations (Coatesville, West Chester, and Phoenixville). All 3 of them show significant warming when the breakpoint adjustments are applied. This is why it is really important to apply some type of changepoint/breakpoint analysis. Both GHCN and BEST provide their source code so you can use them as a starting point if you want to roll your own. However, based on the literature I've read it looks like a significant and challenging effort.
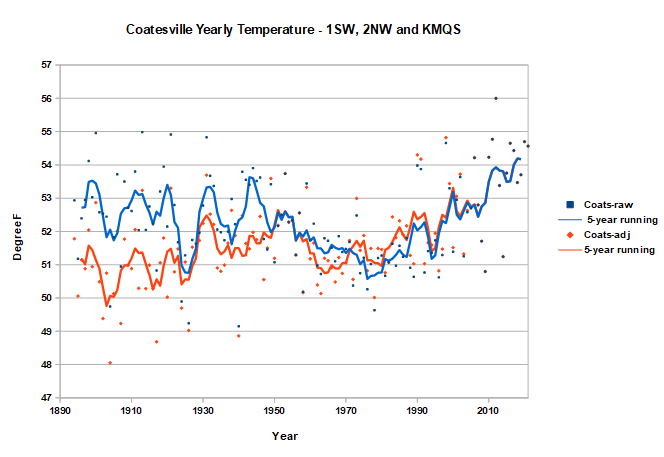
Its not hard to find the most important breakpoints (station changes) on your own by comparing to nearby stations. Here's an example from Coatesville at the end of World War II. Roughly a 2F drop relative to other regional stations. That will help obscure the true warming trend.
The adjusted data is also available. Here is Coatesville raw vs bias adjusted. The difference is roughly 2F over the period mainly due to station changes before 1950. Manmade forcing began to dominate around 1970 before that natural variability and local air pollution were more important. Since 1970 the raw data doesn't need much bias adjustment and the warming rate for both series is around 3F.
-
1
-
-
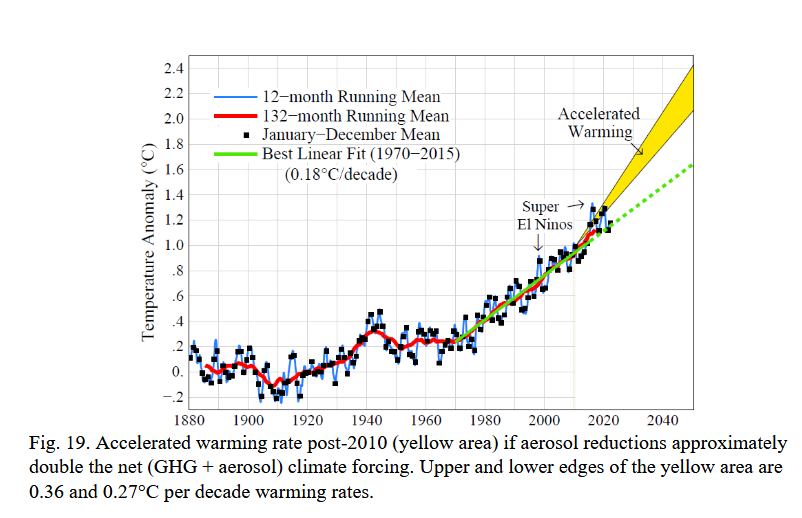
A figure from a recent Hanson paper (pre-publication undergoing peer review). Shouldn't take long to see if he is right.
https://arxiv.org/abs/2212.04474
-
3
-
-
On 1/12/2023 at 10:42 AM, ChescoWx said:
Always funny you fall back on faulty sensors or observation reports when the figures don't work out....
When something doesn't look right I compare to other observations. Measurement problems at phl last year and ptw over the recent past have been well documented on the other weatherboard.
-
1
-
-
4 hours ago, ChescoWx said:
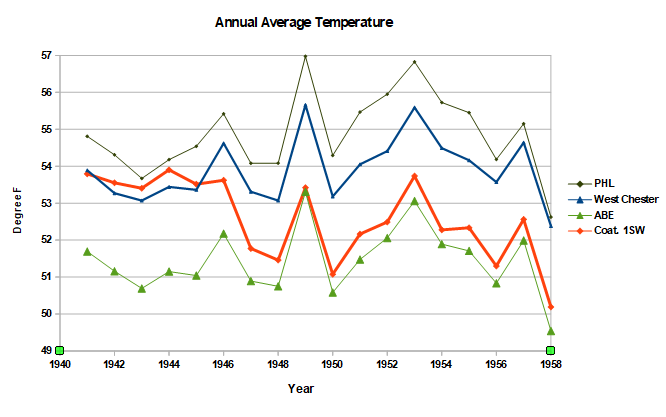
Below is the updated analysis comparing PHL Airport vs. All long running Chester County Observation Sites from 1940 through 2022.
For the year 2022 all Chester County locations reported lower average temperatures vs. 2021. ranging from 0.4 to 1.0 degrees cooler than the prior year. Philadelphia was 1.0 degree warmer than 2021.
The analysis for the last 82 years since 1940 shows overall trends of modest cooling at the Chester County stations at Glenmoore and slight warming at Phoenixville and West Chester with Coatesville/East Nantmeal showing the most warming but only very modest warming at best. Philadelphia's trends of course shows pronounced steady warming that is continuing to accelerate.

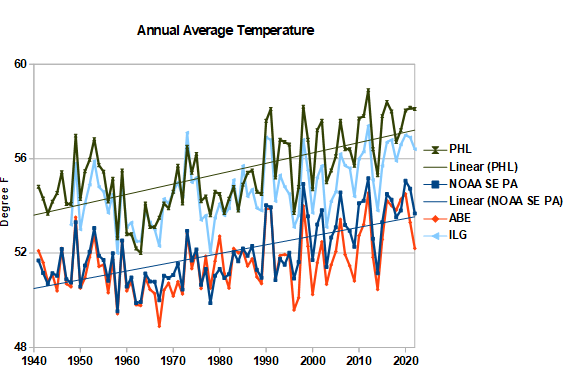
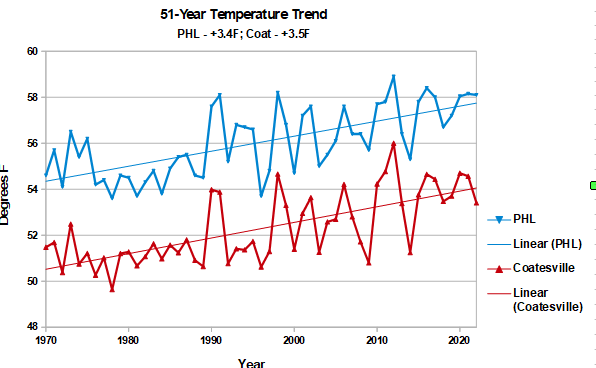
Lets broaden out the analysis. Here is the philadelphia airport vs other Mt Holly long-term climate sites and the NOAA climate series for SE Pa. Yes Philadelphia was too warm last year. The problem started at the end of 2021 and ended late in 2022. Easy to see by comparing with nearby stations. Over the long-term though there is good agreement among the climate sites and with the NOAA regional record. phl is warming a bit faster and abe a bit slower, but good agreement overall.
What about the coop stations? Lets go back to the 1940s. The COOPs were using mercury max/min thermometers that were reset between 5 and 7 PM. This alone added roughly 1F of warming bias, vs the climate sites that were on a midnight-to-midnight basis. There may have been other differences between the climate sites and coop stations.
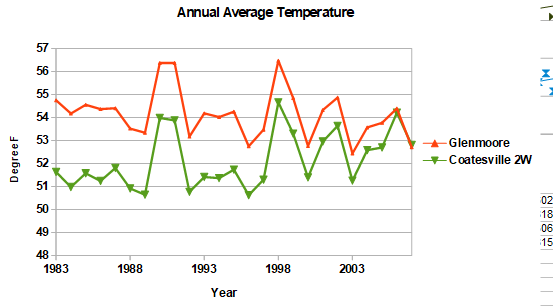
Secondly, The chart you posted shows poor agreement among the Chesco sites both year-to-year and over the long-term. As an example below is a chart I have handy comparing Glenmoore and Coatesville 2W. Both of these stations can't be right. Fortunately the NOAA bias adjustment can sort out the station updates and measurement problems. In the chart below Coatesville is good and Glenmoore way off. After adjustment the coops come into much better agreement and look like the other regional data.
Regarding "heat island" effects. You've been reading too much Tony Heller and other climate deniers. This isn't a rapidly growing area. The airport doesn't change much from year-to-year or even decade-to-decade. Certainly not enough to impact temperature measurements.
-
1
-
-
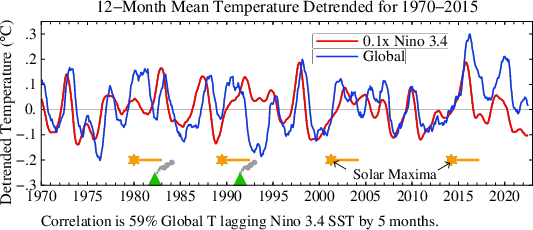
The 1970-2015 temperature detrending in this Hanson chart isn't strong enough for 2015+. Another sign temps could should pop to a record when the nina reverses.
-
2
-
-
1 hour ago, ChescoWx said:
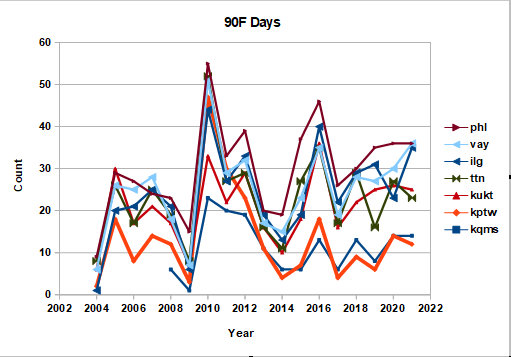
As clearly shown below the trend away from the PHL heat island airport for 90 degrees is clearly falling over the last 10 years - the disparity when compared to PHL continues to grow. The suburban locales averaging high single digit amount of 90+ days while PHL now heating up into an average of low 30's per summer. This is all over no more than a 30 nautical mile distance from the airport.

Nice job of cherry-picking. Pottstown has a bad sensor and kqms is a site with a relatively low # of 90F days. Per chart below the other regional airports all trend with Philadelphia. I have excluded 2022 because of the bad sensor at Philadelphia.
You have also ignored my comment about the inconsistency in your dataset. Other sites in Chesco had the following # of 90F days last year: Phoenixville 33, Glenmoore (very close to East Nantmeal) 18, West Chester airport 19. These are in-line with the data from Coatesville posted above. East Nantmeal only had 1 90F day last year, an outlier to the other Chesco sites, and poor choice to combine with older Chesco data to determine climate trends.
-
10 hours ago, ChescoWx said:
I have made no adjustments to any analysis ever. I am a believer in climate change (it is real and constant throughout history and will continue forever) but believe this change is cyclical and not unusual. The 3 stations have been analyzed and deemed valid for analysis based on the following detailed reviews. The data set comprises only the National Weather Service COOP observations from 1888 to 1982 for Coatesville 1SW when that station moved per NWS direction to a nearby location in Coatesville beginning in 1983. That location was only 2 miles to the NW at an additional 300 ft elevation change - that station remained in use till 12/31/07. The data of both of those stations was deemed acceptable and combined by the Pennsylvania State Climate Office and is posted on their website with climatology stats using the combined 2 stations. So now we have data from 1888 through 2007 that is included in this data set.
However, the Coatesville NWS observer stopped reporting in December 2007. Without that data I was required to do a statistical analysis to determine if the daily data that had been recorded at both the Coatesville NWS observer station and my NWS spotter data in East Nantmeal for Chester County (at the same elevation ~660 ft ASL) which were taken concurrently daily from 12/1/2003 through 12/31/2007 would be found statistically the same - this is critical because if this statistical significance test had failed we would not have been able to use this data for the ongoing analysis I perform. However, based on the detailed statistical analysis performed we were able to show that both data sets are statistically one and the same based on the highly significant ( p-value results were well under 0.05 required). This detailed statistical analysis provided the support that allows us to have high confidence that the total data set being used is valid and appropriate for analysis.
Sorry for the long winded explanation (more than most folks would want) but want to ensure why we are so confident in these raw Chester County data sets.
Thanks! Paul
Lets look under the hood at your dataset. Below is chart of 90F days at the three sites you are using. Plus a table comparing the three sites with Philadelphia (non-airport prior to 1940). 100+ years ago Coatesville 1SW was often the warmest site in the Philadelphia region, with more 90F days than Philadelphia. Coatesville 1SW had cooled by the 1970s, probably due to station modernization. The two Coatesville sites are similar. I am comfortable combining them but only after 1970, when the Coatesville 1SW bias adjustments are small and can be ignored. The chart I posted earlier showed that all the Coatesville sites (1SW, 2W and Coatesville airport after 2007) and Philadelphia airport have had very similar temperature trends since 1970.
East Nantmeal has many fewer 90F days than either of the Coatesville sites. On hot summer days East Nantmeal is often the coolest site in the Philly region. Your dataset has a relatively warm site at the beginning and a cool site at the end, relative to other regional stations. Not a good basis to estimate long-term regional climate trends or to evaluate the quality of nearby stations like the Philadelphia airport.
Phila Chescowx 1894-1930 17 23 1970-81 22 13 1982-2003 29 16 2004-22 30 5 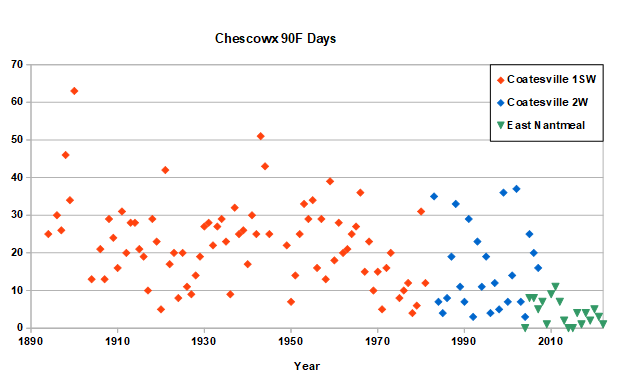
-
1
-
-
17 minutes ago, ChescoWx said:
Charlie you miss the point there is no slant or cherry picking data with my analysis....I have no incentive to skew anything I simply analyze the factual reporting of all available NWS COOP and spotter reports for a long period of time for Chester County PA. The fact is does not support the global warming hypothesis is not my problem. You never say my data is wrong....simply that it needs to be massaged. You can continue to post your adjusted pooled multi-station data for Southeast PA....and I will continue to report on what the trained observers and spotters report and report the facts both warm and cold for the available long term stations in my county.
Come on Paul, you have strong unorthodox views on climate change that skew your outlook and analysis. You complain about NOAA, but you are making huge adjustments in your own analysis. You are appending the records of three separate Chesco stations end-to-end-to-end to make a one longer record. Three stations with different elevation, latitude, sun exposure, equipment, etc. I've provided plenty of information on the dissimilarity of your stations. The data isn't wrong, but your analysis is. You have missed 3 to 5F of warming compared to other analyses.
-
1
-
-
1 hour ago, ChescoWx said:
Chubbs/Charlie follows the NOAA view of adjusting for that pesky "excess cooling" with "proper adjustments" at those Chester County Stations from 1940-1970. My data (as noted with the disclaimer in my signature below) will continue to trust the multiple NWS COOP observers and am quite confident that they all did not have faulty equipment at the same time. Just no proof of that at all! So we must continue to only analyze the actual approved NWS data validated at the time it was submitted to the NWS office. Unfortunately, for Charilie it does not support the warming story as well without that critical "excess cooling" adjustments. I would also add that the fact I simply produce the actual raw data for all of these Chester County locations without adjustment does not allow me to have any so called "confirmation bias on my part" I can't adjust the numbers for any perceived pesky excess cooling or warming as that may introduce some analyst bias which I won't ever do.
Yes, I am going to stick with NOAA over an amateur who is motivated to get an answer that differs from expert opinion.
The link below describes one source of bias in the US Coop data.
https://judithcurry.com/2015/02/22/understanding-time-of-observation-bias/
-
2
-
-
2 hours ago, ChescoWx said:
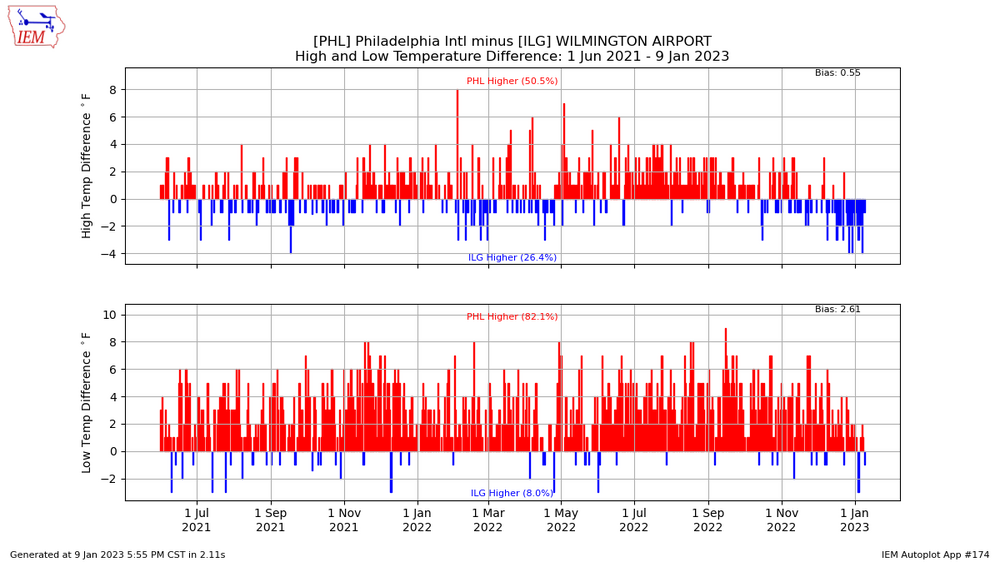
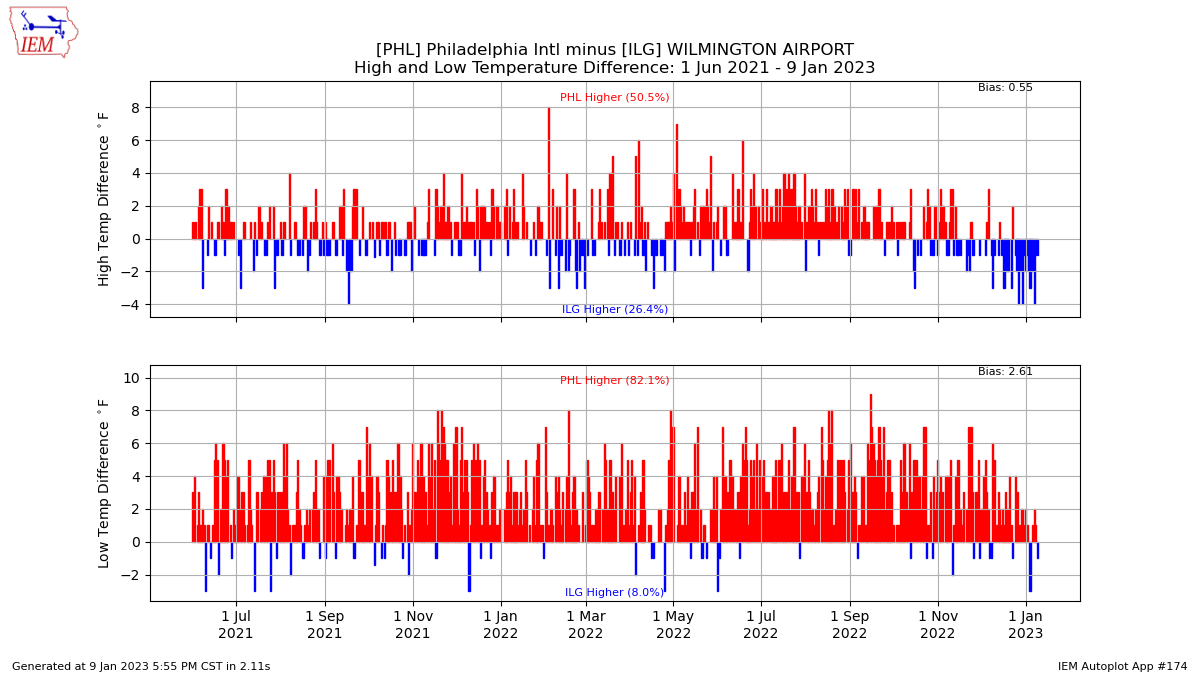
The PHL Airport Heat Island Contamination is strong.....since 1940 vs. NWS COOP reports in the western suburbs. In 2022 PHL had another year of warming while the Philly burbs were actually cooler.

Per chart below comparing Philadelphia and Wilmington airports, Philadelphia airport had a bad sensor or some other measurement issue starting at the end of 2021 and lasting most of last year. It was corrected in Dec and is now running cooler. So yes the Philadelphia airport was roughly 1F too warm last year, but not due to "heat island contamination"
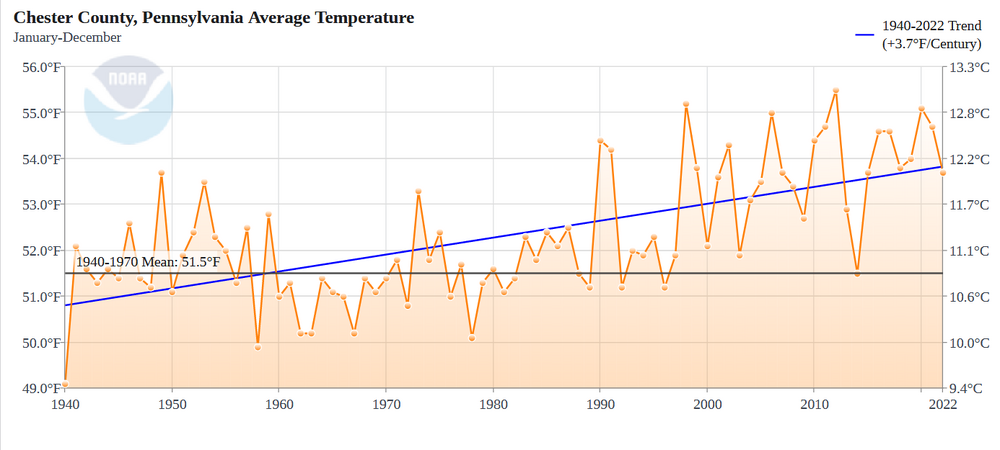
The difference between Chester County coop stations and the Philadelphia airport is mainly caused by excess cooling at several of the the coop stations between 1940 and 1970 as the stations were modernized (clearly seen in your chart). Below is the bias-adjusted data for Chester County from NOAA since 1940. When properly adjusted, the Chester County data shows considerable warming since 1940, in good agreement with the Philadelphia airport.
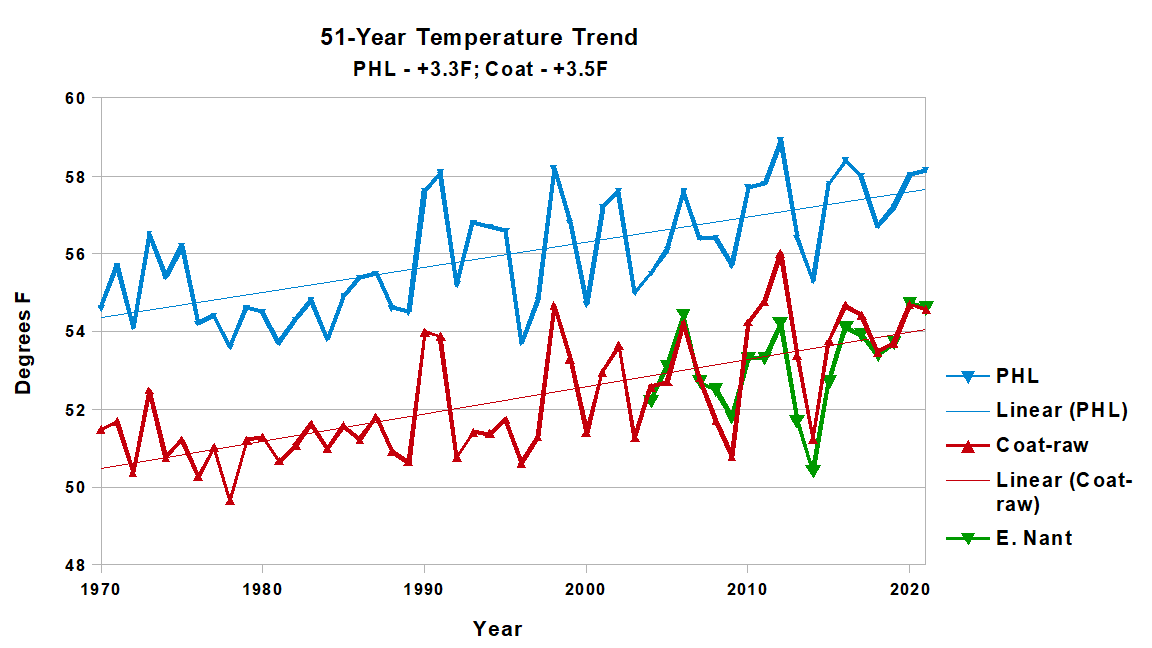
Finally you have biased the Coatesville Coop data by tacking on your own cooler house since 2004. The non-adjusted data from Coatesville by itself matches the airport very well as shown below. If you exclude 2022, with the bad airport sensor, warming since 1970 is 3.3F at Philadelphia and 3.5F at Coatesville.
What you attribute to "heat island contamination" is just poor analysis and confirmation bias on your part.
-
 1
1
-
-
1 hour ago, ChescoWx said:
Great info!! It looks like they reached their peak steel production in 1953. They are still in production today - even making some of the steel for the new WTC in NYC!
An interesting idea - and no doubt it may have contributed a bit to the warming...but since the same pattern of cyclical warming and then cooling was seen at all of the other Chester County observation locales in West Chester, Phoenixville and Devault during that 1930's through early 1950's time frame. It provides some additional support for the observations at all the chesco spots.
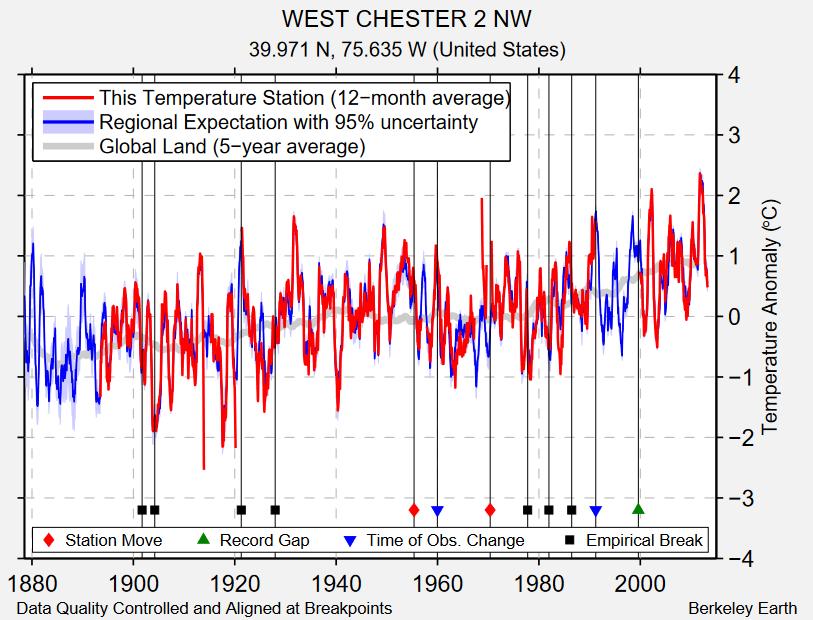
We've been over this a million times. When properly adjusted for measurement method changes over the years, the Chesco coop data shows warming. West Chester as an example below (this site only has plots through 2013), note the multiple station changes.
After 1970 the data doesn't need much adjustment. This is also the period of strongest warming. Coatesville, ENantmeal, and phl below. The "heat island" hasn't missed Chesco

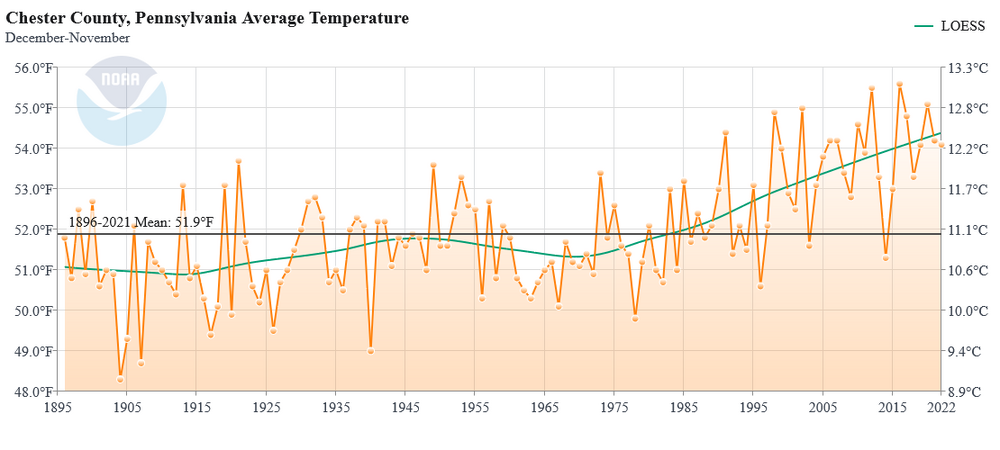
Finally NOAA's long term temperature trend for Chesco, using all the local temperature measurements.
-
3
-
 1
1
-
-
-
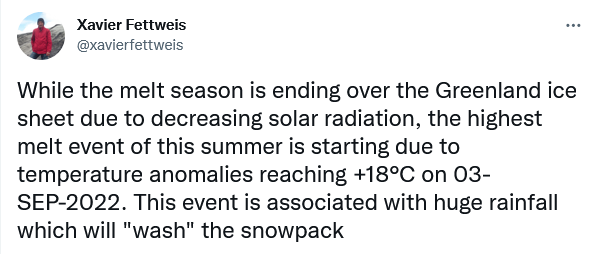
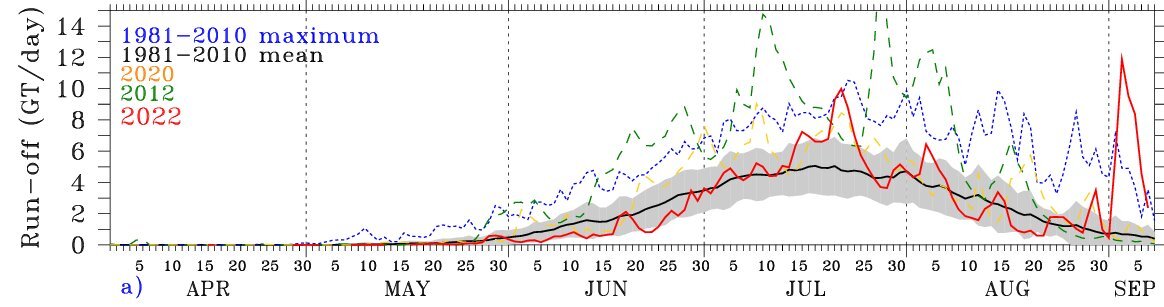
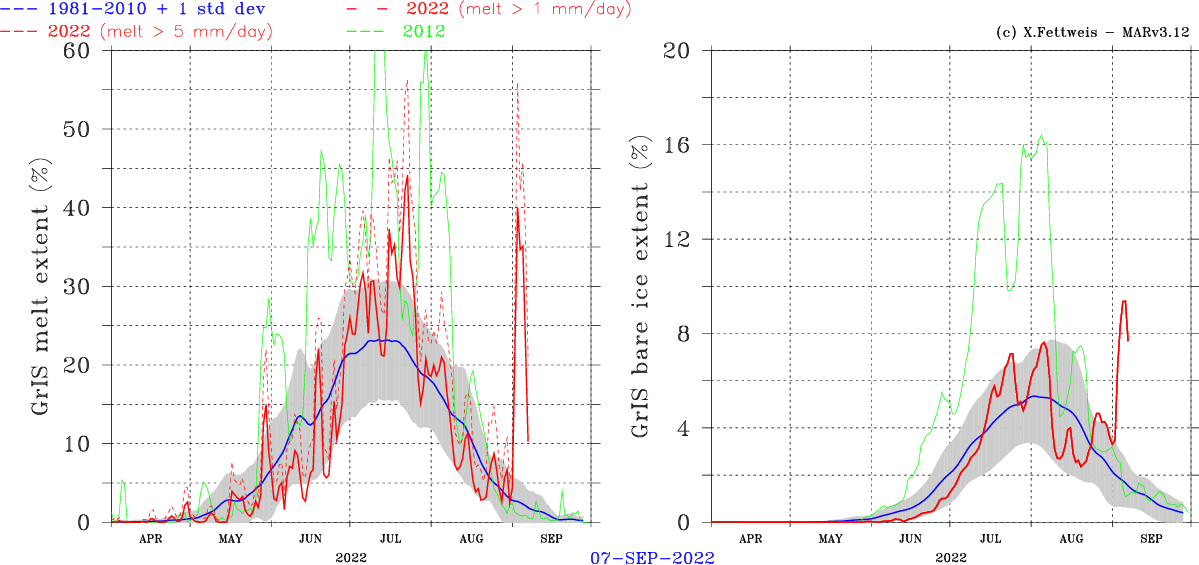
15 hours ago, NEOH said:
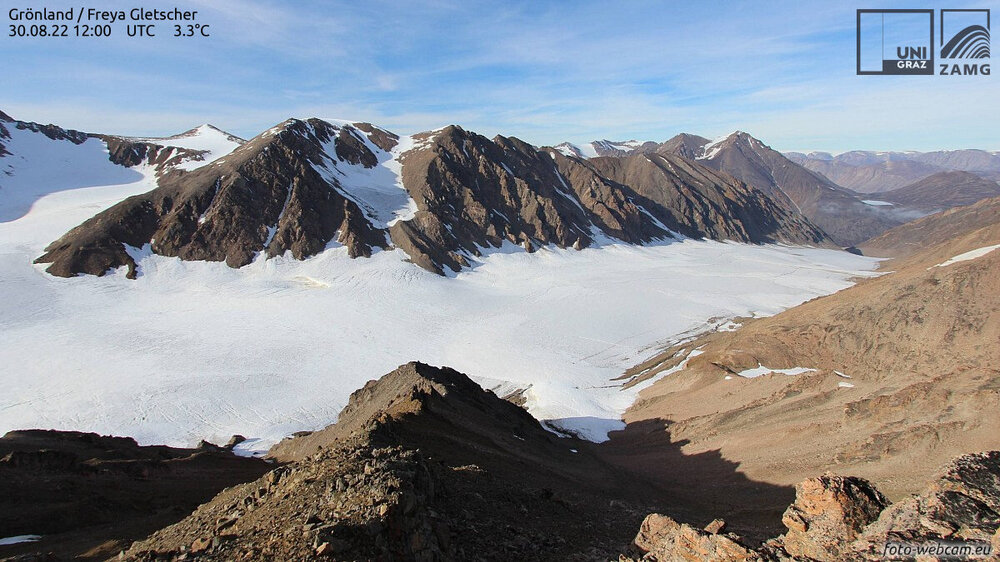
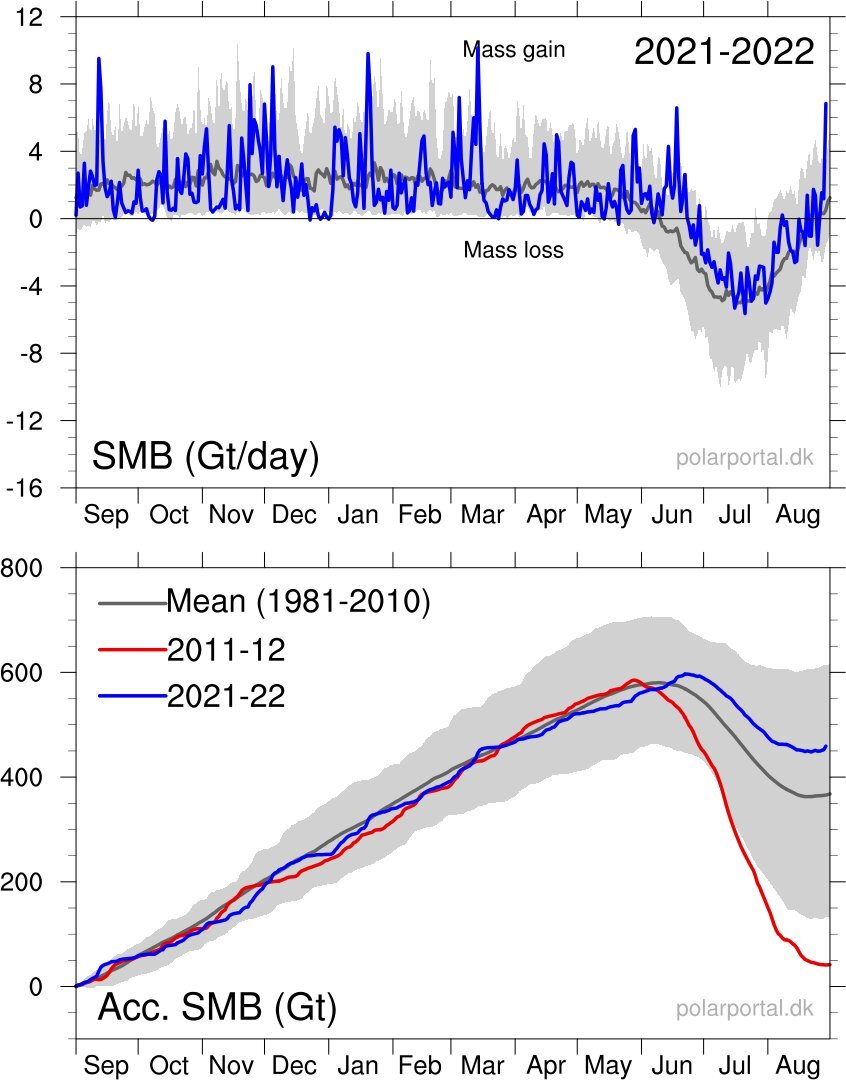
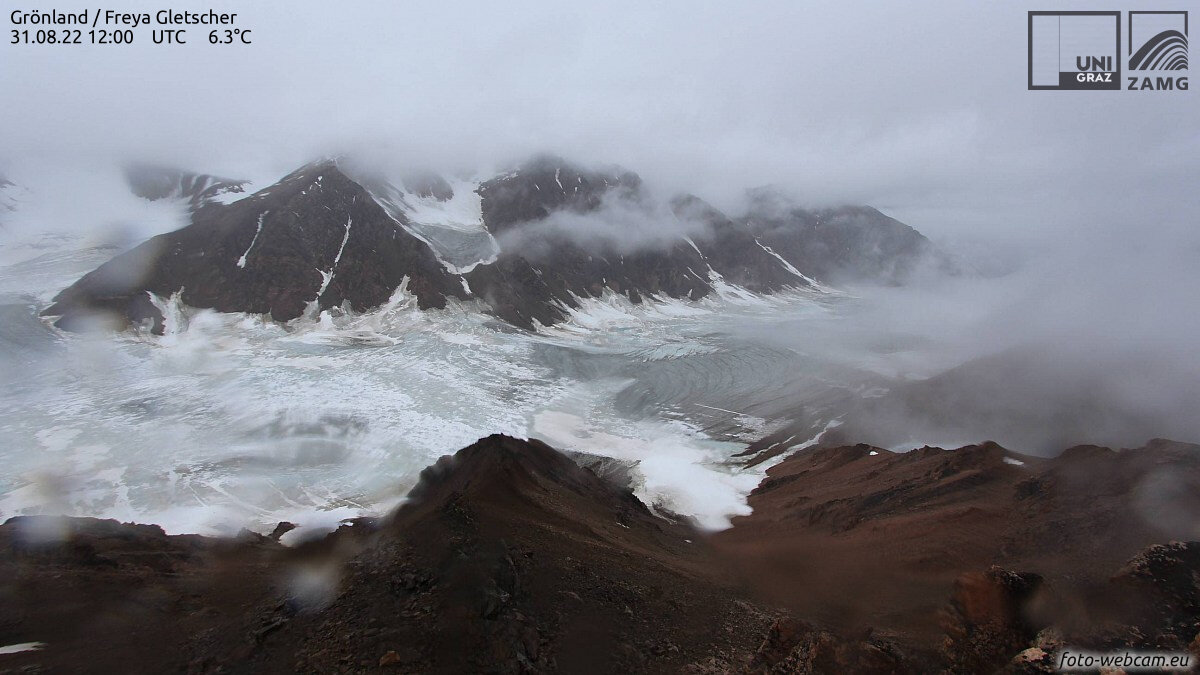
Read an article that the Greenland ice sheet gained 7 Gigatons of mass in just one day — the largest daily gain ever recorded during the summer.
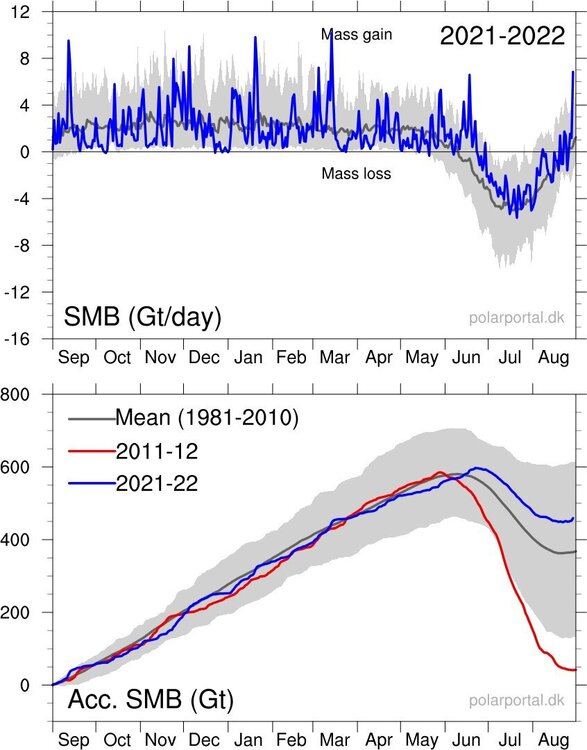
8/30 and 8/31 at Freya glacier in eastern Greenland roughly 3000'. The interesting weather continues next week with a big melt event to kick off the accumulation season.

-
1
-
-
-

.png.2fcf6fa92f389b5871aafb0bdd4a84a0.png)


worst long term prediction ever ?
in Climate Change
Posted
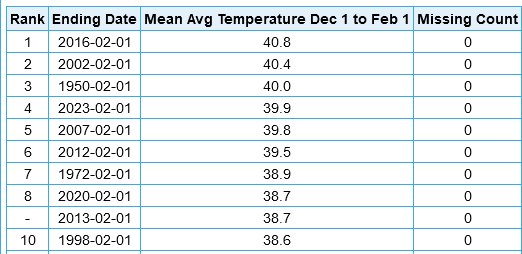
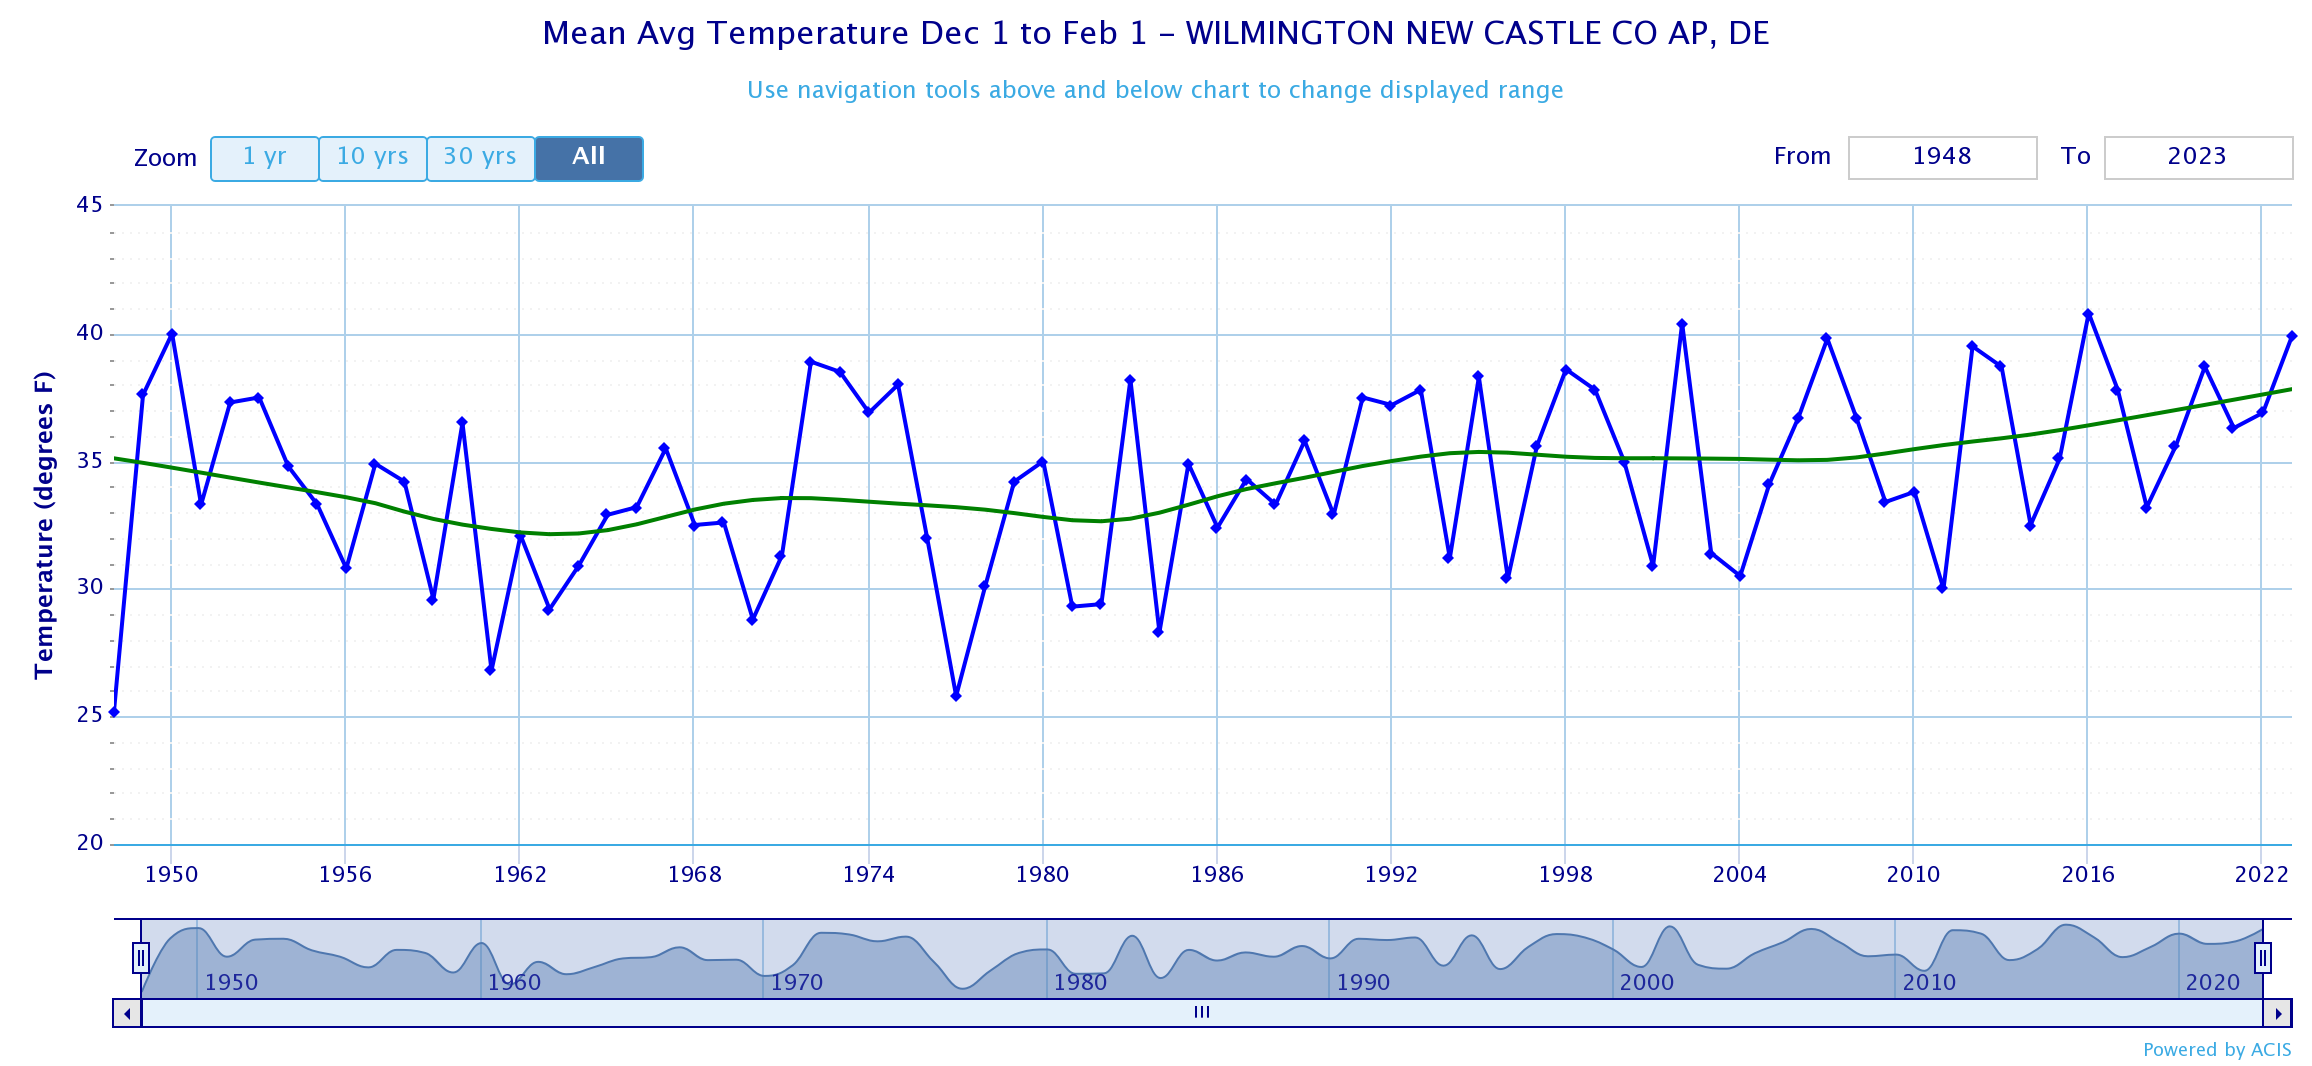
Per chart below, in the past 50 years Philadelphia has become Richmond and Coatesville (far NW burbs) has become Philadelphia. The local warming is spot on with climate science predictions from the 1970s. Locally we are having a Raleigh Durham winter, circa 1970, with both Philadelphia and Wilmington averaging close to 40F since Dec 1. A 40F winter is much more likely locally now than it was 50 years ago.
Science predictions are clear, the warming will continue until we get emissions under control. Extending the regression line, by 2039 Philadelphia will have Raleigh's climate and Coatesville will be half way to Richmond. That's why it will be very easy to see that we aren't having a cooling trend way before 2039.
Your spiel in this thread is "the climate has always changed". An effective talking point for deniers, but doesn't say anything about why climate has changed. If you don't know the cause of the current warming you can't predict the future.
Just because you don't know why climate changes doesn't mean that no one knows. Science solved this problem a long time ago. Same thing with climate predictions. Just because you aren't aware of any successful predictions, doesn't mean they don't exist. Obviously you don't want to recognize sound climate prediction. We gave you several examples and you blew them off. As my mom used to say you can lead a horse to water but you can't make him drink.