

chubbs
-
Posts
3,894 -
Joined
-
Last visited
Content Type
Profiles
Blogs
Forums
American Weather
Media Demo
Store
Gallery
Posts posted by chubbs
-
-
10 hours ago, Stormchaserchuck1 said:
Actually, just speaking from personal observation, it's the Sun.
Does higher CO2 deplete the ozone to make the sun shine brighter to ground heat?
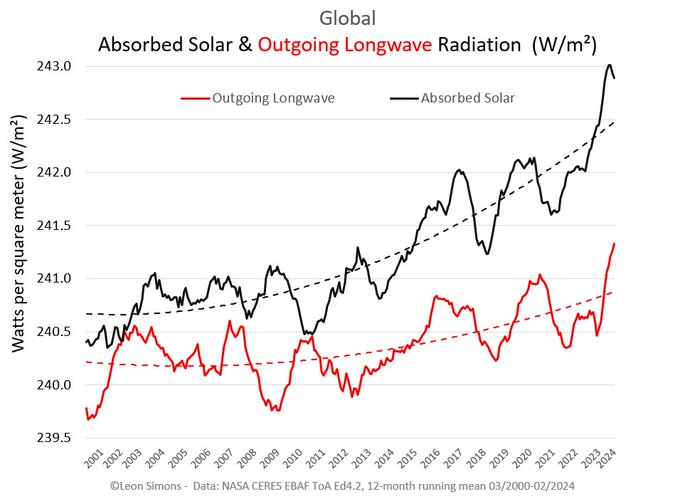
Yes it is the sun, as expected when GHG increase. In a warming world outgoing infrared radiation increases but GHG are slowing the increase so outgoing radiation can't keep up with increased absorbed solar. Why is absorbed solar increasing? - less snow and ice and fewer clouds on average as the world warms, supplemented by reduced air pollution which dims the sun. Currently there is much more energy coming into the climate system than going out; 90% of which goes into the oceans. Per the chart, absorbed solar has gone up by roughly 1% in the past 15 years. That is equivalent to turning up the sun by 1%. No wonder it is getting warmer.
-
 4
4
-
-
21 hours ago, bluewave said:
There are a few ways that a warming climate can manifest in our our weather patterns. The first way is linear by which the winters gradually become warmer and snowfall decreases. But there will still be colder and snowier winters in the mix along the way. I think this gradual shift is what most people are more familiar with. But the second way is more non-linear or threshold dependent. The climate models don’t really do well at picking out these temperature thresholds in advance. So they usually don’t become obvious until after a certain period of time has passed. It does appear that we may have crossed a temperature threshold during the 15-16 super El Niño. But we still probably need to see how winter temperatures progress through 2030 in order to know whether it was a shift or just loading the dice for warmer winters with some colder ones still mixed in.
The snowfall experience has been different for us. From 93-94 through 17-18 we saw a steady increase in snowfall. But the off seasons like 97-98, 01-02, 06-07, and 11-12 fell near the bottom of the list. So it was an all or nothing snowfall pattern and lacking the median snowfall seasons which were more common from the 60s to early 90s. While the better seasons were more frequent, we traded the median seasons for near record low seasons. Since the most recent downturn only began in 18-19 for snowfall, more time is need to know if we entered a longer term declining phase or passed a threshold where the much lower seasons replace the higher ones as the norm. In any event, the 2010s record snowfall decade would be a tough act to follow even in a more stable climate absent the warming trend.
Yes climate change doesn't have to be steady, particularly at the regional level. Our regional snowfall history is uneven so wouldn't expect a linear change. Its possible that the 2015/16 nino kicked us into a new regional winter/snowfall state. If so the current nino may kick us into another. Using global SST as an example the impact on the global climate system is just as large. Of course in the absence of a good scientific study, its also possible that our snowfall wasn't impacted by the 15/16 nino. We'll see.

-
10 minutes ago, TheClimateChanger said:
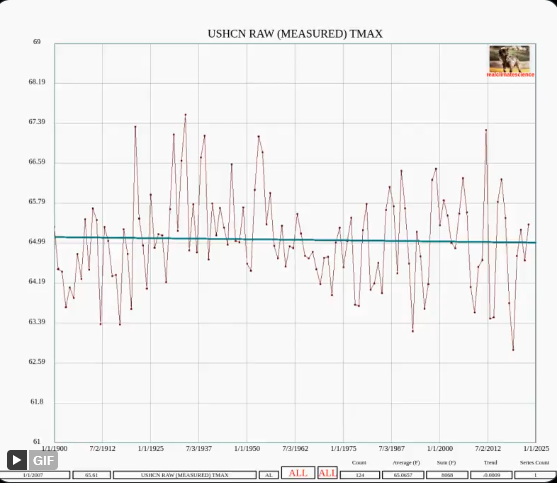
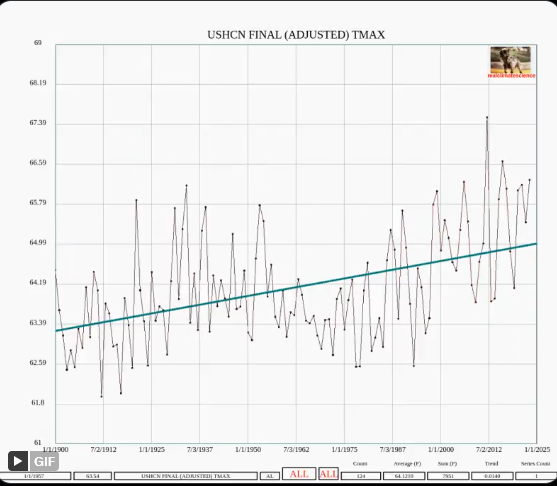
Perhaps somewhat surprisingly, based on the chart you shared, his data seems legit. But if it starts to deviate substantially from NOAA, I'm not going to believe him that there is a conspiracy to produce warming, I'm going to assume he is manipulating his readings.
Yeah his data checks out vs NOAA. Its when he puts his data together with other stations that problems arise.
-
20 minutes ago, ChescoWx said:
I keep posting the actual raw data vs the NCEI altered temperatures....can't make it much clear than that....
No, you aren't posting any actual data. Your county "average" skews the actual data by not accounting for changes in station mix. Here's some actual data - your own house is warming faster than NOAA. Are you altering temperatures? or perhaps you have a heat island in your backyard.


-
1
-
 1
1
-
-
19 hours ago, ChescoWx said:
Hmmm sounds a lot like little old Chester County PA...."Interest and concern continues to grow about the numerous retrospective adjustments that the U.K. Met Office has made to its global HadCRUT temperature database. Often the adjustments cool earlier periods going back to the 1930s and add warming in more recent times. The adjustments are of course most convenient in promoting the global warming narrative surrounding Net Zero fantasies. There is particular interest in the 0.15°C cooling inserted in the 1940s and the greater warming added in more recent decades. The scientific blog No Tricks Zone (NTZ) has recently returned to the story noting the state-controlled Met Office has “corrected” the data to “align with their narrative”.
In suggesting a narrative, NTZ traces the adjustments back to the 2009 leak of ‘Climategate’ emails from academic staff at the University of East Anglia working on the HadCRUT project. In one email speculating on ‘correcting’ sea surface temperatures to partly explain the 1940s ‘warming blip’, it is noted that “if we could reduce the ocean blip by, say, 0.15°C, then this would be significant for the global mean”. It would be good to “remove at least part of the 1940s blip”, it is suggested. Just as they have said they would do, comments NTZ, 0.15°C of warmth has gradually been removed from the 1940s HadCRUT global temperature data over the last 15 years.
Does sound like Chester County - deniers spreading misinformation. The changes to Hadcrut that are being criticized are: 1) very minor compared to the observed warming, and 2) completely justified as described in peer review papers (see blog article). You are repeating conspiracy theories we heard here a decade+ ago. They were silly then and even sillier now with no evidence of any conspiracy or technical shortcoming and warming continuing unabated.
https://diagrammonkey.wordpress.com/2024/05/26/rtfm/

-
3
-
1
-
-
On 5/25/2024 at 8:40 AM, TheClimateChanger said:
Although that post characterizes is this as one of the worst heat waves, I see no evidence of a worse heat wave in the history of Mexico. Dating back to 1975, May is currently running about 4F warmer than any previous month at Mexico City. March and April were both the warmest on record in that interval, and April had been the 3rd warmest of any month.
"In the next 10 to 15 days, the country will experience the highest temperatures ever recorded," researchers from the National Autonomous University of Mexico (UNAM) said in a statement earlier this week. They called the heat wave "unprecedented."
https://www.cbc.ca/news/world/mexico-heat-wave-1.7214308
edit -good call:
Mexico City recorded its highest-ever temperature on Saturday when thermometers hit 34.7 degrees Celsius (94.46 degrees Fahrenheit) as a deadly heatwave scorches the country.
-
3
-
-
NOAA ocean content has been updated through end of first quarter. No surprise the sharp upward trend continues. Hard to tell if there is acceleration.

-
1
-
-
4 hours ago, Typhoon Tip said:
you know I think it'd be interesting to see this curve back to 1750 ... maybe 1700. 1750 is the widely/historically noted beginning of the IR.
A couple of SST datasets go back to 1850. Some ups and downs between 1850 and the 1982 start of the satellite dataset I posted, but only a small increase. Most of the SST rise has occurred in the past 50 years and even that rise has been back-end loaded, with a couple of nino jumps in the past decade.

-
1
-
1
-
-
SST including May to-date. The fall off from the nino peak continues, but the ride down is much slower than the ride up. The fall off is In-line with past ninos so far.

-
2
-
-
1 hour ago, ChescoWx said:
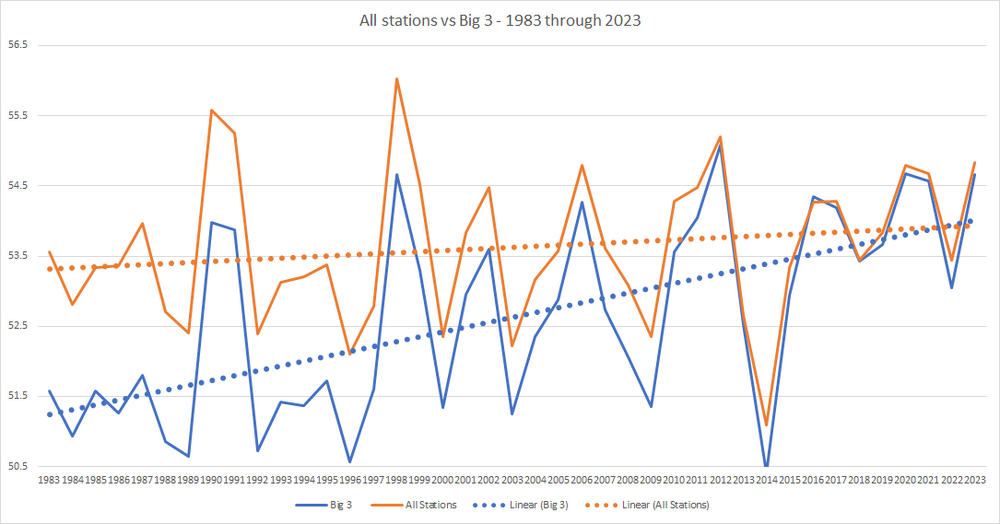
Sure which is why we would never simply use those or any 5 individual stations in doing this kind of county wide analysis. For the complete view and analysis see the all station review below laid over those 3 newer stations with the most warming. We start with 1983 when the newest station Coatesville 2W came on line. As we would expect since much of the last 40 years are part of the current warming cycle the all station data shows some warming albeit very slight and nothing alarming.
You are completely missing the point. That's just another example of how the county average you are producing doesn't match the individual station data.
-
On 5/18/2024 at 10:15 AM, ChescoWx said:
We have accounted for both the East Zone 102 with 12 of the 17 historical/current stations at the lower elevations typical of this zone. While we have 8 of the 9 stations in the West Zone 101 at the higher elevations typical of this NWS zone splits.
So let's look at how the annual average temperature (raw and of course not adjusted) has run from 1893 to 2023. (blue lower / orange higher) Does anyone see a climate crisis in these annual average temperatures in Chester County PA? A mighty cyclical and relatively flat trend for sure!
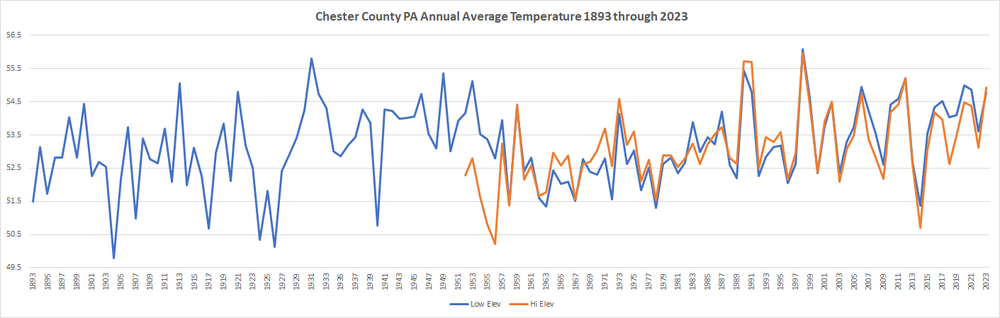
As usual you aren't addressing the issue. The station network has shifted north and west to higher and colder locations. Whether you acknowledge or not, the facts are clear from your station list. Even if station locations weren't shifting. Your analysis method of simply averaging station data skews the results. Stations can differ for a variety of reasons: sun exposure, degree of urbanization, vegetation, terrain slopes, etc. In any climate analysis of weather station data, differences between stations needs to be accounted for to remove station mix effects. You aren't doing it, so you are getting the wrong answer.
The elevated group is a good example of the bias you are building in. I have data for 5 of the 7 stations. The other 2 only started in 2014 so don't have a big influence. Below is a plot showing linear temperature trends at the 5 individual stations and the linear trend for the 5-station average. Easy to see that simply averaging the raw data for these 5 stations biases the result. The 2 older stations, Glenmoore and Honey Brook, are warmer than the newer stations, Coatesville 2W, East Nantmeal and KMQS. This can be seen by comparing periods when one or more old and new stations are both in operation.
All 5 stations have warming trends, with the most rapid warming in the three newer stations, which are warming as fast or faster than NOAA. Yet because they are cooler than the older stations, the 3 new stations cool the 5-station average when they start operation and enter the dataset. As a result the trend-line of the average of the 5 stations is completely flat. Despite the fact that temperatures are increasing at every single station.
The relatively flat lines or lack of warming that you are getting is merely an artifact of the analysis method and doesn't reflect the underlying data. You aren't producing any evidence about Chester County's climate, NOAA, or the Philadelphia Airport. Instead you showing how to introduce bias in the analysis of weather station data, i.e., how not to analyze data.

-
1
-
-
13 hours ago, ChescoWx said:
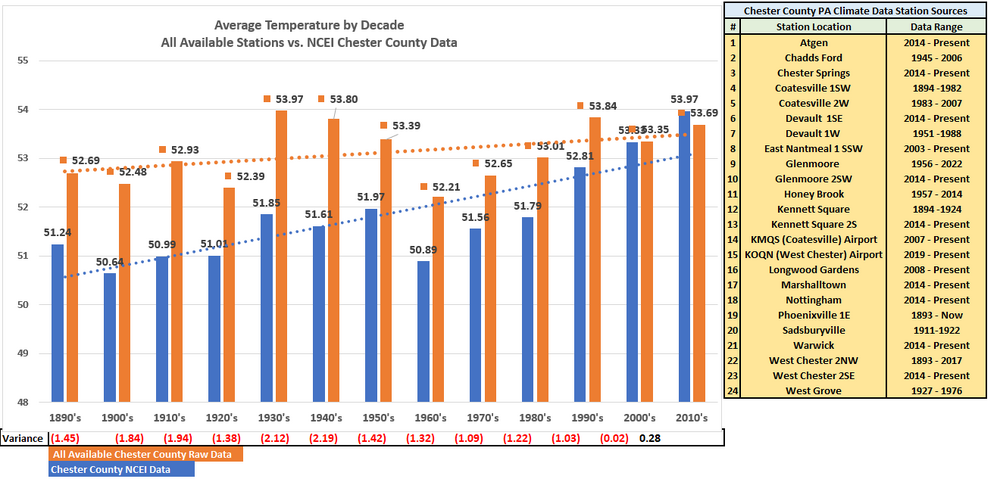
LOL!! "quality sites" meaning those that disagree with your NWS Climate sites including both PHL and ILG Heat Island impacted stations and of course add in those after the fact chilling adjustments to the past and warming tweaks to the current data. Quite the different look from the above for Chester County if we don't make warming adjustments to the actual current data. Regarding the sites in more detail yes there was as a % more lower elevation sites in the past....which likely skewed those results too warm...even though they were in fact the warmest decades. The good news is we now have a good balance and mix that as long as we keep breaking it out by elevation will clearly show the non-adjusted factual real world warming or cooling depending on the current climate change cycle.
You are giving us the Tony Heller denial explanation: Urban Heat Island, bias adjustment, blah, blah, blah.
Why would the heat island effects at Philadelphia, Atlantic City, Wilmington and Allentown all be the same? Seems very unlikely. The airports are all different, with different levels of urbanization and airport growth. And you have zero evidence to support your UHI assertion. Even more unlikely the bias adjustments for Chester County are the same as the UHI impacts at the regional airports. But wait there is more. The raw temperature measured at Coatesville and East Nantmeal (Chescowx) agree with the airports and NOAA. Whats the problem in your own data? Urban heat Island or is it bias adjustment?
No there's a much simpler explanation. Chesco is warming and your latest data concoction is way off. The reason is in your comment Regarding the sites in more detail yes there was as a % more lower elevation sites in the past....which likely skewed those results too warm Finally there is something we can agree on. But its more than elevation. As outlined above multiple factors have skewed your station mix.

-
1
-
-
13 hours ago, ChescoWx said:
This was already addressed the east and west is not as critical as the elevation above sea level which we have already detailed in the above post with those splits. There are of course today...consistent with the older data more stations at the relatively lower elevations. Not at the higher elevations. We will of course be analyzing data that reviews the data individually at both the relative higher and lower elevation locales to account for any variables due to these elevations.
Wow that's lame. West and east aren't critical? Where's the evidence? That's not what your website says: “The National Weather Service split out this zone (PAZ101) from the lower elevations seen across most of Eastern Chester County (PAZ102) a few years ago to better distinguish the climate differences attributed to relative elevation and more inland location from the Atlantic Ocean.” Temperature is a variable that isn't impacted by elevation? Are you kidding? And you completely overlooked north in your comment. Are you denying that north, west and elevated are colder in Chester County?
Finally as I showed above your elevation split is inadequate to remove bias. The new 550+ stations added after 2000 have many fewer 90+ days than the pre-2000 stations.There are other factors besides elevation which impact the station temperatures and skew the results. Without properly accounting for station differences you are cooking the books. You assertions are to the contrary are worthless without evidence.
-
1
-
 1
1
-
-
20 hours ago, Stebo said:
NWS data is all that matters.
The NWS climate sites (abe=Allentown, ilg=Wilmington, acy=Atlantic City) in our area all show warming similar NOAA Chesco and the Philadelphia Airport. We don't have quality sites that differ from NOAA in recent decades. Another indication that he is way off.

-
2
-
-
20 hours ago, ChescoWx said:
Again Charlie has an answer to his question "Why are they cooler?" His answer is that they are further N+W, higher elevation. Again let's go to the facts for the truth.
According to the NWS Mount Holly CWA forecast zones - of the current 16 stations reporting 9 of them are in the Eastern Zone of Chester County and only 7 are in the Western Zone. So they are in fact NOT more located to the N and W. So now how does the elevation look at these stations? Well in fact 11 of them are at lower elevations below 465 feet ASL while only 5 are located at greater than 525 feet ASL. So there are actually more at lower than higher elevations. Facts over feelings as always!
Your "facts" don't address my criticism. I said the station mix is CHANGING WITH TIME. You didn't mention time above. I posted the table below many pages ago and you have been ducking the station mix issue ever since, despite having multiple opportunities to respond. This isn't a complicated point. The station mix is shifting N+W and to higher elevation with time. Compare 1930-52. There are many more stations north of the Turnpike, 6 vs 1, and above 550', 5 vs 0, now vs 1930-52. Also fewer south and east on a % basis. Makes sense population has been steadily N and W in the County, out of the older valley towns.

-
1
-
-
9 hours ago, ChescoWx said:
As always Charlie you are just not seeming to understand or comprehend the actual depth and breath of real world data we are now showing here. Let's review again - There is no such thing as a ChescoWX data set you keep talking about in the data we are reviewing here. There are of course not simply 2 Coatesville COOP sites and "Paul's House" in the data set!! The data set we are looking at includes at least 27 National Weather Service COOP/AWOS and MADIS sites in the historical data set between 1894 and Today. Including in the current data set here in 2024 an active 16 currently reporting NWS/AWOS and MADIS reporting sites in the current data. Charlie just to put a a fine point on this so you understand. The Chester County PA data we present here is far from what you call the ChescoWX data which only includes 3 stations....it is a robust 27 stations across more than 130 years of NWS Data. Is this getting clearer for you?? As we yet again showed you the actual Chester County PA data is far from "in good agreement" with the PHL UHI Airport data and of course as you see is not "warming strongly since 1970" in Chester County. This is not that difficult Charlie!!
Love the little dig at the end. It isn't difficult to figure out what you are doing: bad analysis to fit your worldview. More data is not better for long-term climate analysis if it isn't consistent. That is what you don't understand about NOAA. They take great care to remove as much inconsistency as possible, to make data taken 100+years ago as consistent with the data taken today as possible.
Your 27 station network, on-the-other-hand, is very inconsistent in its make-up. The station population changes with time, as old stations drop out and new ones are added. Most of the 27 stations are recent, mainly from the Deos Network, with short data records; so they don't provide any climate information. They are however cooler as a whole than the Coop stations that make up the historic Chesco data. Why are they cooler? They are further N+W, higher elevation, and located primarily in parks instead of backyards. In this case "more" stations is degrading local climate information. As I showed above, all you are showing with your plots is the effect of changing station mix. The 3-station Coatesville/ENant data is much more consistent than your 27 station network and hence provides a more accurate picture of our climate.
Once again you have fallen in love with an answer that fits your worldview. So much so that the Chescowx data posted on your website, as representative of Chesco's climate, is tossed aside. Just like the winter "weenies" on this board fall in love with a 10-day snowfall map. Very easy for me, and others, to see the bias you are introducing in your new Chesco analysis. Its the same bias you've exhibited for a decade or more.
-
2
-
1
-
-
The Philadelphia Airport, NOAA Chesco and Paul's own Chescowx series are all in very good agreement on the local warming since 1970. Chescowx is 2 Coatesville COOP stations and Paul's house (since 2004). The other NWS climate sites in our area are also in good agreement (Atlantic City, Allentown and Wilmington). It has warmed strongly in our area since 1970 and high quality datasets show it.
Paul you are wasting our time by repeating essentially the same chart over and over again. Yes, we know you don't know how to analyze weather station data and that you are unaware of your own bias.

-
3
-
2
-
-
-
7 hours ago, LibertyBell said:
I would love it to be hot but it's not been hot.
I measure heat by number of 90 degree days. I've had my heat running this entire month and it really sucks.
Spring temp ranking in the Northeast thru Sunday. Warmest ever in WPa and WV, mainly top 5 elsewhere.

-
2
-
1
-
-
-
GISS was another record in April. Probably, getting close to a peak in the 12-month average, May is the last month with before temperatures surged last year. In hindsight the 2015-16 nino kicked us into a new global temperature range. Guessing this nino will also, but we will see. This nino is weaker than 2015./16.

-
2
-
-
2 hours ago, chubbs said:
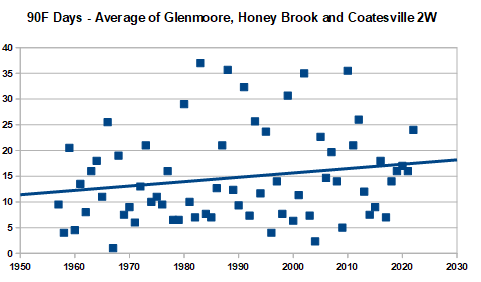
Sorry Paul, your handwaving isn't convincing, The three stations averaged (Glenmoore, Honey Brook and Coatesville 2W) have a clear uptrend, supporting my previous statement. The high elevation stations the coop data doesn't support the results you obtain. We also have the data from Phoenixville and West Chester that show 100+ year uptrends.
I didn't discuss Coatesville 1SW, as its not a high elevation station, but now that you have brought it up. The high number of 90F days in the early portion of its record are not supported by other coop sites. A good argument for bias correction.
-
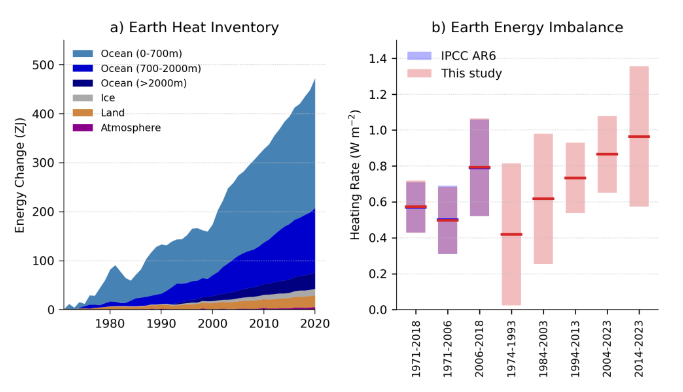
Annual update to IPCC indicators through 2023. Heat balance chart below. Not surprisingly estimated budgets for 1.5, 1.7 and 2C continue to shrink. Honga Tonga is assessed to have a minimal effect on volcanic forcing (water and sulfur cancel).
The indicators show that, for the 2014–2023 decade average, observed warming was 1.19 [1.06 to 1.30] °C, of which 1.19 [1.0 to 1.4] °C was human-induced. For the single year average, human-induced warming reached 1.31 [1.1 to 1.7] °C in 2023 relative to 1850–1900. This is below the 2023 observed record of 1.43 [1.32 to 1.53] °C, indicating a substantial contribution of internal variability in the 2023 record. Human-induced warming has been increasing at rate that is unprecedented in the instrumental record, reaching 0.26 [0.2–0.4] °C per decade over 2014–2023. This high rate of warming is caused by a combination of greenhouse gas emissions being at an all-time high of 54 ± 5.4 GtCO2e per year over the last decade, as well as reductions in the strength of aerosol cooling. Despite this, there is evidence that the rate of increase in CO2 emissions over the last decade has slowed compared to the 2000s, and depending on societal choices, a continued series of these annual updates over the critical 2020s decade could track a change of direction for some of the indicators presented here.
https://essd.copernicus.org/preprints/essd-2024-149/
-
20 hours ago, ChescoWx said:
This is not difficult Charlie the bias in the overall Chesco data is as of the last couple years now actually biased to the warmer lower elevation locales not the higher! In 2023 there are 11 lower elevation spots vs 6 higher. This is why we now have split the data to account for such biases.
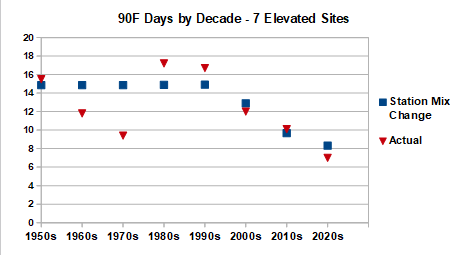
Apparently it is difficult for you to detect bias in your own analysis. The station additions after 2000 have fewer 90F days than the stations that make up your network before 2000 (see Table below). That fact biases the results. Its easy to get a rough estimate of the impact of station mix change by holding 90F days constant at each stations average level for each year the station was active. If there was no station mix bias you would get a flat trend with time since each station is being held constant.
Per chart below, station mix changes after 2000 have a large impact. The changes in station mix alone would drop the number of 90F days from around 15 between the 1950s and 1990s to a little over 8 in the 2020s. As I expected, the changing station mix is driving your results not climate trends. You should repeat this analysis with the low elevation stations. Just looking at the low elevation station results for 2023, the same station mix problem appears to be present.
Of course stations are always changing as old ones drop out and new ones start up. NOAA and other experts have developed methods to account for station mix changes. If you don't employ the proper methods your results will be biased. Doubly important to follow proven methods if you aren't aware of your own bias.

-
1
-


Occasional Thoughts on Climate Change
in Climate Change
Posted
Per a recent Brian Brettschneider tweet, winter was the warmest ever in the US and Spring was 5'th warmest through May 29.