

chubbs
-
Posts
3,908 -
Joined
-
Last visited
Content Type
Profiles
Blogs
Forums
American Weather
Media Demo
Store
Gallery
Posts posted by chubbs
-
-
Must be 2 Northeast Philly Airports

-
 1
1
-
-
9 hours ago, Prismshine Productions said:
Funny enough, the arctic currently has the same extent as it did on Valentines Day 2023, so we a few weeks up this year
Sent from my SM-S146VL using Tapatalk
Good blog article. One thing that interested me is the differences in timing between Arctic and Antarctic. Hints of a see-saw, with the Antarctic having the bigger losses recently.
-
 2
2
-
-
-
Roundy is providing a qualitative argument. I would need to see his argument developed further with quantification to give it some credence. I haven't seen any detailed analysis that indicates that enso has had any effect beyond the short-term, 0 to 3 years. There is plenty of evidence that warming has accelerated since the end of the hiatus independent of enso, not surprising since the rate of forcing has accelerated a bit also due to aerosol reductions. That said we need to wait a bit to understand the ramification of the current nino. Need to run enough clock to erase this nino's memory. Don't think we will have to wait long. This nino will probably be a faded memory by next winter, completely erased in two years.
-
2
-
-
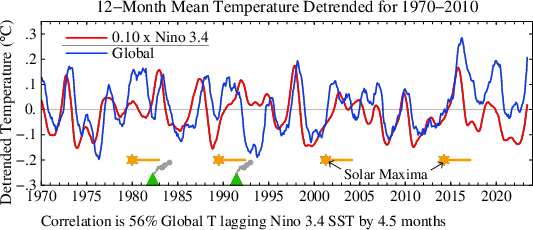
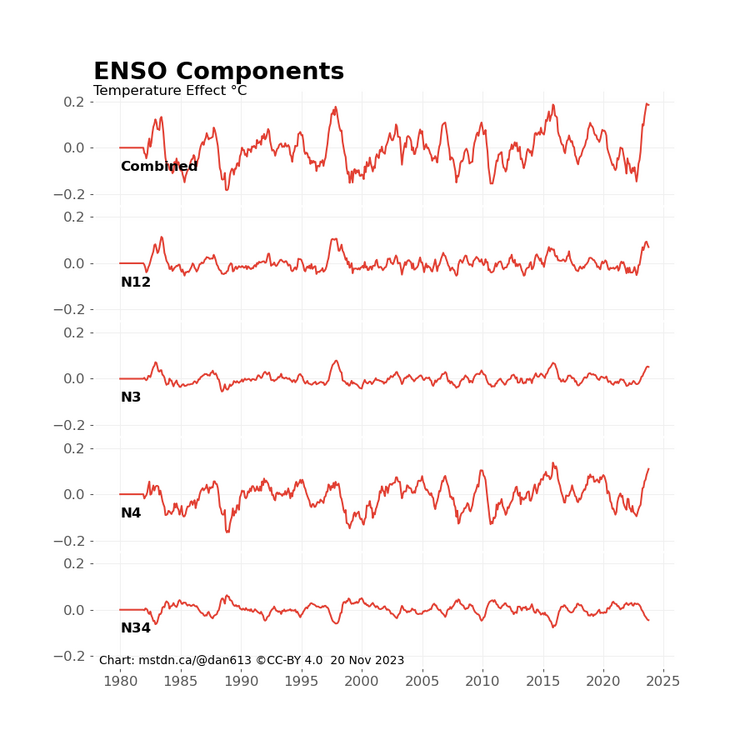
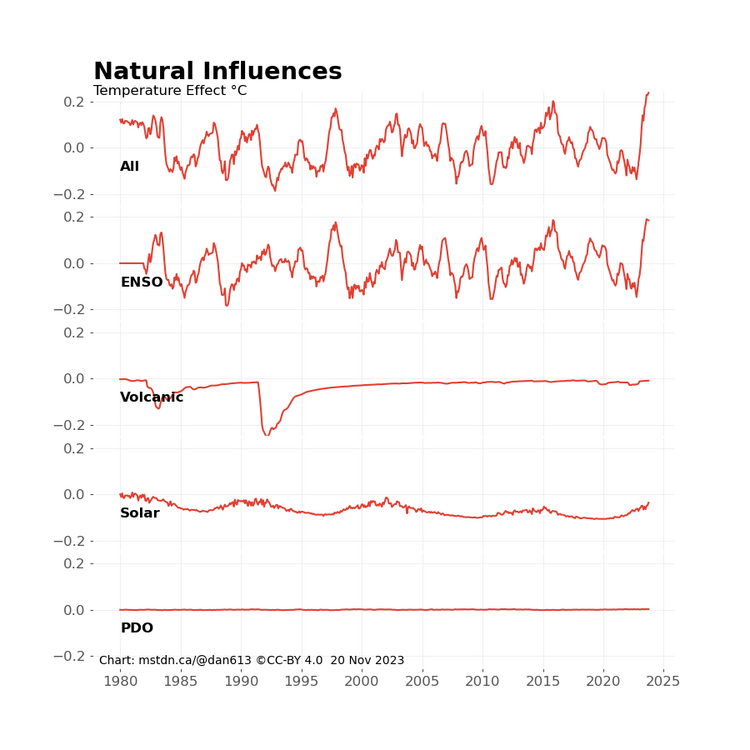
17 hours ago, bluewave said:
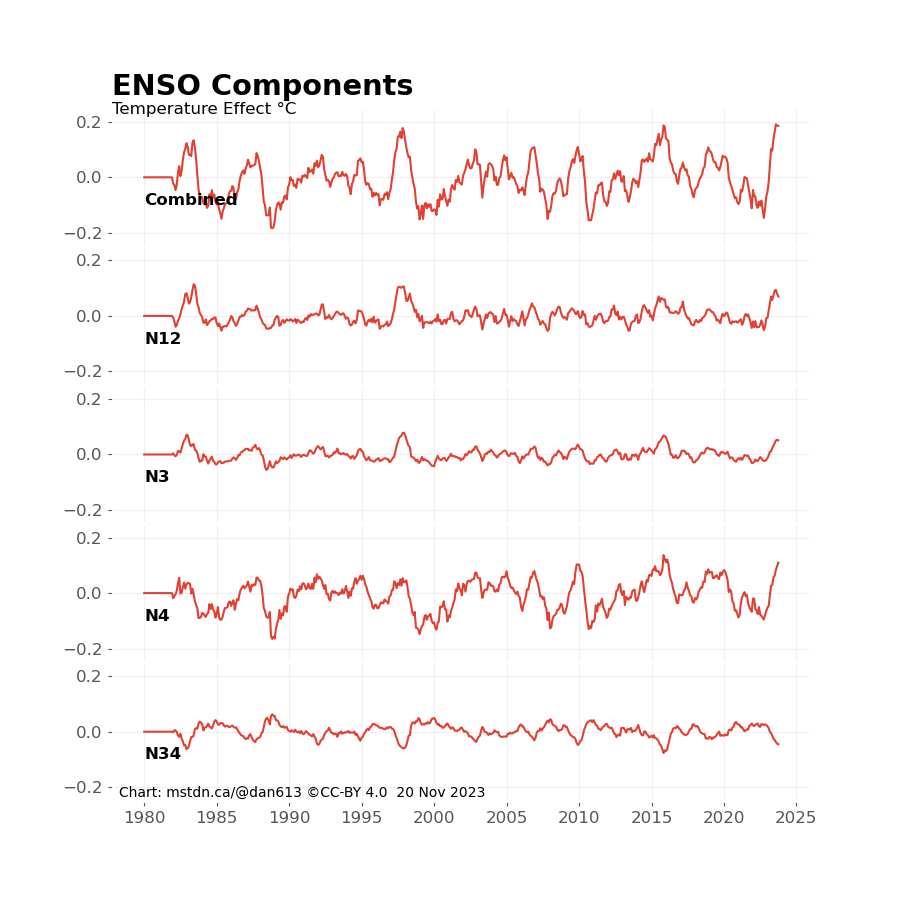
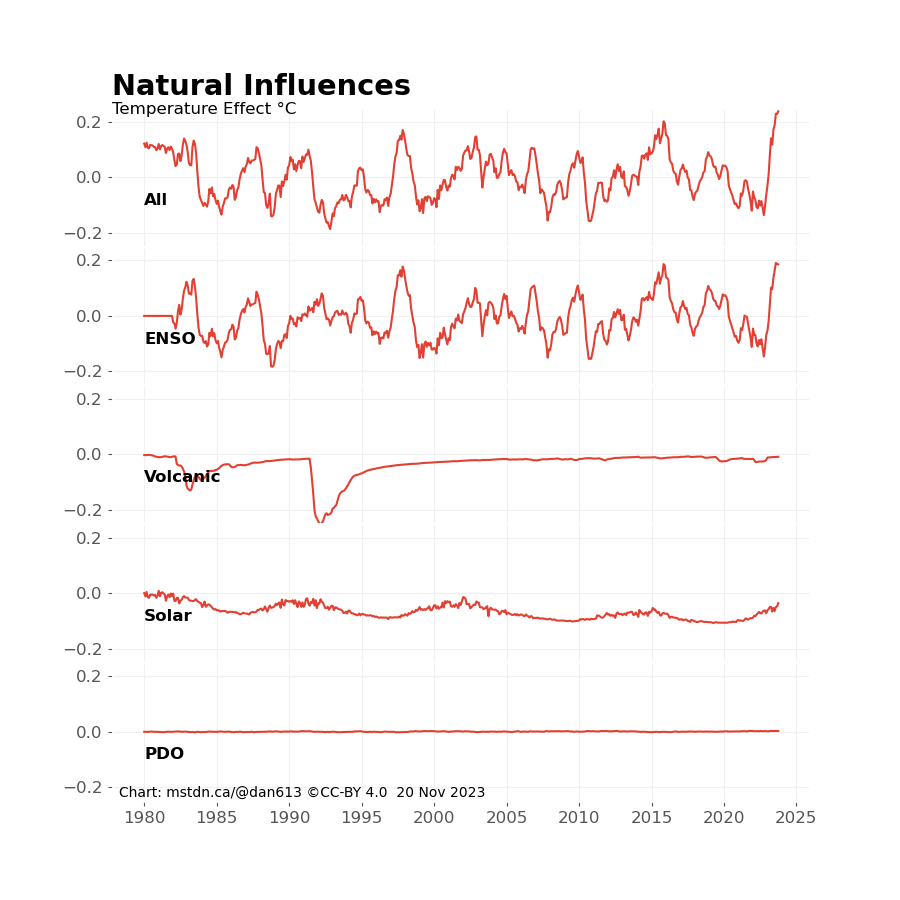
If you look at all the enso regions, this year doesn't look as unusual and enso can explain more of the warming. Charts from blog article I posted above, that looked at temperatures through October. Nice job by an amateur.
https://dmn613.wordpress.com/2023/11/20/more-details-on-sep-oct/
-
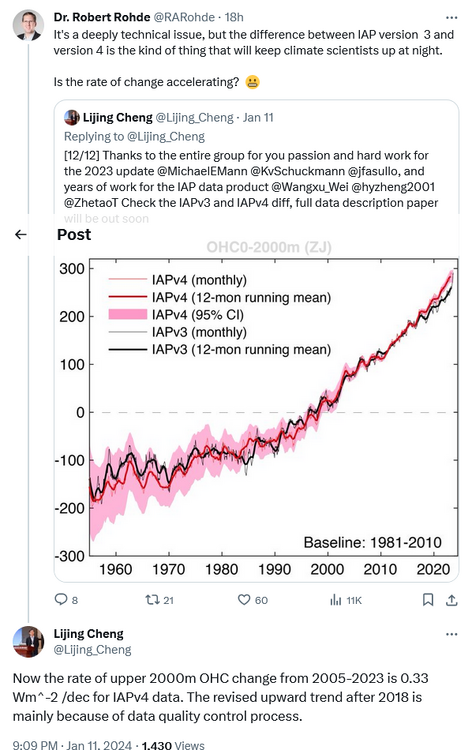
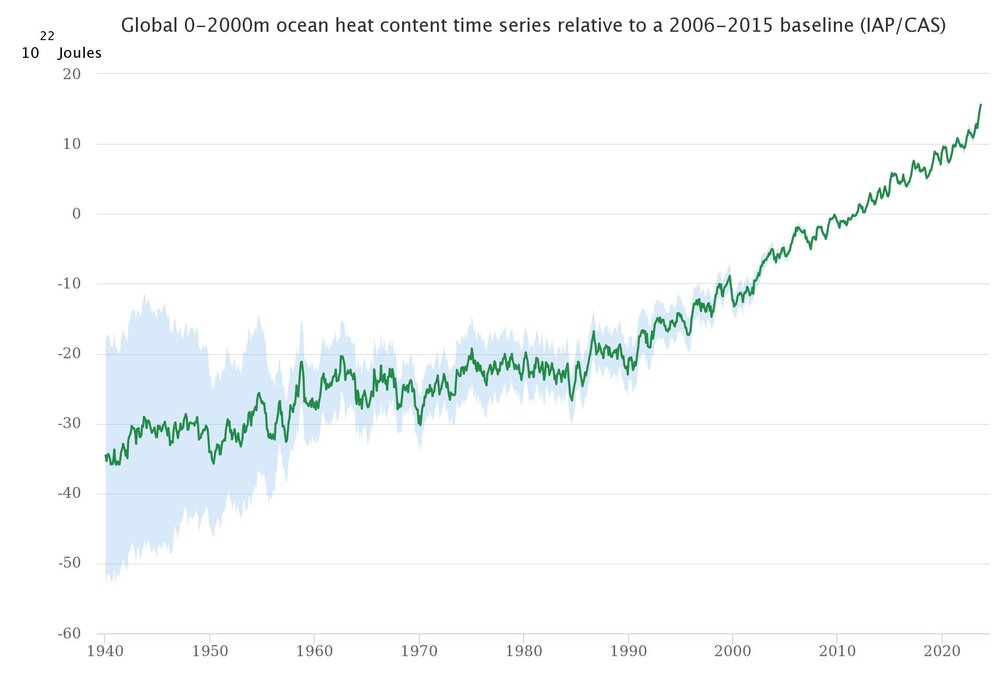
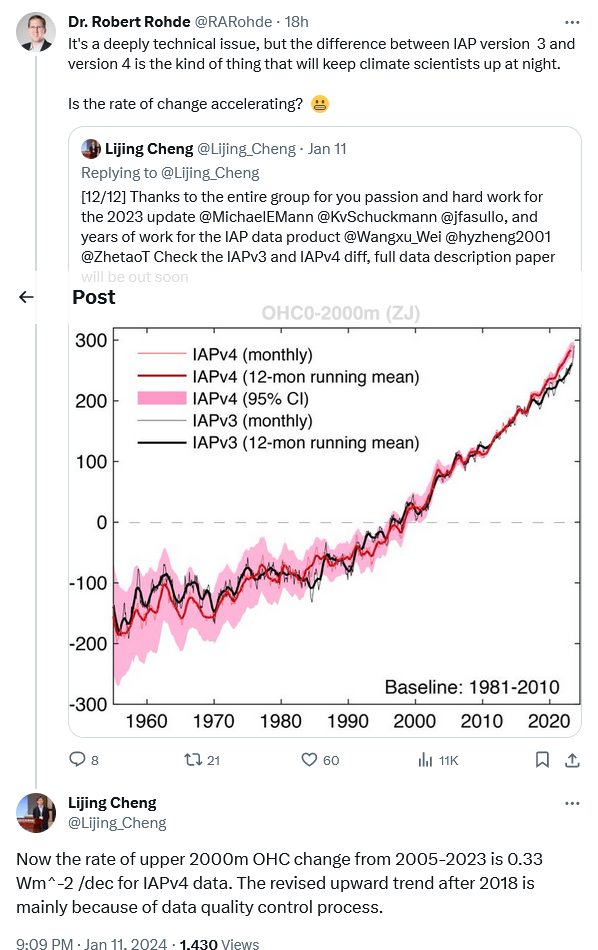
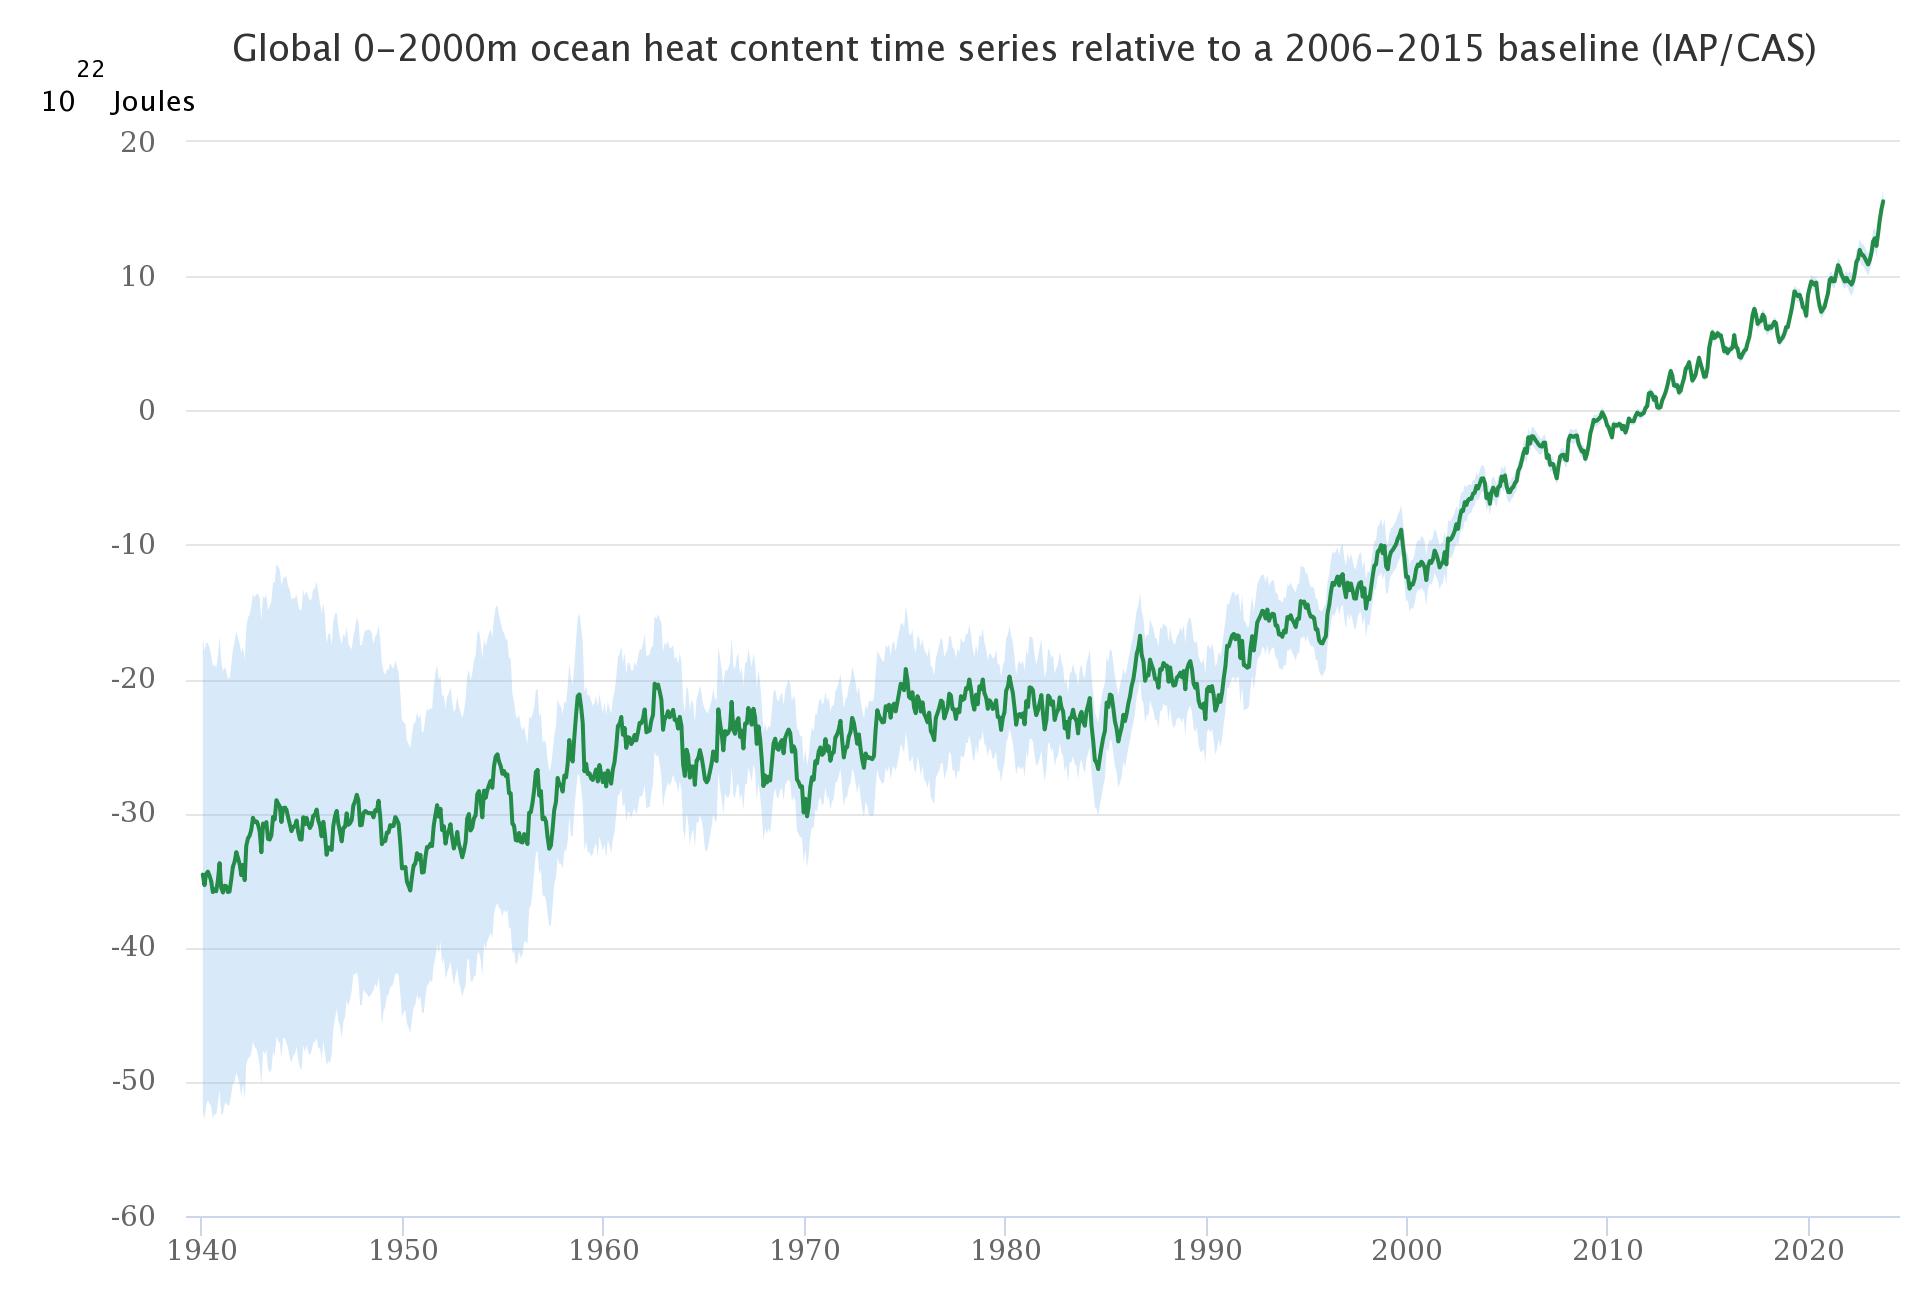
Ocean heat data is out for 2023. Overall the data is similar to recent years. The oceans continue to warm at a steady clip. Found this twitter exchange interesting. There is considerable uncertainty in short-term trends making it hard to determine how much acceleration is occurring.
https://link.springer.com/article/10.1007/s00376-024-3378-5
-
2
-
-
19 minutes ago, LibertyBell said:
Thanks, so is it your estimate that we'll peak around +2.0C and not get to +2.5C (maybe we'll peak between +2.2C and +2.3C?) I wonder how much of a lag effect there is between emissions peak and global temperate peak?
Let me put it this way. I believe it is possible to peak around 2C without hurting the economy but we will need to pick up the pace of global policy implementation.
Temperatures are proportional to cumulative CO2 emissions. To stop warming, net emissions must go to zero, hence net zero is the goal. If we cut emissions in half the warming rate will drop by roughly 50%. Because emissions are cumulative it is much better to reduce emissions today than 10 years from now. That's the problem, we've procrastinated so long our options are more limited.
-
 1
1
-
-
3 hours ago, LibertyBell said:
so is this more of a case of capitalism winning or regulations finally having an effect?
also, does this apply to us only? what about nations like China and India, aren't they increasing the usage of coal?
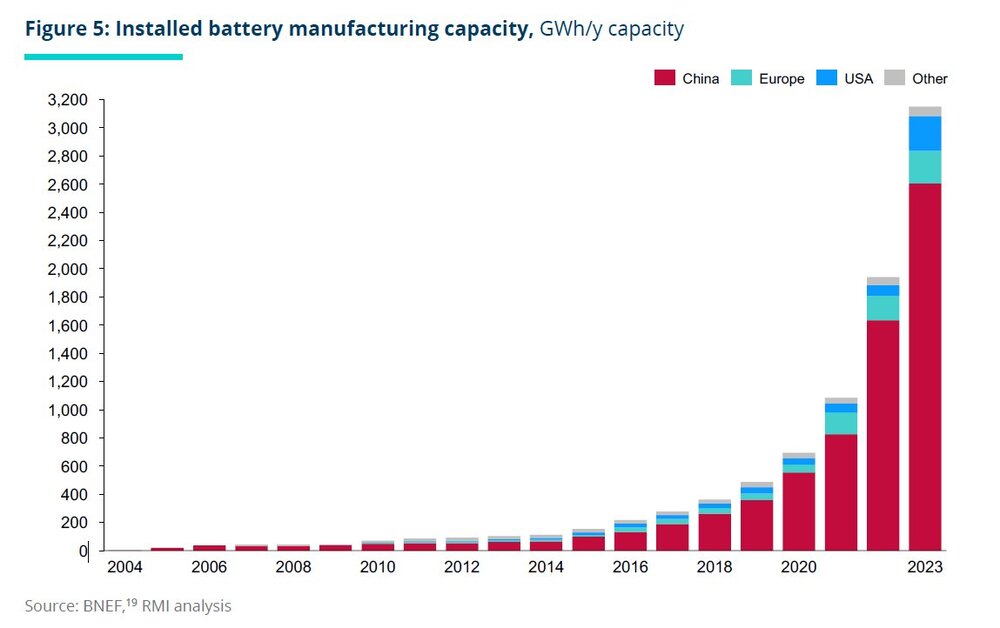
You are asking some complicated questions. I can only give a brief response. It has taken decades of government support to allow solar/wind/EV to compete in the marketplace. However capitalism can claim some credit also. Pushing these technologies into the marketplace, where they were able to learn by doing, before they were competitive was key for their development.
Its complicated to compare countries at different stages of development. Europe and the US are de-industrializing so its easier to reduce emissions. We have exported our emissions to the countries that supply our imports. China is closer to peaking emissions than India due to heavy investment and government policies supporting solar/EV/batteries etc.. While China has been building coal plants, coal use isn't increasing very fast as newer plants often just replace old in-efficient plants.
Solar/batteries/EV have become big commercial successes in China. China dominates world production both for internal use and export. Recently these technologies have made up a large fraction of China's export growth. The IRA program adopted by the US last year is our attempt to catch up. Already IRA has spurred big investment in the US, more than doubling US manufacturing investment. Big investments around world, spurred by government policy, is why emissions are likely to peak this decade.
-
2
-
-
2 hours ago, LibertyBell said:
This is a vicious circle feedback effect, so I do agree with him that 1.5C has for all intents and purposes been breached and 2.0C isn't far behind.
Agree on the 1.5C, we are not acting fast enough. Note that even if Hanson is wrong about climate sensitivity, some acceleration in warming is expected because forcing is increasing at a faster rate as aerosols are reduced. The only way to slow down warming is to reduce CO2+CH4 emissions, fortunately there is some hope of peaking and starting to turn down emissions this decade as fossil fuels continue to lose competitive advantage and the need to do more slowly gains proponents.
-
1
-
-
On 1/5/2024 at 8:45 AM, bdgwx said:
I am going to go ahead and kick this off with Hansen's latest monthly update. What he is saying is that the 1.5 C threshold will effectively get breached in 2024 and say that way.
https://mailchi.mp/caa/groundhog-day-another-gobsmackingly-bananas-month-whats-up
Figure 4 includes our expectation that continuing record monthly temperatures will carry the 12-month temperature anomaly to +1.6-1.7°C. During subsequent La Ninas, global temperature may fall back below 1.5°C to about 1.4±0.1°C, but the El Nino/La Nina mean will have reached 1.5°C, thus revealing that the 1.5°C global warming ceiling has been passed for all practical purposes because the large planetary energy imbalance assures that global temperature is heading still higher.

I think the yellow-cone is too high but at least he is giving a testable prediction. We should have an indication by the end of this year if he is right. In the Climate Brink's year-end podcast, Zeke Hausfather said that Hanson's yellow-cone predictions were similar to the CMIP6 ensemble mean.
-
2
-
-
1 hour ago, bluewave said:
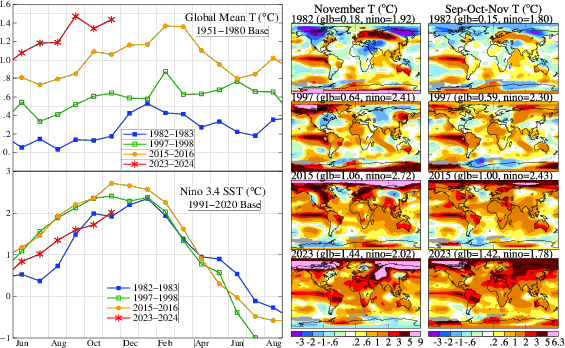
The global temperature spike occurred earlier than usual with this El Niño for some reason. The big annual temperature jump usually occurs following the fall and winter like in 2016 and 1998. This one began in 2023 instead of 2024. Perhaps it was related to how long the La Niña lasted. None of our other El Niños near this magnitude had such a strong 3 year La Niña and -PDO before them.
The 3-year nina was probably also a factor. The 2023 projections were based on the weak nina conditions that existed in the 34 region at the start of the year and 2022 temps (in Hausfather's method - Schmidt uses a 20-year Loess) which were held down by the 3-year nina. The rapid onset of east-based nino flipped the script. Large areas in the EPac went from cool which favors inversions and low clouds to warm which favors mixing and sunshine. There are other factors also. Like you say will take a while to unpack.
2022  10   19.23   -1.78   23.88   -1.11   27.64   -1.12   25.73   -0.99
2022  11   20.52   -1.13   24.16   -0.94   27.71   -0.99   25.80   -0.90
2022  12   22.35   -0.46   24.41   -0.82   27.70   -0.84   25.75   -0.85
2023   1   24.00   -0.56   25.10   -0.56   27.66   -0.66   25.83   -0.72
2023   2   26.58    0.48   26.31   -0.10   27.65   -0.55   26.29   -0.46
2023   3   27.98    1.49   27.50    0.30   28.07   -0.25   27.17   -0.11
2023   4   28.16    2.62   28.05    0.47   28.75    0.13   27.96    0.14
2023   5   26.64    2.22   28.09    0.84   29.22    0.30   28.39    0.46
2023   6   25.63    2.50   27.88    1.26   29.55    0.58   28.57    0.84
-
1
-
-
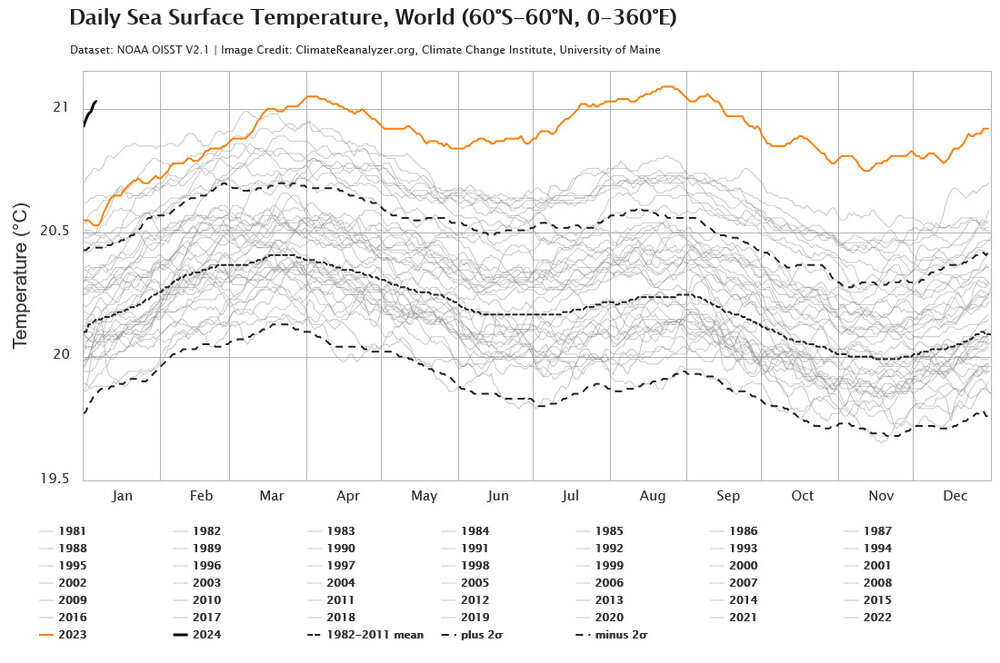
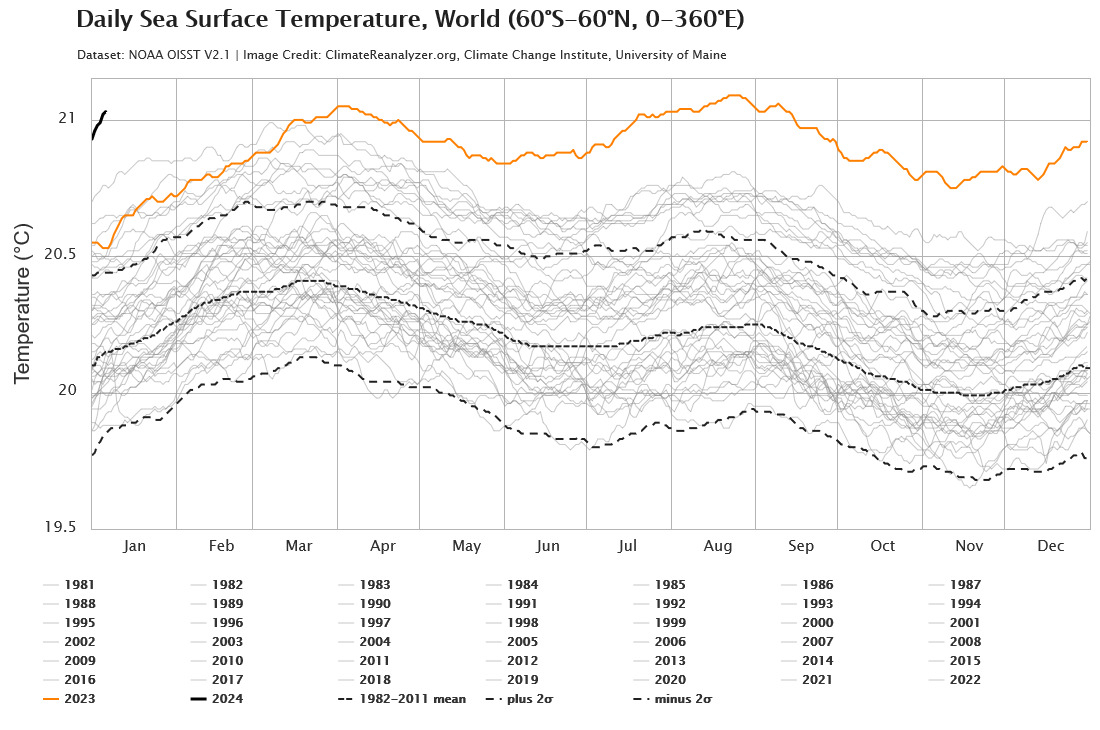
2024 in unchartered SST territory out of the gate.
-
23 hours ago, bluewave said:
2023 came in at 1.48C on ERA5 and 1.43C on JR-55. It will probably take them a while to figure out why this year came in some much warmer than original expectations.
Neither come out and say it, but one source of error in the predictions at the beginning of 2023 was the rapid shift to strong el nino. Will make following this year more interesting. If the predictions for 2024 are good then we can probably give el nino or natural variability most of the blame since the other factors are still in play (Hunga-Tonga, shipping and other aerosols, high climate sensitivity).
-
13 hours ago, bdgwx said:
[Miniere et al. 2023] - Robust acceleration of Earth system heating observed over past six decades

Unfortunately study doesn't cover last couple of years, when Ceres energy balance estimates have continued to spike higher. There is brief discussion in the paper comparing Ceres to the ocean heat data. Ceres is running higher than OHC at the end of the study period, (ending in 2020). There are large error bars though and the difference is not statistically significant. They mention that the ocean heat data only covers 60S to 60N and 0-2000m and could be missing some heat content increase. Bottom-line confirming the recent Ceres spike with ocean heat content data is still an open question.
-
1
-
-
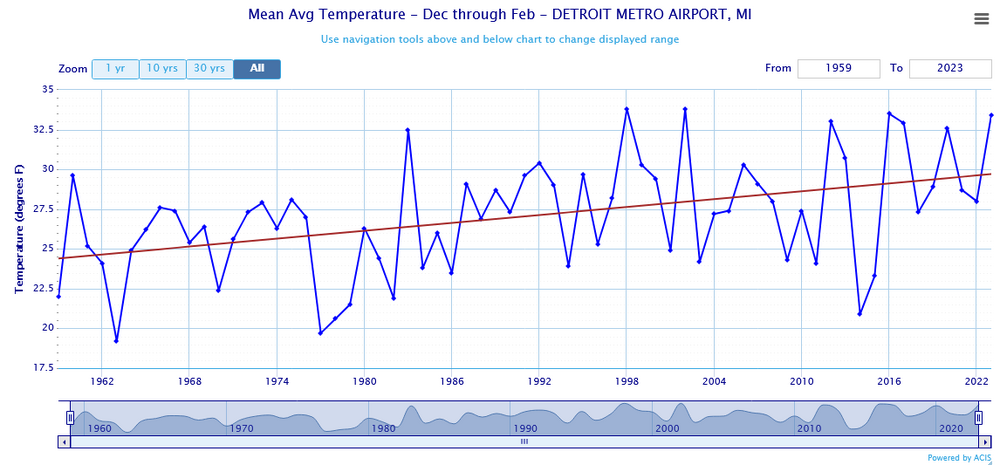
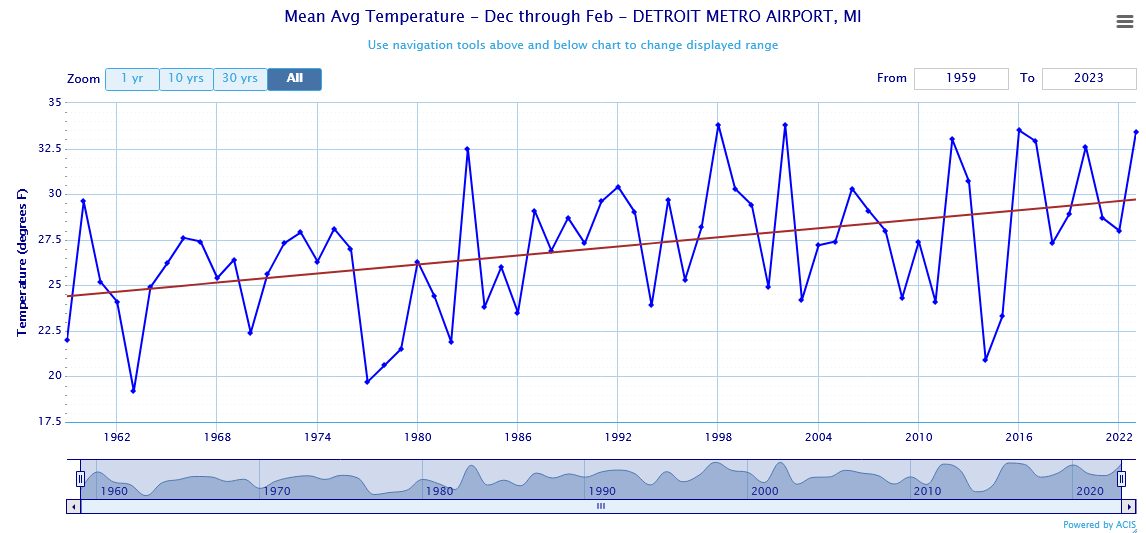
15 hours ago, michsnowfreak said:
I was using the official Detroit data, not a coop station. If anything temperatures are now taken in concrete laden areas when they use to not be. 1970s winters were exponentially harsher than Winters of any other decade of the 20th century here. Likewise, 2000s & 2010s winters were also harsher than winters of the middle third of the 20th century.
NOAA climate analysis uses all the local station data and corrects for bias including heat island effects. My understanding is that currently official NWS data is collected at Metro Airport. The Metro data lines up well the NOAA analysis. Starting the regression in 1959 (as far back as I can obtain data) instead of 1970 doesn't appear to make much difference. Bottom-line: I don't see any evidence that your winter temperature trend experience is much different from mine.
-
1
-
-
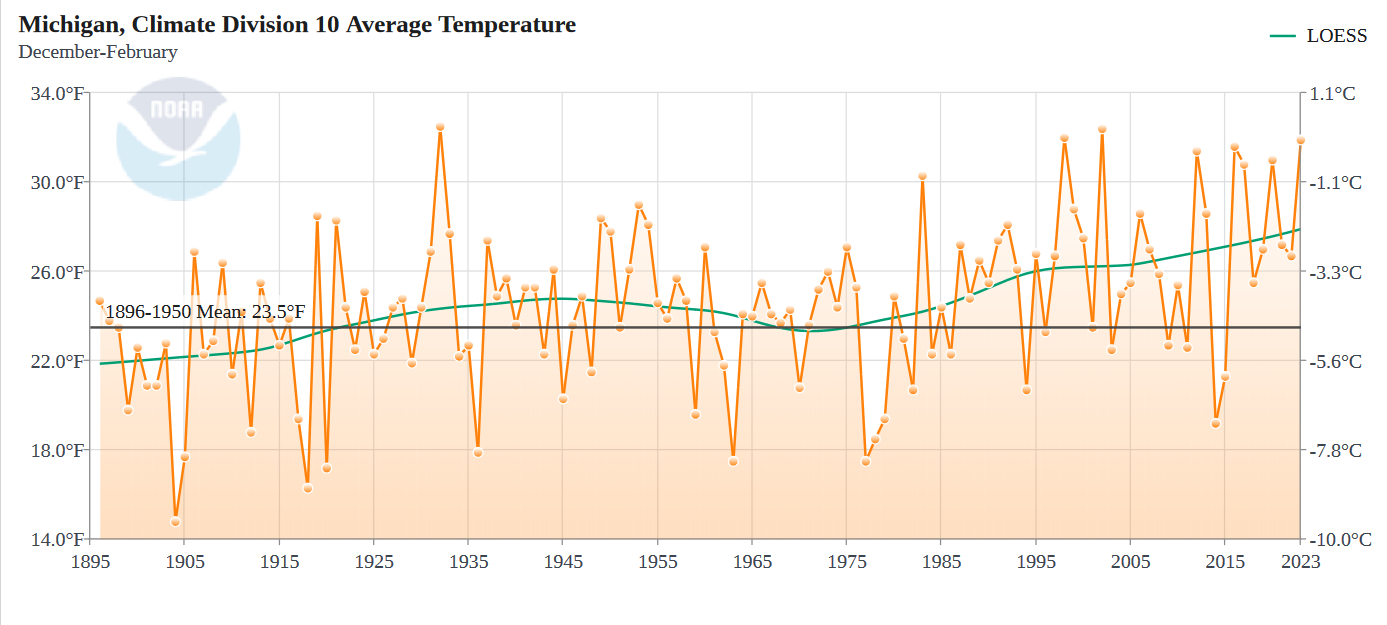
25 minutes ago, michsnowfreak said:
LMAO. There it is again. "Since 1970". Imagine how boring these maps would be if they didnt start in the brutally cold winters of the 1970s?
Detroit winters warmed 5.0F from 1970-2023...but Detroit winters COOLED 4.0F from 1930-1980. I have seen countless graphs starting in 1970, but NEVER ONCE have I seen 1930-80.
From 1880-2020, Detroit winters warmed 1.6F
From 1921-2020, Detroit winters warmed 0.6F.
The rolling 100-year avg, 1924-2023, warmed 1.2F and the entire POR, 1874-2023, warmed 2.0F. You can check ANY of that data on X-macis, a site which uses all of the actual weather data in the period of record (not only since 1970). "Since 1970" has been used for years, and it will continue to be the go-to because it will always show the most extreme warming.
Relax, !970 is used because that's when net man-made climate forcing took off. Here is the whole NOAA analysis for the SE Michigan climate division. 1970 was warmer compared to the period before 1920 and about the same as the 1896-1950 baseline. You need to be careful using raw COOP data, the older data has a known warm bias.

-
1
-
-
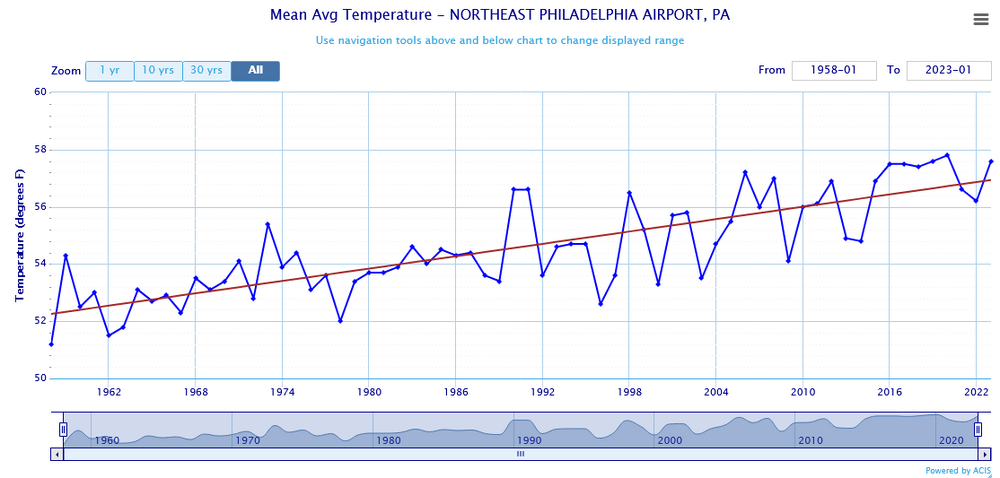
I posted a chart s couple of weeks ago upthread which showed roughly 5F of winter warming at Detroit Metro Airport since it opened in 1958. Looks like many of us are in the same 5F boat.

-
1
-
1
-
-
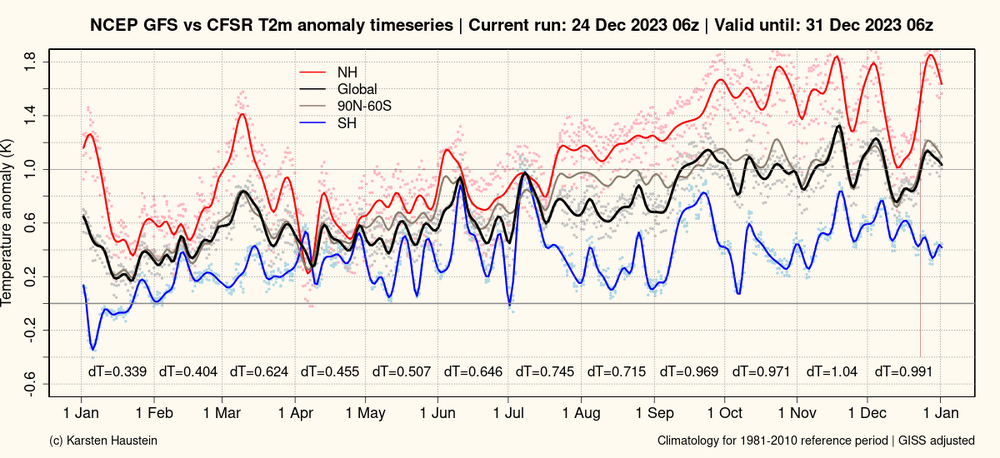
As is often the case in winter, Northern Hemisphere temperatures have been volatile in December. The cold spell in Eurasia did lower North Hemi temps mid-month; but, NHemi has also been almost off the chart warm at times this month. In-any-case December will break records by a large margin, North Hemi and global.
-
3
-
-
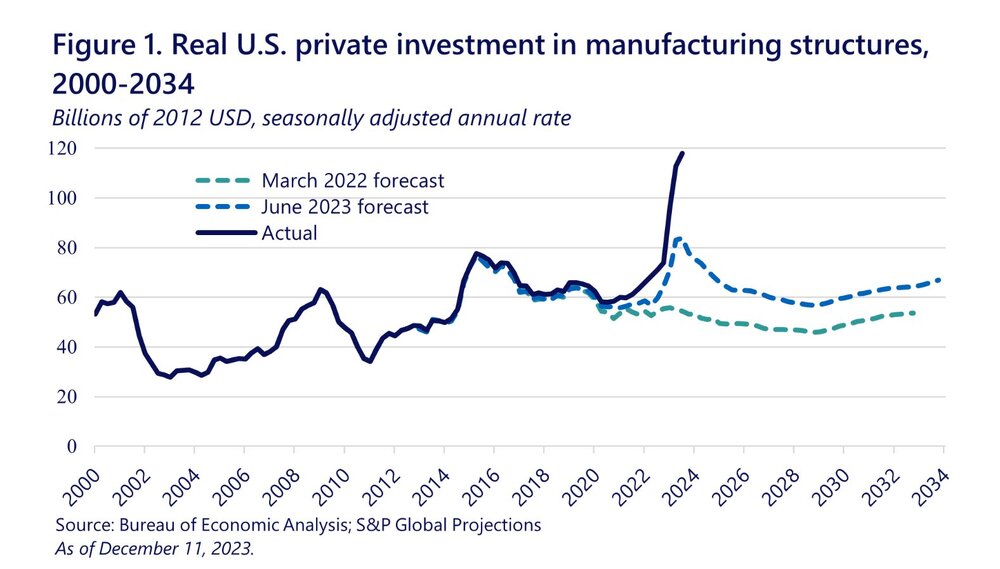
The spike is largely due to last years Inflation Reduction Act i.e. solar, batteries, EV etc.
-
September update continues this years ocean heat content (OHC) spike which started in May. Broadly consistent with Ceres net radiation data which shows an increasing earth energy imbalance, but doesn't match in detail since the Ceres imbalance has been increasing since 2015. Not clear why OHC would spike in a nino, when stored ocean heat is being released to atmosphere and space, but measurement uncertainty probably plays a role. Another one of this years warm-side surprises.
-
2
-
-
32 minutes ago, mclean02 said:
That's true sometimes it really feels hopeless. Just have to keep doing everything we can calling out misinformation when you hear it and reducing your carbon emissions by biking or consolidating trips if possible.
This is why I don't worry about the worst case anymore. Solar can dent fossil fuel demand. Solar+batteries can destroy it.
-
1
-
1
-
-
9 hours ago, mclean02 said:
What is the worst case scenario? And where do you feel we will in 5 to 10 years based on your gut feeling ? As a late 20 year old now I feel like the ship has sailed and we just need to look at stopping 2.0 degrees of warming. In the short time I have been alive here in the southern states I have noticed I have mosquitoes at my parents house and that rain seems way heavier then I recall as a kid. I plan on moving to Detroit or Alaska in the next 5 years I really feel lost sometimes and sad when I look at my nieces sorry for the run on sesentences
I'm not worrying about the worst case. Much more concerned about the best-case. That's what we are frittering away.
-
2
-
-
El Nino comparison chart from Makiko Sato's twitter. The enso regions are warming slower than the rest of the world, so our el ninos aren't what they used to be.
-
2
-
-
Don, yes not much positive out of COP. However, In terms of fossil fuel competitive position there is continuing change afoot. Below is a recent article on China's industrial policy which led to the development of the "new three": solar, batteries and EV which are now driving export growth. Expect competition to continue to increase among the big industrial powers as clean energy technology is increasingly seen as critical for economic growth. Although last years IRA is a good start, not confident in our ability to play the long game. We'll see.
-
1
-


Global Average Temperature 2024
in Climate Change
Posted